| Tissue | Expression Dynamics | Abbreviation |
| Breast | 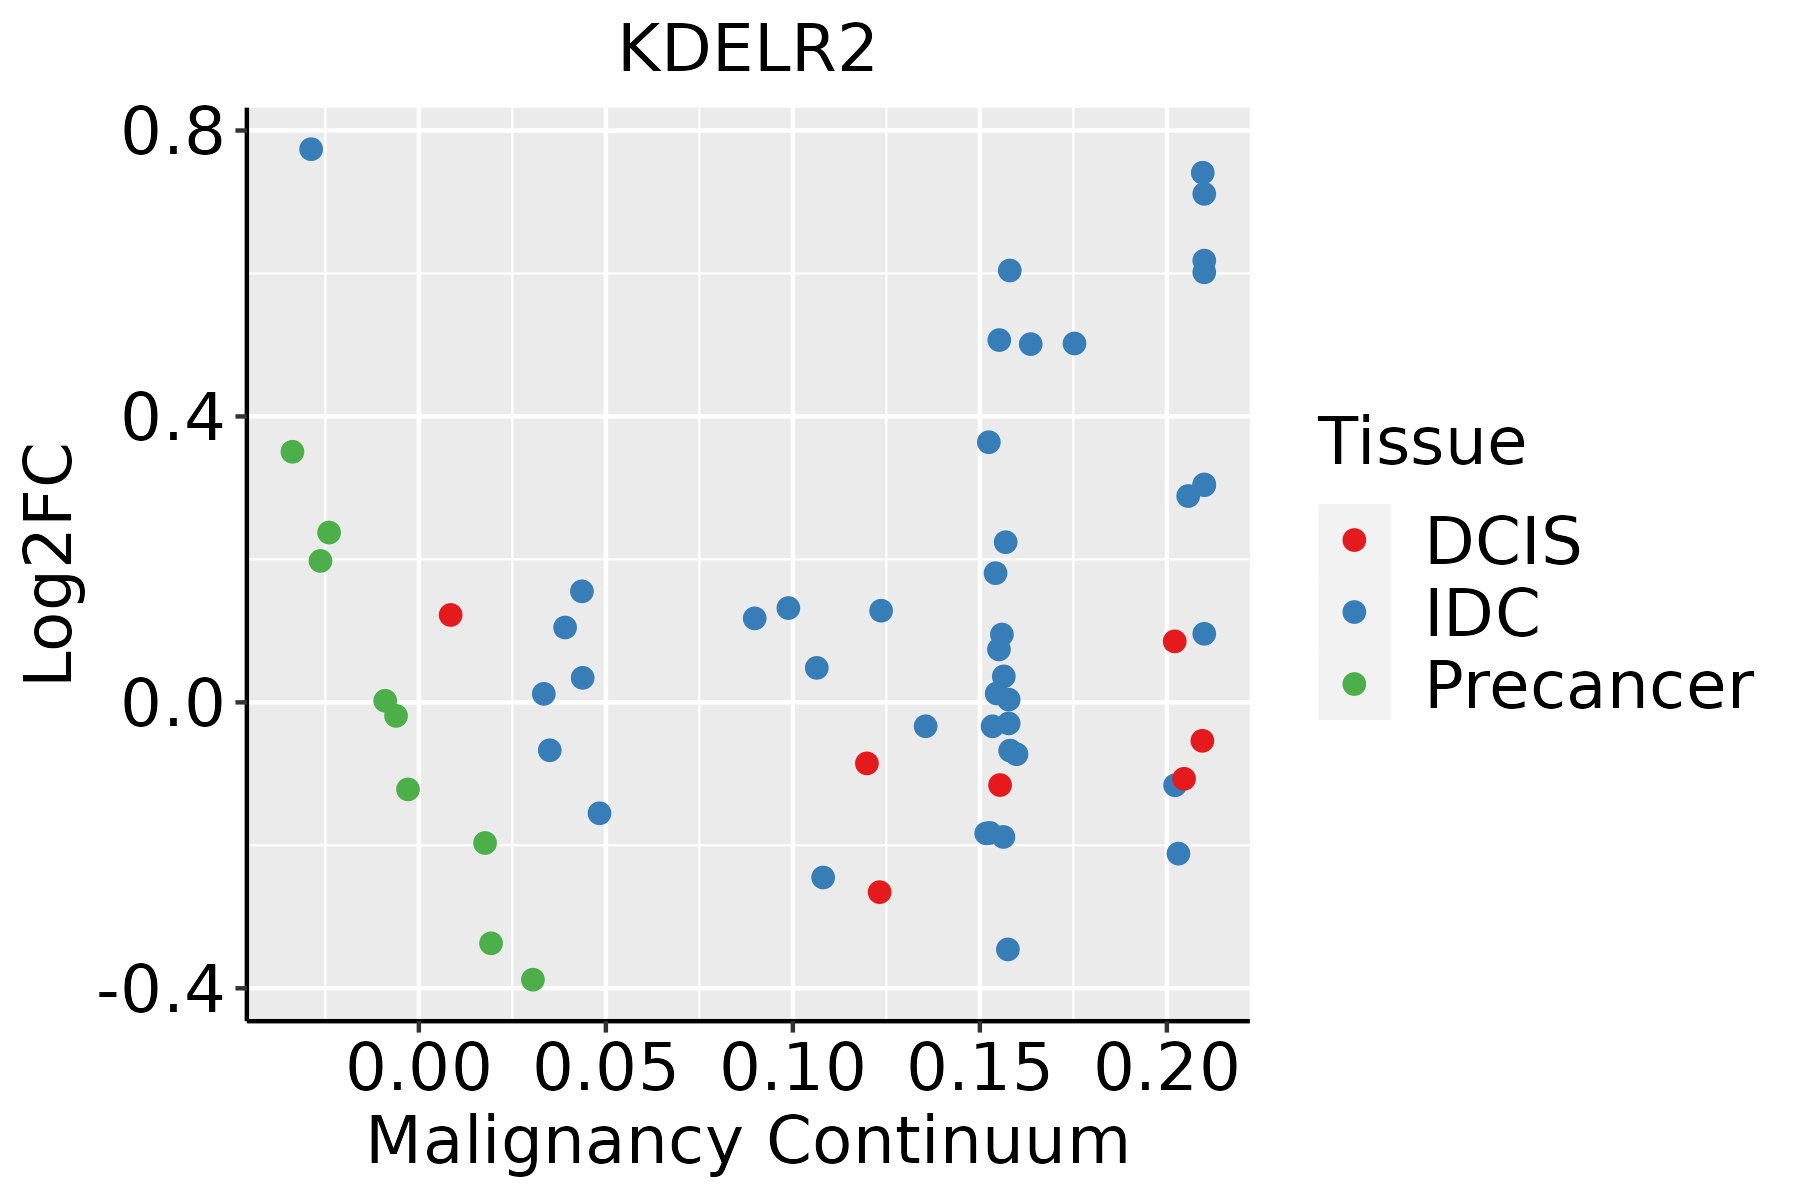 | IDC: Invasive ductal carcinoma |
| DCIS: Ductal carcinoma in situ |
| Precancer(BRCA1-mut): Precancerous lesion from BRCA1 mutation carriers |
| Cervix | 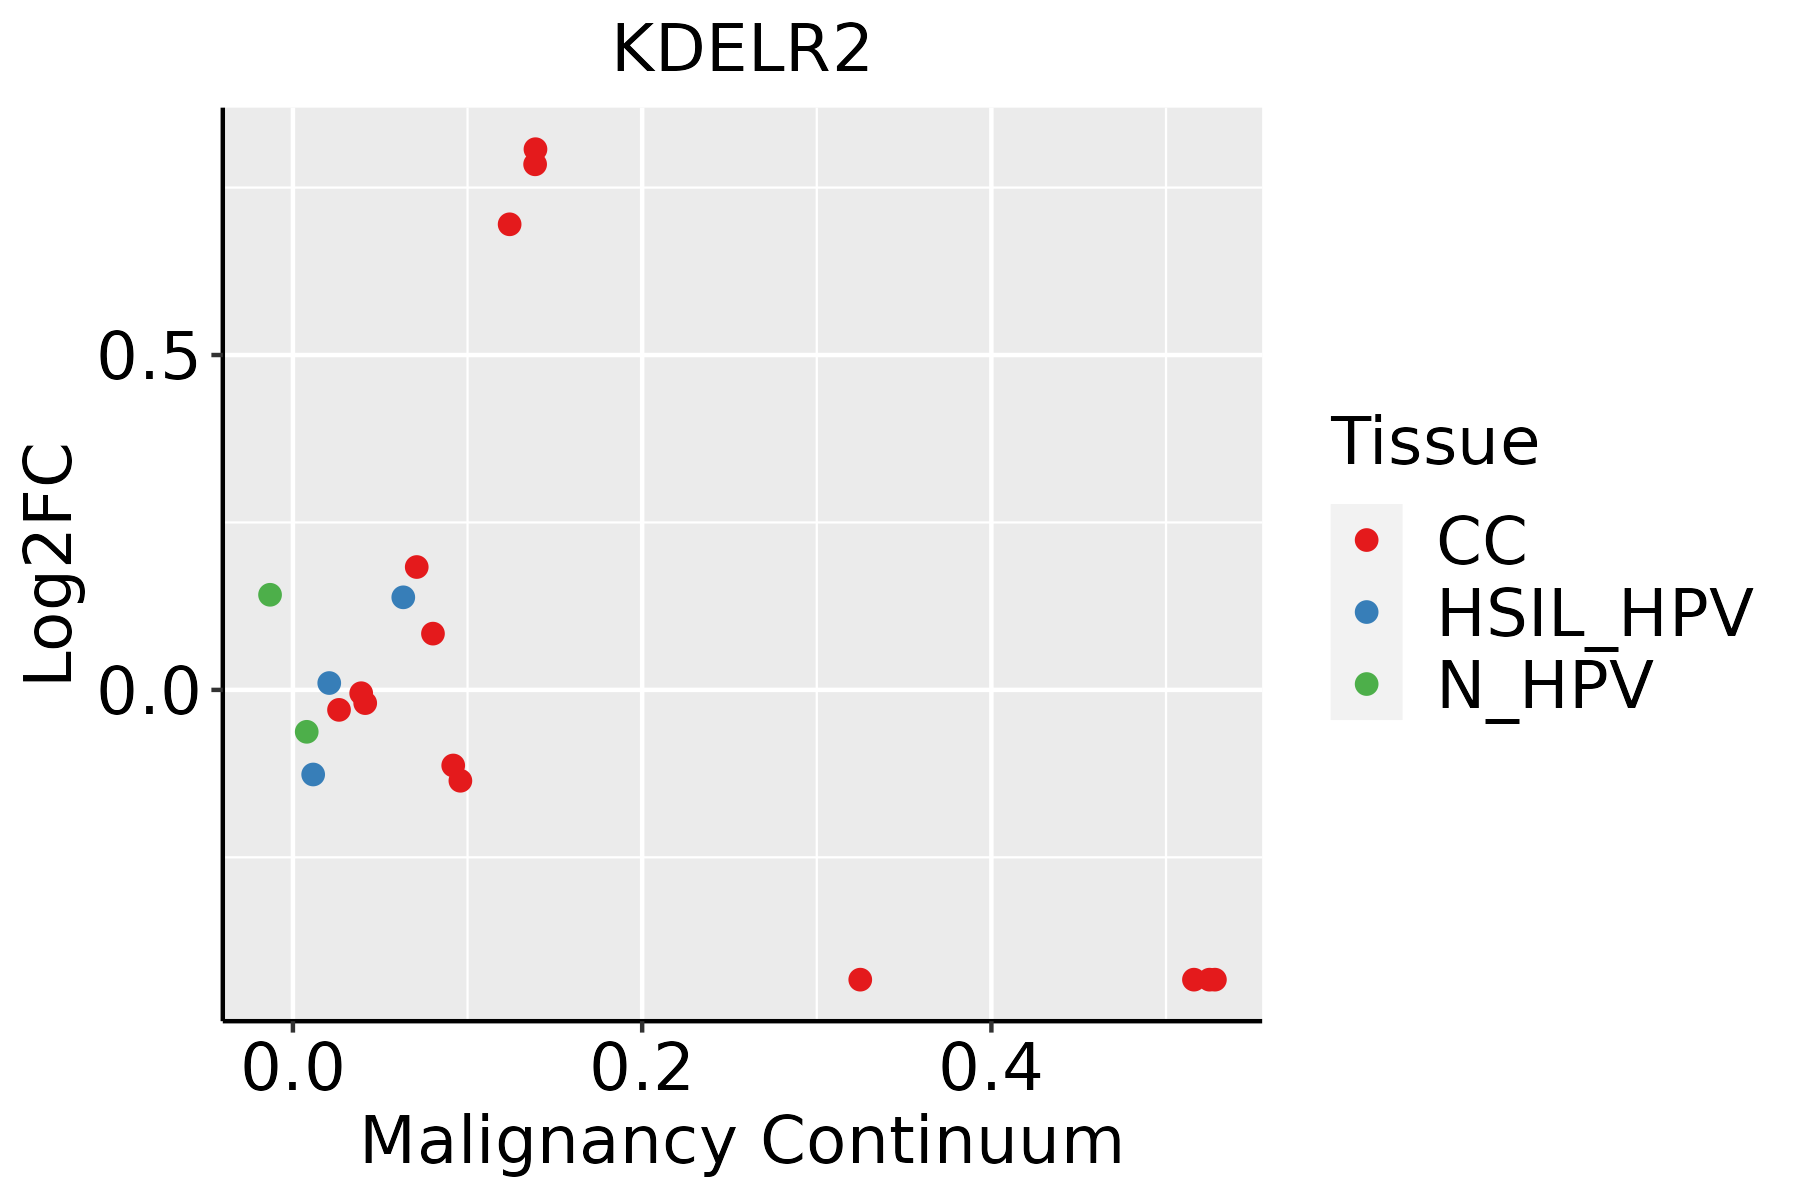 | CC: Cervix cancer |
| HSIL_HPV: HPV-infected high-grade squamous intraepithelial lesions |
| N_HPV: HPV-infected normal cervix |
| Colorectum (GSE201348) |  | FAP: Familial adenomatous polyposis |
| CRC: Colorectal cancer |
| Colorectum (HTA11) |  | AD: Adenomas |
| SER: Sessile serrated lesions |
| MSI-H: Microsatellite-high colorectal cancer |
| MSS: Microsatellite stable colorectal cancer |
| Endometrium | 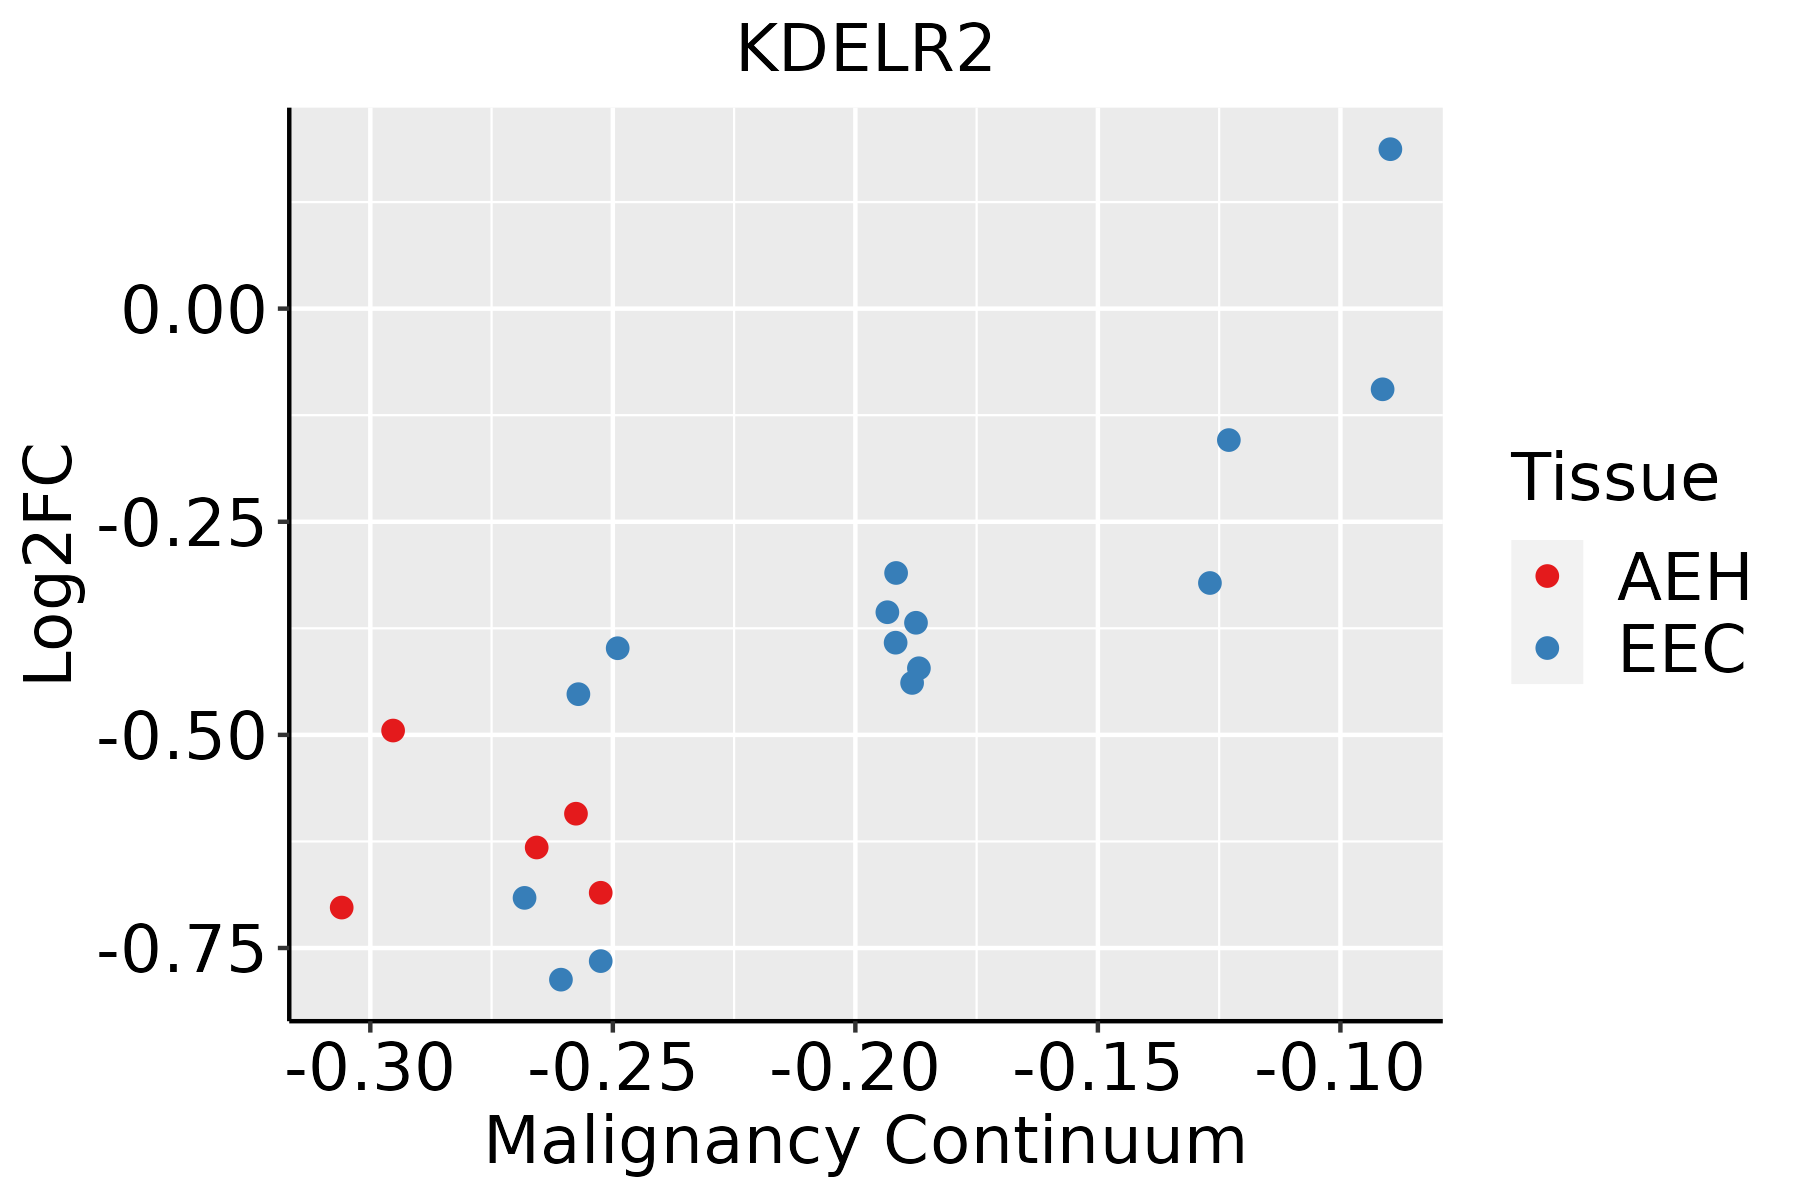 | AEH: Atypical endometrial hyperplasia |
| EEC: Endometrioid Cancer |
| Esophagus | 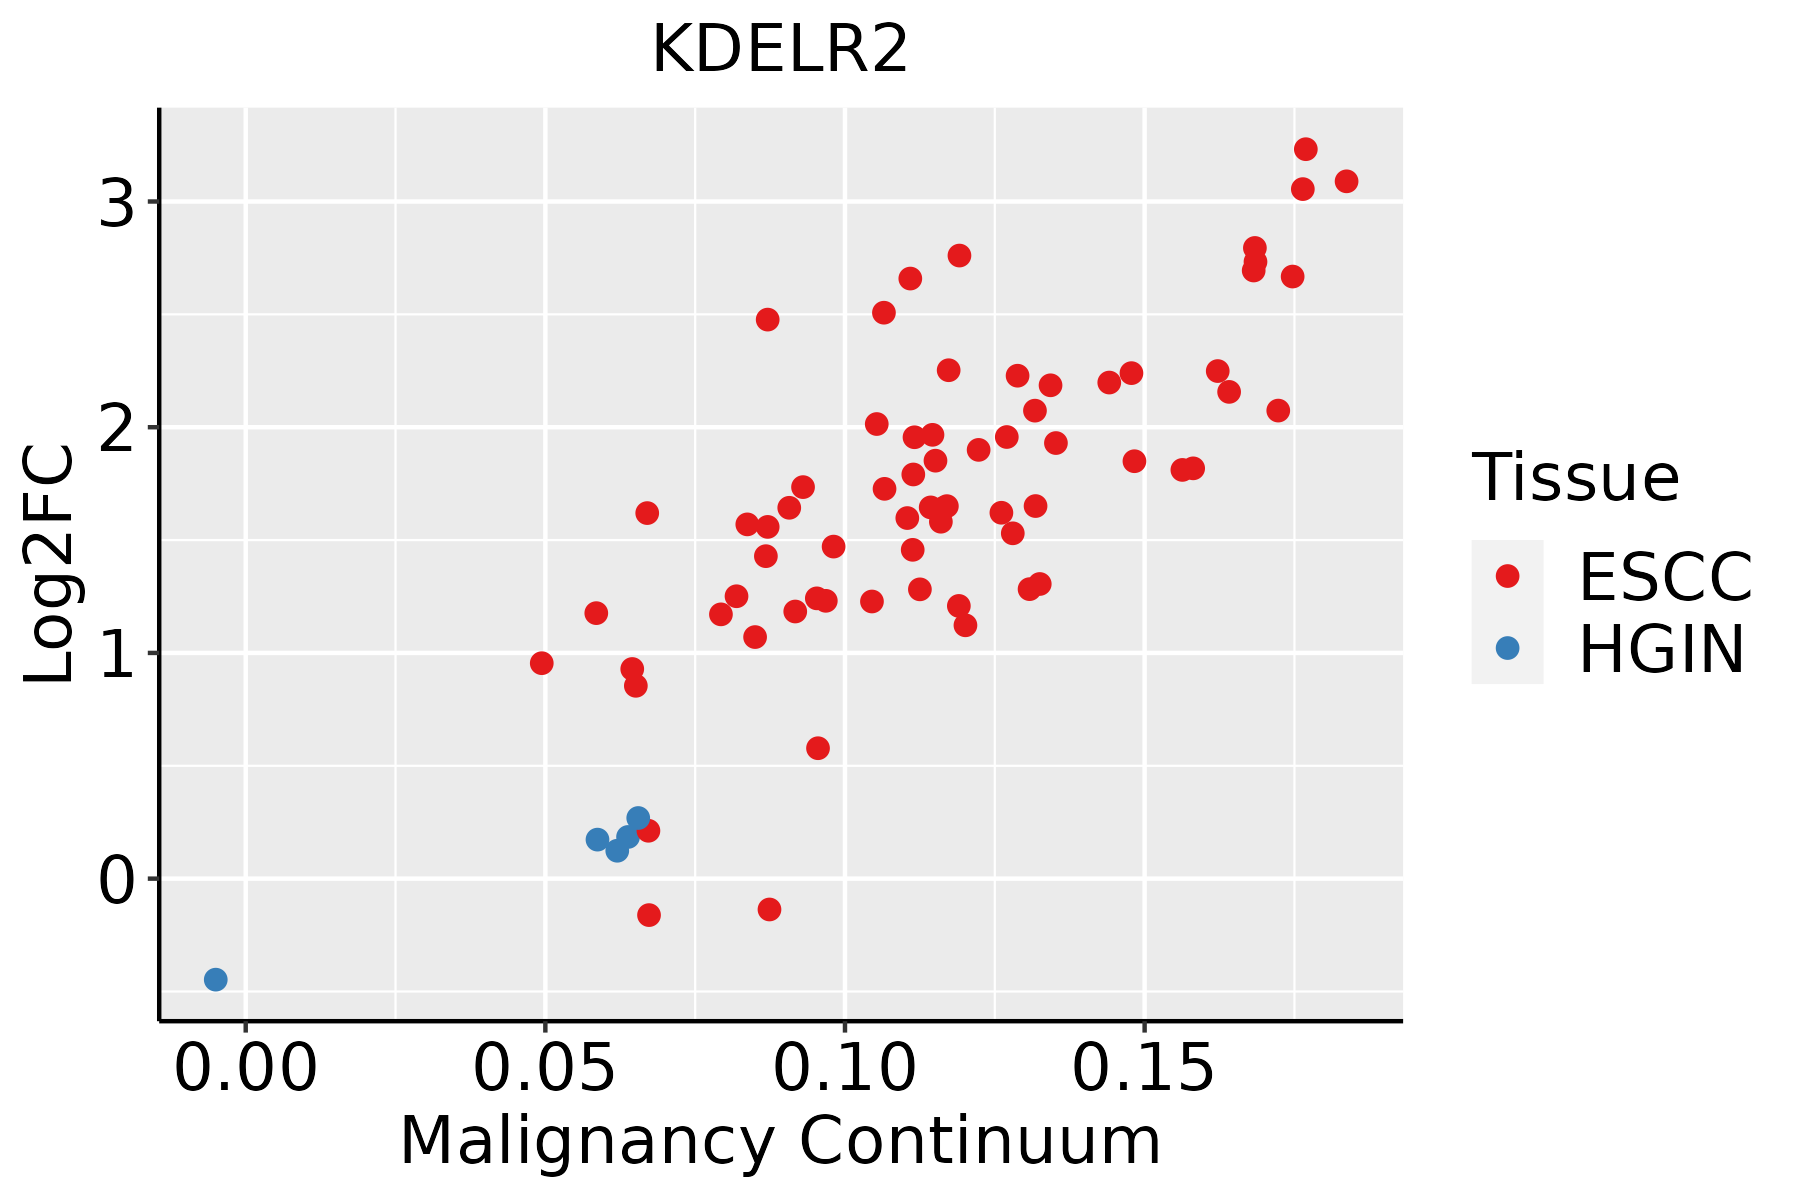 | ESCC: Esophageal squamous cell carcinoma |
| HGIN: High-grade intraepithelial neoplasias |
| LGIN: Low-grade intraepithelial neoplasias |
| Liver | 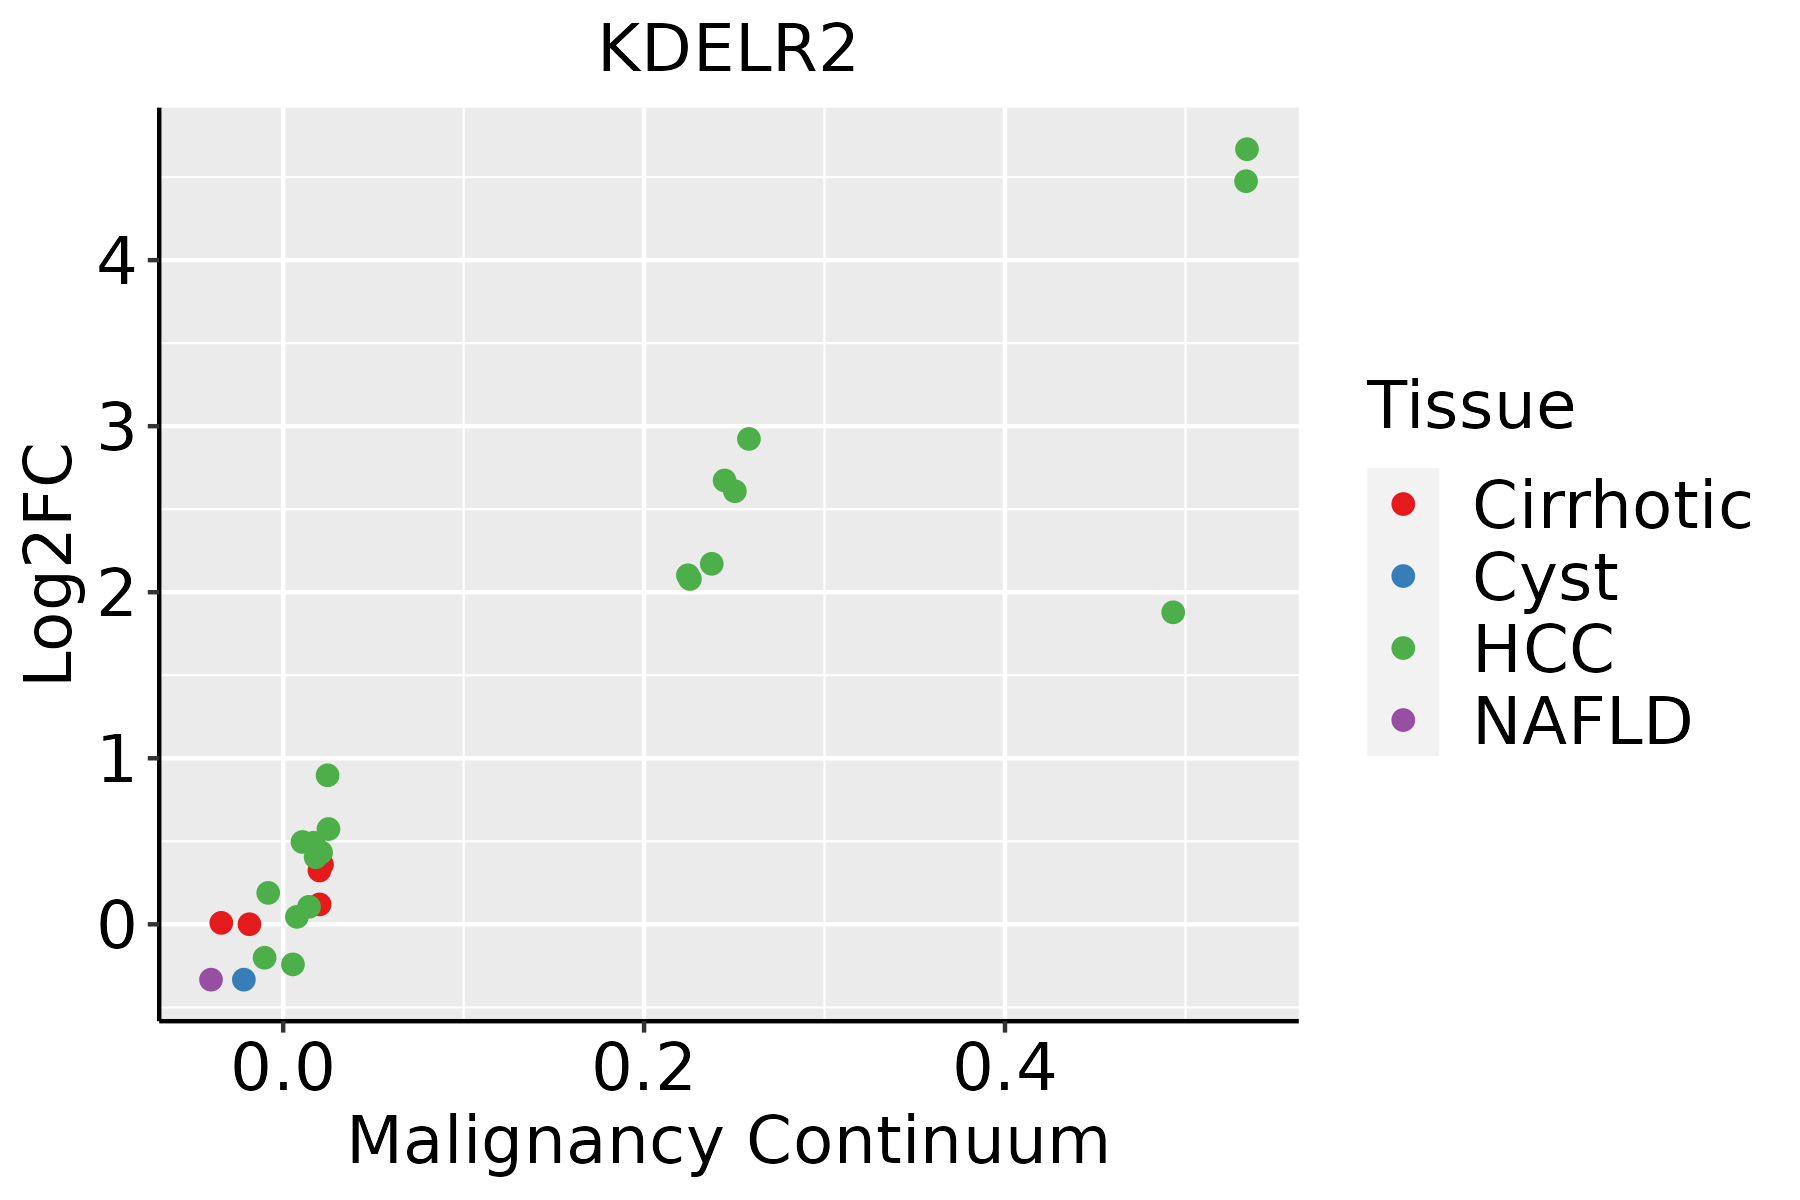 | HCC: Hepatocellular carcinoma |
| NAFLD: Non-alcoholic fatty liver disease |
| Oral Cavity | 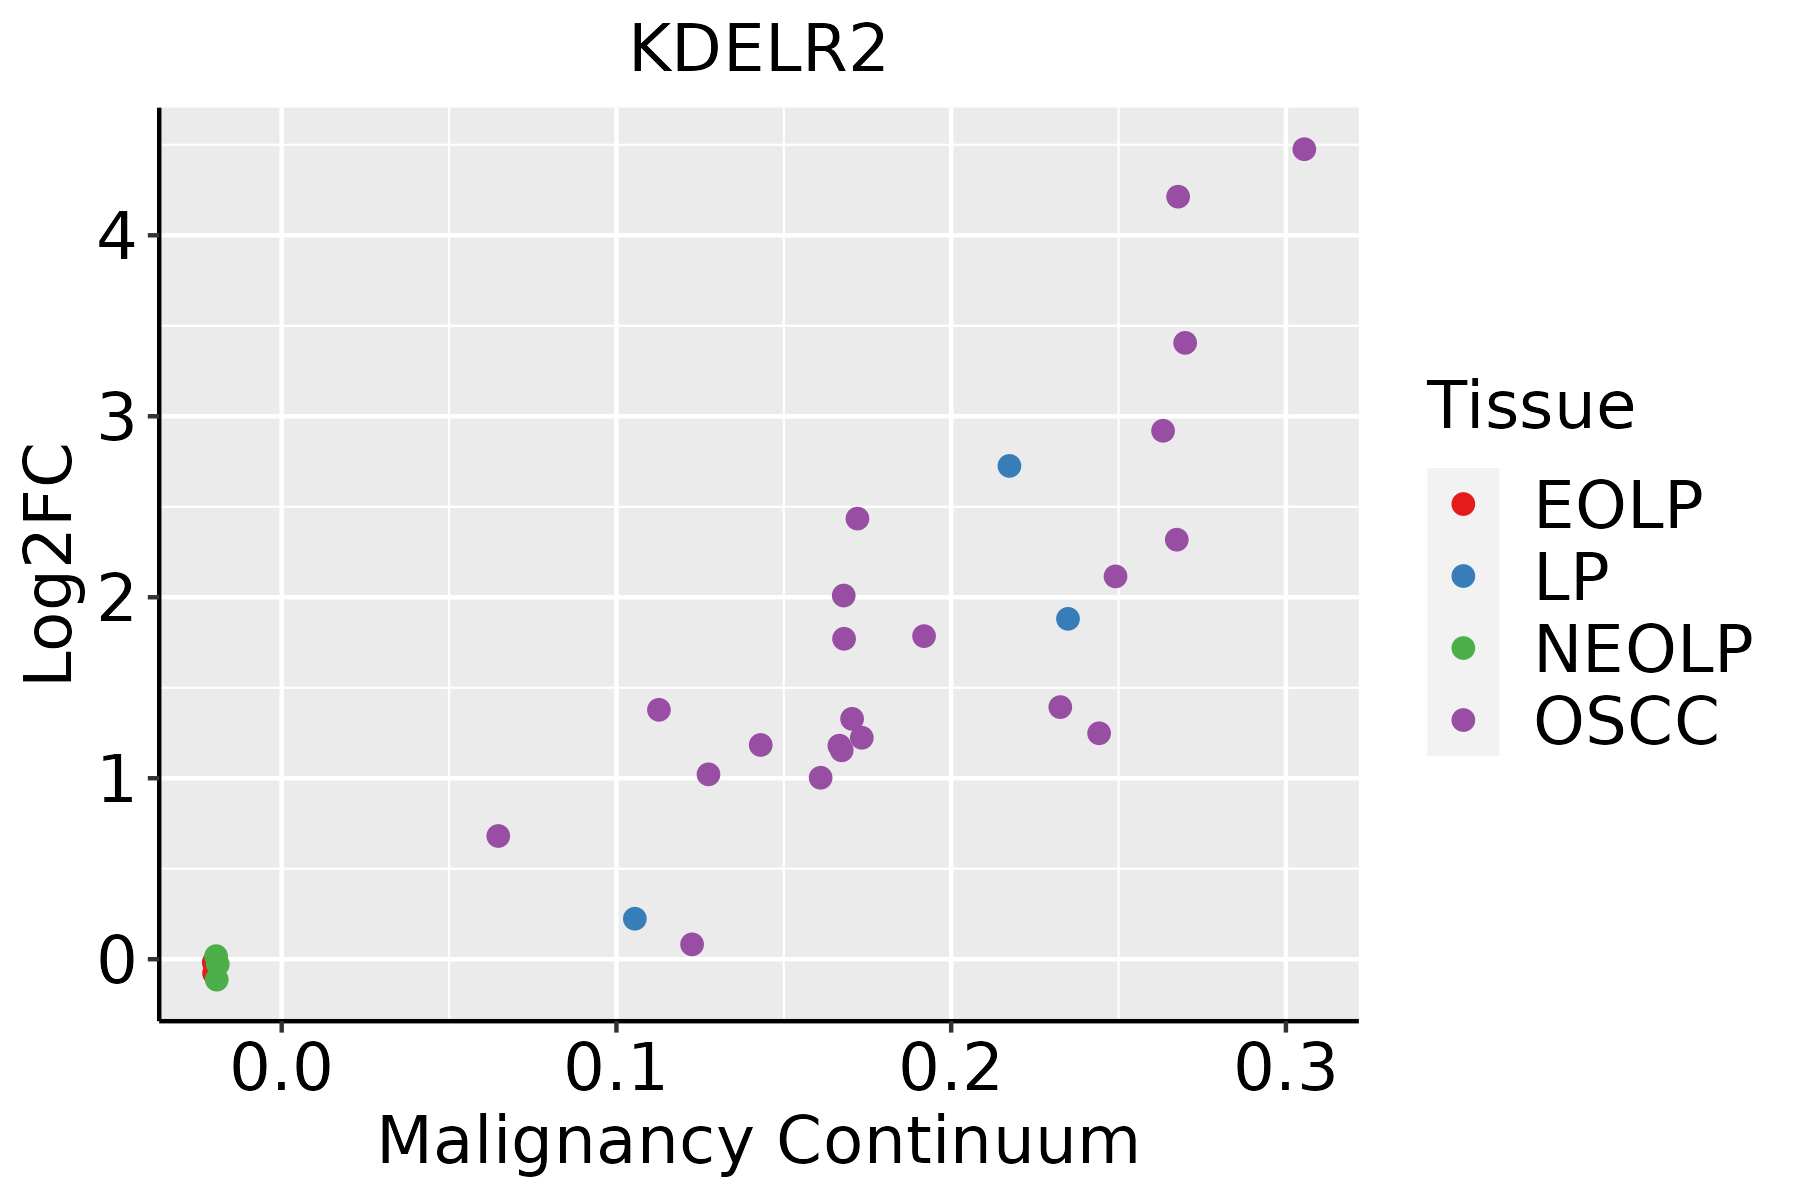 | EOLP: Erosive Oral lichen planus |
| LP: leukoplakia |
| NEOLP: Non-erosive oral lichen planus |
| OSCC: Oral squamous cell carcinoma |
| Prostate | 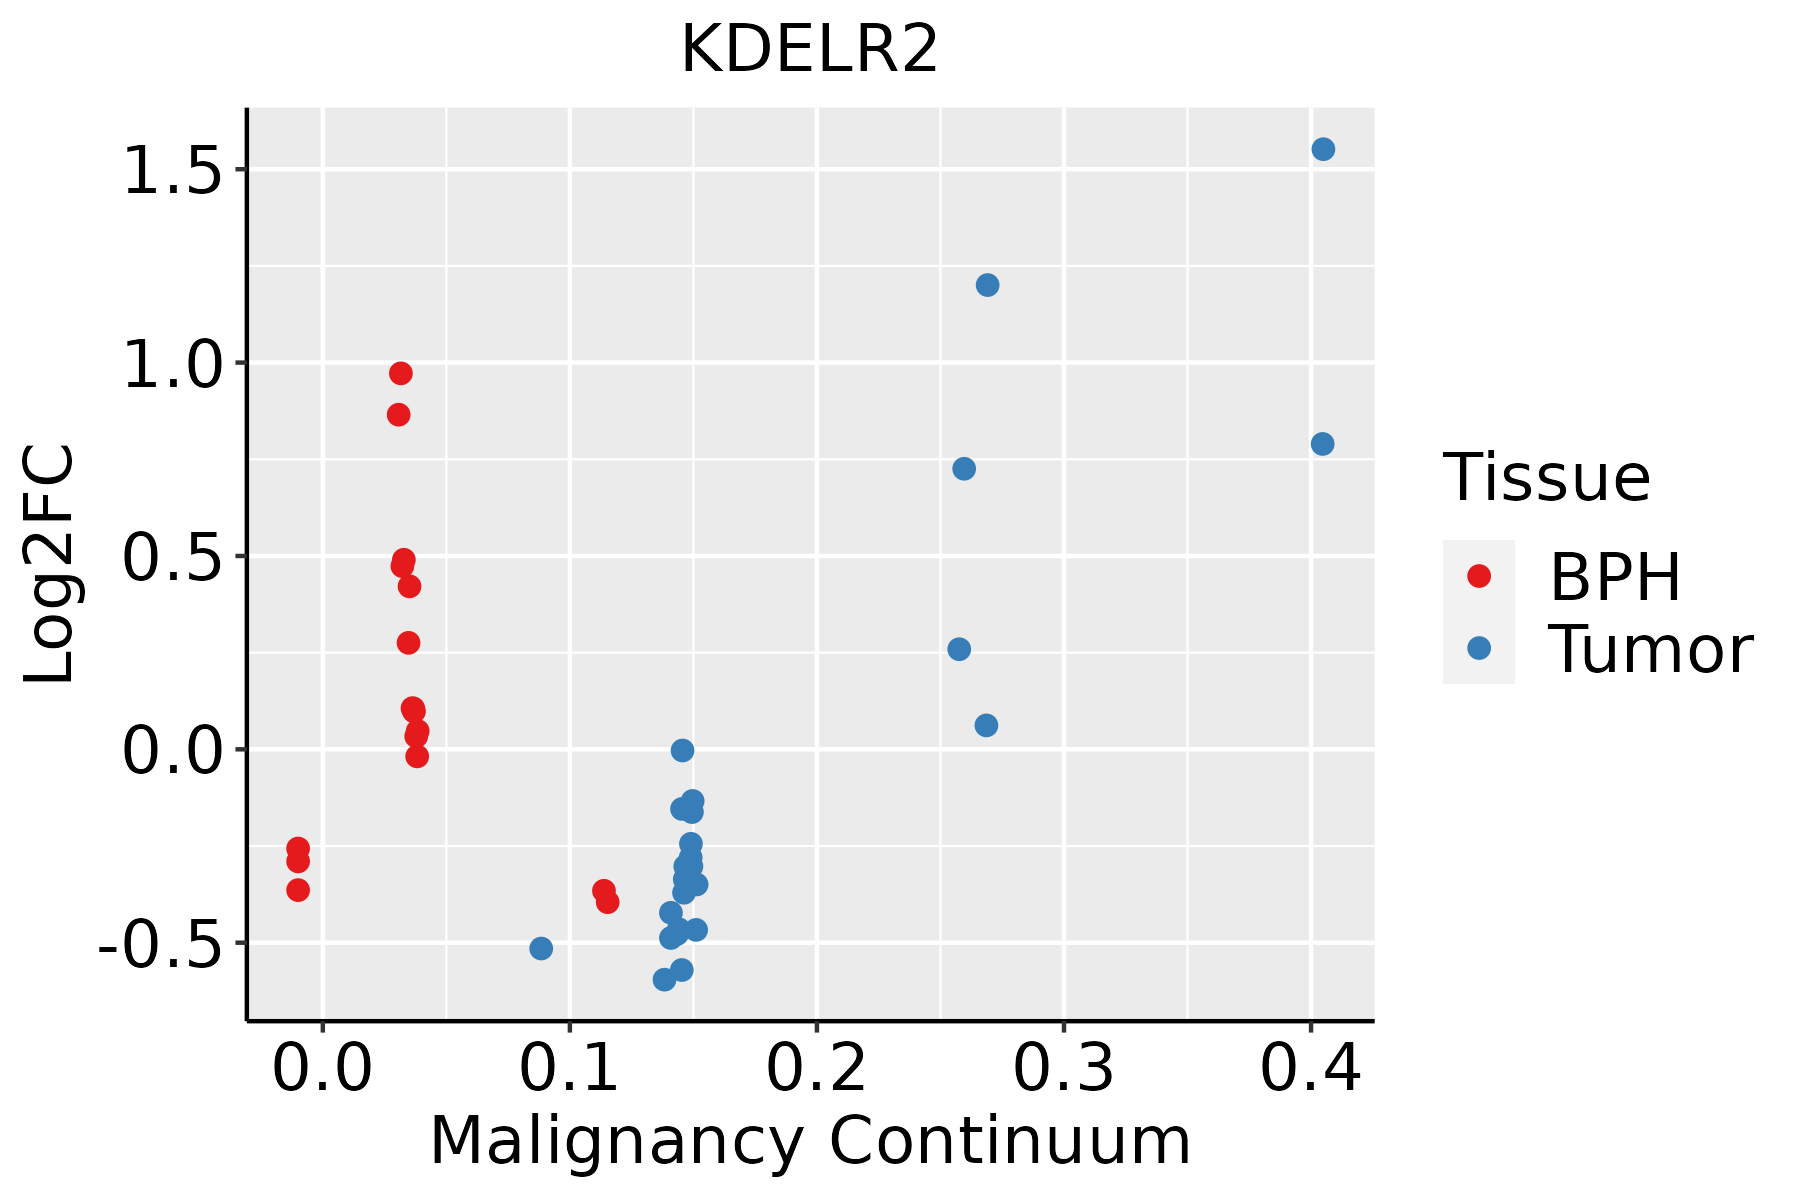 | BPH: Benign Prostatic Hyperplasia |
| Skin |  | AK: Actinic keratosis |
| cSCC: Cutaneous squamous cell carcinoma |
| SCCIS:squamous cell carcinoma in situ |
| Thyroid | 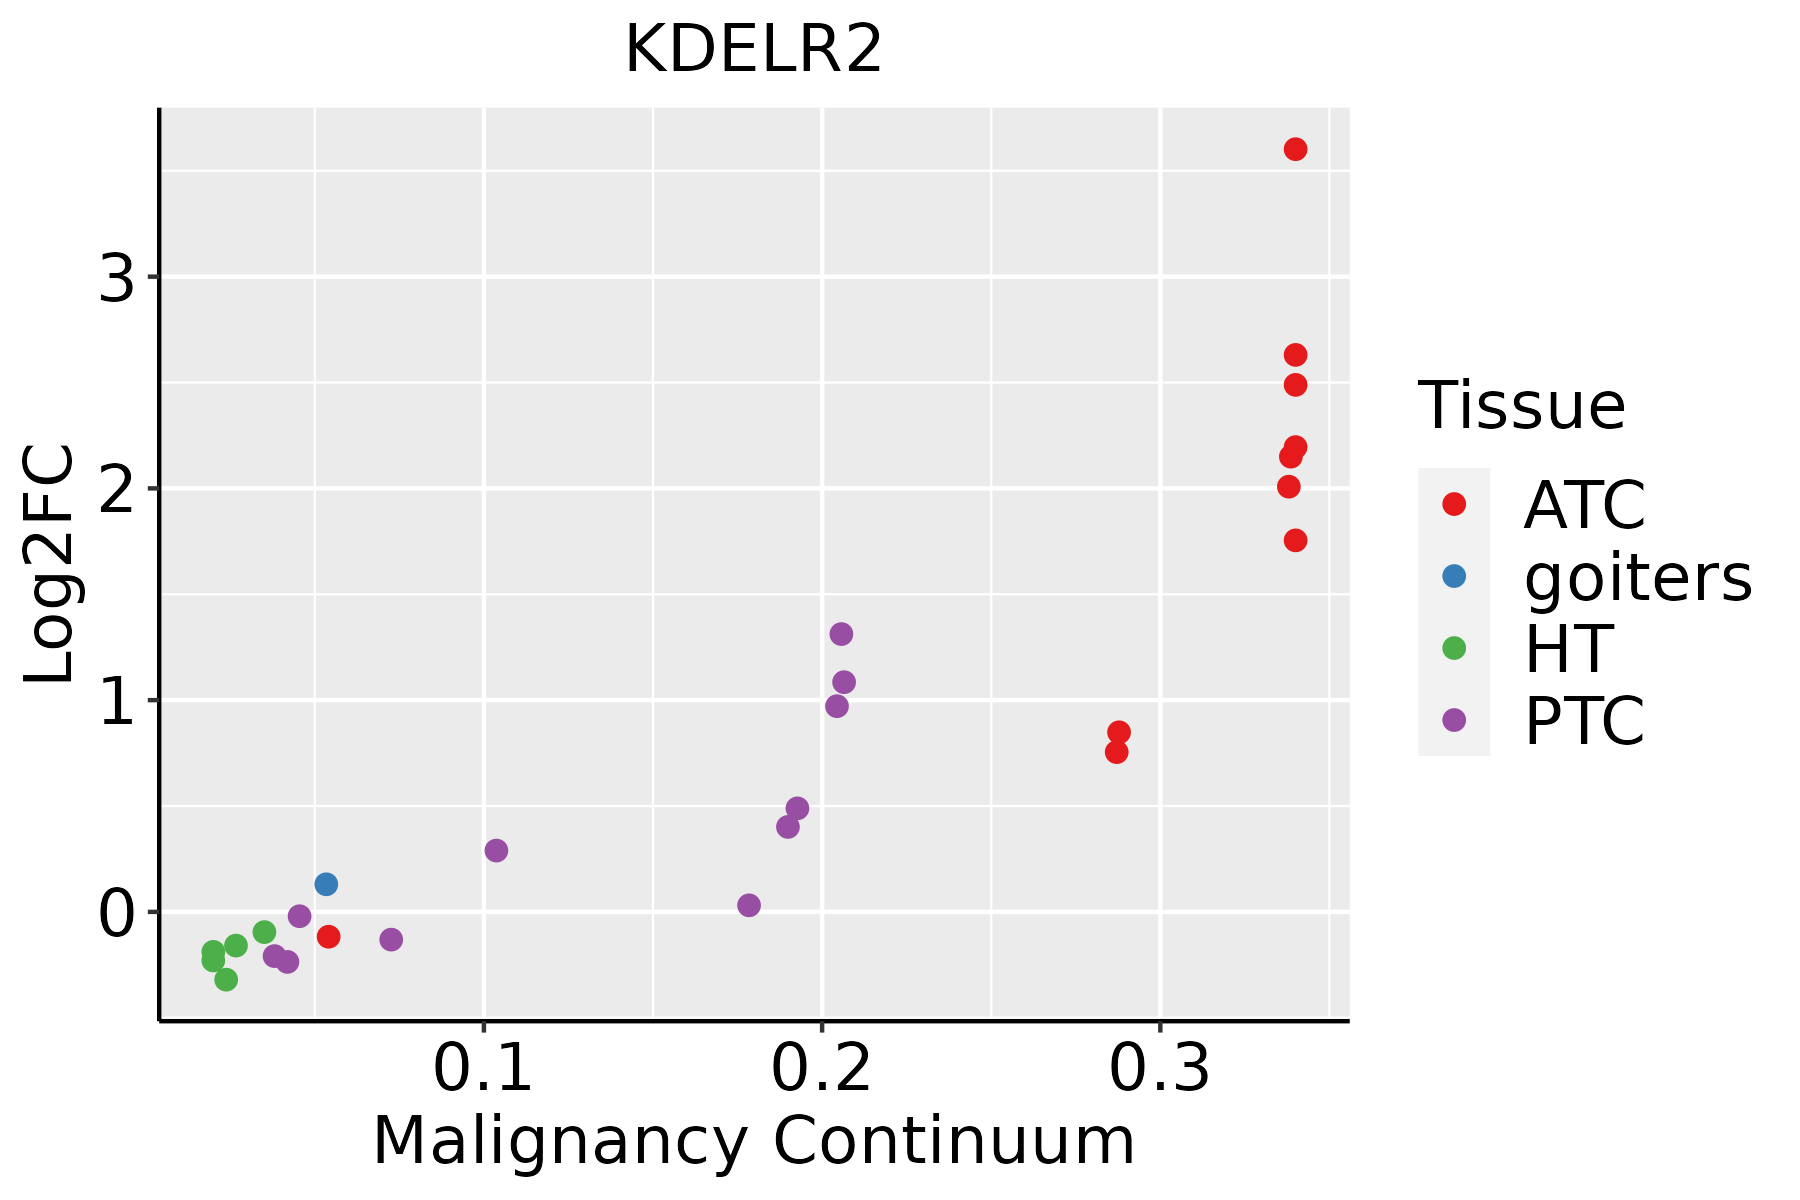 | ATC: Anaplastic thyroid cancer |
| HT: Hashimoto's thyroiditis |
| PTC: Papillary thyroid cancer |
| GO ID | Tissue | Disease Stage | Description | Gene Ratio | Bg Ratio | pvalue | p.adjust | Count |
| GO:00451859 | Breast | Precancer | maintenance of protein location | 19/1080 | 94/18723 | 1.43e-06 | 5.35e-05 | 19 |
| GO:00512358 | Breast | Precancer | maintenance of location | 40/1080 | 327/18723 | 5.85e-06 | 1.71e-04 | 40 |
| GO:00516519 | Breast | Precancer | maintenance of location in cell | 30/1080 | 214/18723 | 5.91e-06 | 1.71e-04 | 30 |
| GO:00325076 | Breast | Precancer | maintenance of protein location in cell | 14/1080 | 65/18723 | 1.59e-05 | 3.89e-04 | 14 |
| GO:00709725 | Breast | Precancer | protein localization to endoplasmic reticulum | 15/1080 | 74/18723 | 1.74e-05 | 4.17e-04 | 15 |
| GO:00725954 | Breast | Precancer | maintenance of protein localization in organelle | 10/1080 | 42/18723 | 1.06e-04 | 1.93e-03 | 10 |
| GO:00354373 | Breast | Precancer | maintenance of protein localization in endoplasmic reticulum | 4/1080 | 14/18723 | 6.92e-03 | 4.67e-02 | 4 |
| GO:005165114 | Breast | IDC | maintenance of location in cell | 37/1434 | 214/18723 | 2.39e-06 | 9.35e-05 | 37 |
| GO:004518514 | Breast | IDC | maintenance of protein location | 21/1434 | 94/18723 | 6.69e-06 | 2.05e-04 | 21 |
| GO:007097213 | Breast | IDC | protein localization to endoplasmic reticulum | 18/1434 | 74/18723 | 8.58e-06 | 2.47e-04 | 18 |
| GO:005123513 | Breast | IDC | maintenance of location | 48/1434 | 327/18723 | 9.90e-06 | 2.77e-04 | 48 |
| GO:003250714 | Breast | IDC | maintenance of protein location in cell | 16/1434 | 65/18723 | 2.29e-05 | 5.51e-04 | 16 |
| GO:007259512 | Breast | IDC | maintenance of protein localization in organelle | 12/1434 | 42/18723 | 4.94e-05 | 1.08e-03 | 12 |
| GO:00354371 | Breast | IDC | maintenance of protein localization in endoplasmic reticulum | 6/1434 | 14/18723 | 3.50e-04 | 5.13e-03 | 6 |
| GO:00068906 | Breast | IDC | retrograde vesicle-mediated transport, Golgi to endoplasmic reticulum | 10/1434 | 52/18723 | 5.49e-03 | 4.03e-02 | 10 |
| GO:005165123 | Breast | DCIS | maintenance of location in cell | 36/1390 | 214/18723 | 3.07e-06 | 1.02e-04 | 36 |
| GO:004518521 | Breast | DCIS | maintenance of protein location | 21/1390 | 94/18723 | 4.12e-06 | 1.24e-04 | 21 |
| GO:007097222 | Breast | DCIS | protein localization to endoplasmic reticulum | 18/1390 | 74/18723 | 5.57e-06 | 1.60e-04 | 18 |
| GO:005123523 | Breast | DCIS | maintenance of location | 47/1390 | 327/18723 | 9.55e-06 | 2.56e-04 | 47 |
| GO:003250722 | Breast | DCIS | maintenance of protein location in cell | 16/1390 | 65/18723 | 1.56e-05 | 3.79e-04 | 16 |
| Pathway ID | Tissue | Disease Stage | Description | Gene Ratio | Bg Ratio | pvalue | p.adjust | qvalue | Count |
| hsa0511014 | Breast | Precancer | Vibrio cholerae infection | 14/684 | 50/8465 | 2.67e-05 | 2.64e-04 | 2.02e-04 | 14 |
| hsa0511015 | Breast | Precancer | Vibrio cholerae infection | 14/684 | 50/8465 | 2.67e-05 | 2.64e-04 | 2.02e-04 | 14 |
| hsa0511022 | Breast | IDC | Vibrio cholerae infection | 17/867 | 50/8465 | 4.82e-06 | 6.82e-05 | 5.10e-05 | 17 |
| hsa0511032 | Breast | IDC | Vibrio cholerae infection | 17/867 | 50/8465 | 4.82e-06 | 6.82e-05 | 5.10e-05 | 17 |
| hsa0511041 | Breast | DCIS | Vibrio cholerae infection | 17/846 | 50/8465 | 3.45e-06 | 4.45e-05 | 3.28e-05 | 17 |
| hsa0511051 | Breast | DCIS | Vibrio cholerae infection | 17/846 | 50/8465 | 3.45e-06 | 4.45e-05 | 3.28e-05 | 17 |
| hsa0511016 | Cervix | CC | Vibrio cholerae infection | 18/1267 | 50/8465 | 1.91e-04 | 1.11e-03 | 6.55e-04 | 18 |
| hsa0511017 | Cervix | CC | Vibrio cholerae infection | 18/1267 | 50/8465 | 1.91e-04 | 1.11e-03 | 6.55e-04 | 18 |
| hsa0511023 | Cervix | N_HPV | Vibrio cholerae infection | 8/349 | 50/8465 | 9.07e-04 | 6.49e-03 | 5.08e-03 | 8 |
| hsa0511033 | Cervix | N_HPV | Vibrio cholerae infection | 8/349 | 50/8465 | 9.07e-04 | 6.49e-03 | 5.08e-03 | 8 |
| hsa05110 | Colorectum | AD | Vibrio cholerae infection | 29/2092 | 50/8465 | 5.10e-07 | 7.12e-06 | 4.54e-06 | 29 |
| hsa051101 | Colorectum | AD | Vibrio cholerae infection | 29/2092 | 50/8465 | 5.10e-07 | 7.12e-06 | 4.54e-06 | 29 |
| hsa051102 | Colorectum | SER | Vibrio cholerae infection | 24/1580 | 50/8465 | 2.17e-06 | 3.13e-05 | 2.28e-05 | 24 |
| hsa051103 | Colorectum | SER | Vibrio cholerae infection | 24/1580 | 50/8465 | 2.17e-06 | 3.13e-05 | 2.28e-05 | 24 |
| hsa051104 | Colorectum | MSS | Vibrio cholerae infection | 27/1875 | 50/8465 | 8.58e-07 | 1.20e-05 | 7.34e-06 | 27 |
| hsa051105 | Colorectum | MSS | Vibrio cholerae infection | 27/1875 | 50/8465 | 8.58e-07 | 1.20e-05 | 7.34e-06 | 27 |
| hsa051106 | Colorectum | MSI-H | Vibrio cholerae infection | 18/797 | 50/8465 | 2.77e-07 | 5.61e-06 | 4.70e-06 | 18 |
| hsa051107 | Colorectum | MSI-H | Vibrio cholerae infection | 18/797 | 50/8465 | 2.77e-07 | 5.61e-06 | 4.70e-06 | 18 |
| hsa0511018 | Endometrium | AEH | Vibrio cholerae infection | 18/1197 | 50/8465 | 9.09e-05 | 8.69e-04 | 6.36e-04 | 18 |
| hsa0511019 | Endometrium | AEH | Vibrio cholerae infection | 18/1197 | 50/8465 | 9.09e-05 | 8.69e-04 | 6.36e-04 | 18 |
| Hugo Symbol | Variant Class | Variant Classification | dbSNP RS | HGVSc | HGVSp | HGVSp Short | SWISSPROT | BIOTYPE | SIFT | PolyPhen | Tumor Sample Barcode | Tissue | Histology | Sex | Age | Stage | Therapy Types | Drugs | Outcome |
| KDELR2 | SNV | Missense_Mutation | novel | c.229C>A | p.Leu77Met | p.L77M | P33947 | protein_coding | tolerated(0.26) | benign(0.21) | TCGA-BH-A0H0-01 | Breast | breast invasive carcinoma | Female | >=65 | I/II | Hormone Therapy | arimidex | SD |
| KDELR2 | SNV | Missense_Mutation | rs200179757 | c.343N>T | p.Pro115Ser | p.P115S | P33947 | protein_coding | tolerated(0.4) | possibly_damaging(0.799) | TCGA-S3-AA15-01 | Breast | breast invasive carcinoma | Female | <65 | I/II | Chemotherapy | adriamycin | CR |
| KDELR2 | SNV | Missense_Mutation | novel | c.158C>A | p.Thr53Asn | p.T53N | P33947 | protein_coding | deleterious(0.04) | possibly_damaging(0.72) | TCGA-A5-A2K5-01 | Endometrium | uterine corpus endometrioid carcinoma | Female | >=65 | I/II | Unknown | Unknown | SD |
| KDELR2 | SNV | Missense_Mutation | novel | c.475N>T | p.Arg159Cys | p.R159C | P33947 | protein_coding | deleterious(0) | probably_damaging(1) | TCGA-AP-A1DV-01 | Endometrium | uterine corpus endometrioid carcinoma | Female | <65 | I/II | Unknown | Unknown | SD |
| KDELR2 | SNV | Missense_Mutation | rs762563240 | c.185C>T | p.Ser62Phe | p.S62F | P33947 | protein_coding | tolerated(0.35) | benign(0) | TCGA-AX-A2HC-01 | Endometrium | uterine corpus endometrioid carcinoma | Female | <65 | III/IV | Chemotherapy | paclitaxel | PD |
| KDELR2 | SNV | Missense_Mutation | novel | c.106N>G | p.Ser36Gly | p.S36G | P33947 | protein_coding | deleterious(0.03) | benign(0.246) | TCGA-B5-A3FA-01 | Endometrium | uterine corpus endometrioid carcinoma | Female | >=65 | I/II | Unknown | Unknown | SD |
| KDELR2 | SNV | Missense_Mutation | novel | c.538N>A | p.Ala180Thr | p.A180T | P33947 | protein_coding | tolerated(0.08) | possibly_damaging(0.839) | TCGA-EY-A215-01 | Endometrium | uterine corpus endometrioid carcinoma | Female | <65 | I/II | Unknown | Unknown | SD |
| KDELR2 | SNV | Missense_Mutation | novel | c.496N>C | p.Trp166Arg | p.W166R | P33947 | protein_coding | deleterious(0) | probably_damaging(1) | TCGA-FI-A2F4-01 | Endometrium | uterine corpus endometrioid carcinoma | Female | <65 | I/II | Unknown | Unknown | SD |
| KDELR2 | SNV | Missense_Mutation | novel | c.227N>G | p.Tyr76Cys | p.Y76C | P33947 | protein_coding | deleterious(0.01) | probably_damaging(0.928) | TCGA-DD-AAE0-01 | Liver | liver hepatocellular carcinoma | Female | <65 | III/IV | Unknown | Unknown | SD |
| KDELR2 | SNV | Missense_Mutation | | c.398N>T | p.Pro133Leu | p.P133L | P33947 | protein_coding | deleterious(0) | probably_damaging(1) | TCGA-HJ-7597-01 | Stomach | stomach adenocarcinoma | Female | >=65 | I/II | Chemotherapy | fluorouracil | CR |


