
|
|||||
|
 | |
| |
| |
| |
| |
| |
|
Gene: KDELR1 |
Gene summary for KDELR1 |
| Gene information | Species | Human | Gene symbol | KDELR1 | Gene ID | 10945 |
| Gene name | KDEL endoplasmic reticulum protein retention receptor 1 | |
| Gene Alias | ERD2 | |
| Cytomap | 19q13.33 | |
| Gene Type | protein-coding | GO ID | GO:0001775 | UniProtAcc | P24390 |
Top |
Malignant transformation analysis |
| Identification of the aberrant gene expression in precancerous and cancerous lesions by comparing the gene expression of stem-like cells in diseased tissues with normal stem cells |
| Entrez ID | Symbol | Replicates | Species | Organ | Tissue | Adj P-value | Log2FC | Malignancy |
| 10945 | KDELR1 | GSM4909285 | Human | Breast | IDC | 6.76e-21 | 5.94e-01 | 0.21 |
| 10945 | KDELR1 | GSM4909286 | Human | Breast | IDC | 2.16e-03 | -1.99e-01 | 0.1081 |
| 10945 | KDELR1 | GSM4909288 | Human | Breast | IDC | 4.76e-02 | -6.51e-02 | 0.0988 |
| 10945 | KDELR1 | GSM4909294 | Human | Breast | IDC | 7.01e-03 | -5.50e-02 | 0.2022 |
| 10945 | KDELR1 | GSM4909296 | Human | Breast | IDC | 1.24e-11 | -1.32e-01 | 0.1524 |
| 10945 | KDELR1 | GSM4909297 | Human | Breast | IDC | 5.94e-14 | -1.70e-01 | 0.1517 |
| 10945 | KDELR1 | GSM4909304 | Human | Breast | IDC | 1.83e-31 | 6.98e-01 | 0.1636 |
| 10945 | KDELR1 | GSM4909311 | Human | Breast | IDC | 2.71e-31 | -2.52e-01 | 0.1534 |
| 10945 | KDELR1 | GSM4909312 | Human | Breast | IDC | 1.39e-15 | 9.79e-02 | 0.1552 |
| 10945 | KDELR1 | GSM4909313 | Human | Breast | IDC | 4.87e-05 | 4.77e-02 | 0.0391 |
| 10945 | KDELR1 | GSM4909316 | Human | Breast | IDC | 3.88e-02 | -1.55e-02 | 0.21 |
| 10945 | KDELR1 | GSM4909319 | Human | Breast | IDC | 1.77e-39 | -2.05e-01 | 0.1563 |
| 10945 | KDELR1 | GSM4909320 | Human | Breast | IDC | 1.56e-06 | -1.07e-01 | 0.1575 |
| 10945 | KDELR1 | GSM4909321 | Human | Breast | IDC | 1.70e-12 | -6.98e-02 | 0.1559 |
| 10945 | KDELR1 | M2 | Human | Breast | IDC | 4.38e-03 | -1.35e-01 | 0.21 |
| 10945 | KDELR1 | NCCBC14 | Human | Breast | DCIS | 1.76e-17 | -1.29e-01 | 0.2021 |
| 10945 | KDELR1 | NCCBC2 | Human | Breast | DCIS | 6.61e-06 | 1.14e-01 | 0.1554 |
| 10945 | KDELR1 | NCCBC3 | Human | Breast | DCIS | 2.34e-03 | 2.91e-02 | 0.1198 |
| 10945 | KDELR1 | NCCBC5 | Human | Breast | DCIS | 5.77e-16 | -2.02e-01 | 0.2046 |
| 10945 | KDELR1 | P1 | Human | Breast | IDC | 1.44e-21 | -3.79e-01 | 0.1527 |
| Page: 1 2 3 4 5 6 7 8 9 10 11 12 |
| Tissue | Expression Dynamics | Abbreviation |
| Breast |  | IDC: Invasive ductal carcinoma |
| DCIS: Ductal carcinoma in situ | ||
| Precancer(BRCA1-mut): Precancerous lesion from BRCA1 mutation carriers | ||
| Cervix | 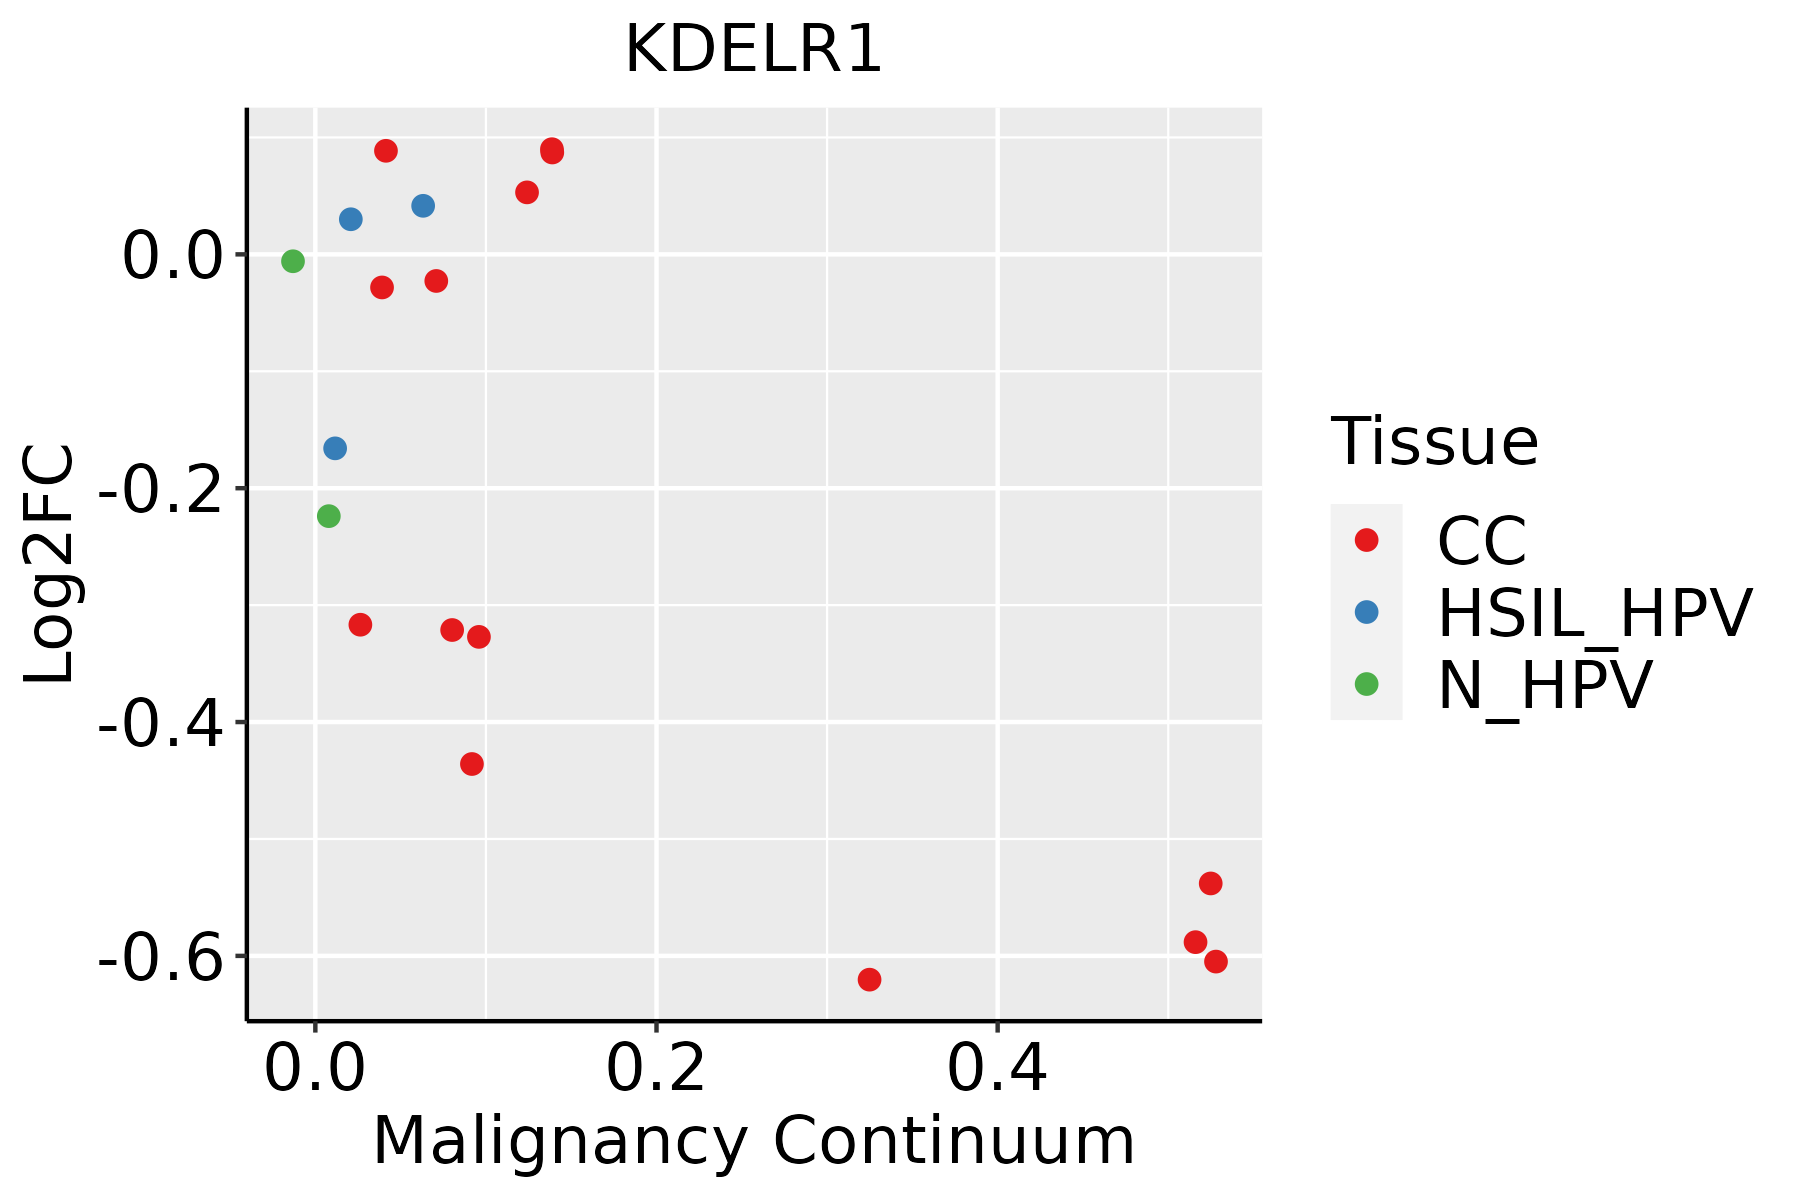 | CC: Cervix cancer |
| HSIL_HPV: HPV-infected high-grade squamous intraepithelial lesions | ||
| N_HPV: HPV-infected normal cervix | ||
| Colorectum (GSE201348) |  | FAP: Familial adenomatous polyposis |
| CRC: Colorectal cancer | ||
| Colorectum (HTA11) |  | AD: Adenomas |
| SER: Sessile serrated lesions | ||
| MSI-H: Microsatellite-high colorectal cancer | ||
| MSS: Microsatellite stable colorectal cancer | ||
| Endometrium | 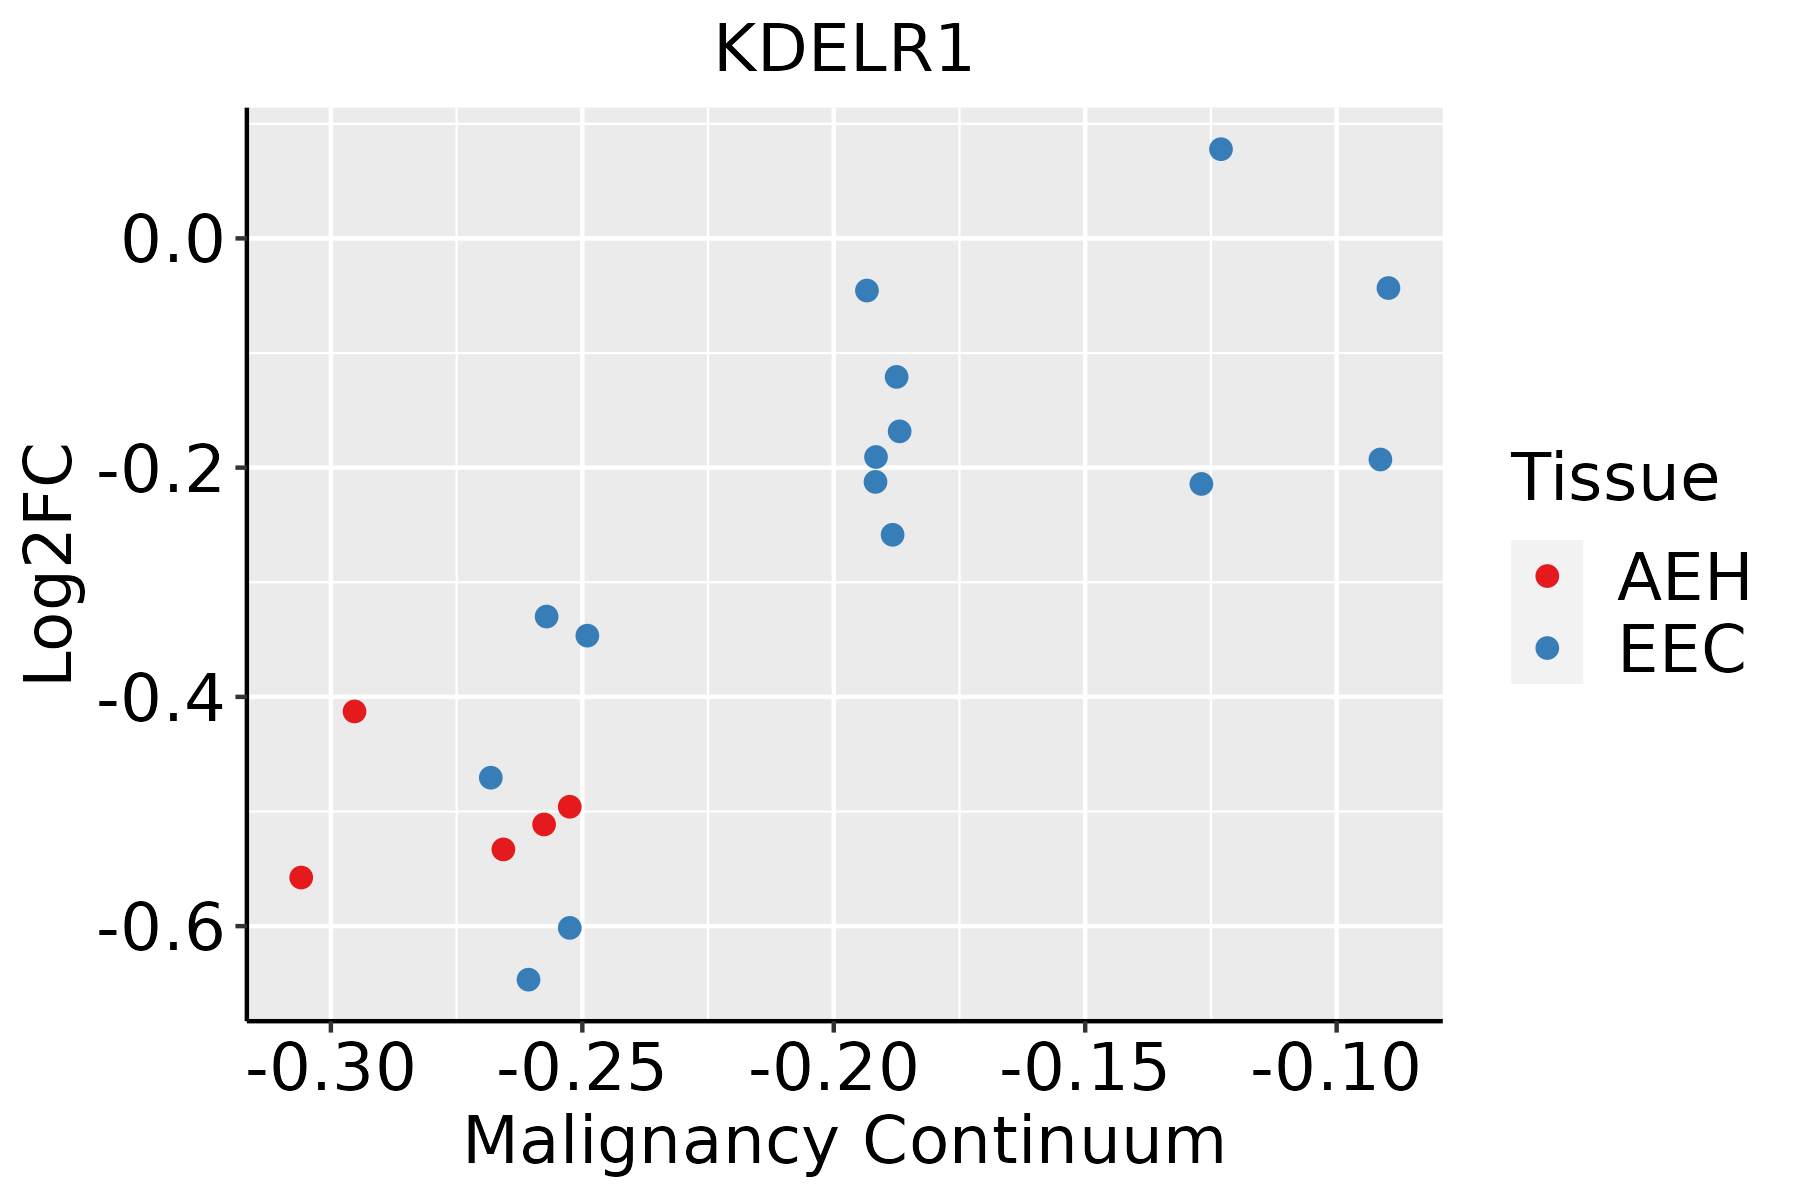 | AEH: Atypical endometrial hyperplasia |
| EEC: Endometrioid Cancer | ||
| Esophagus | 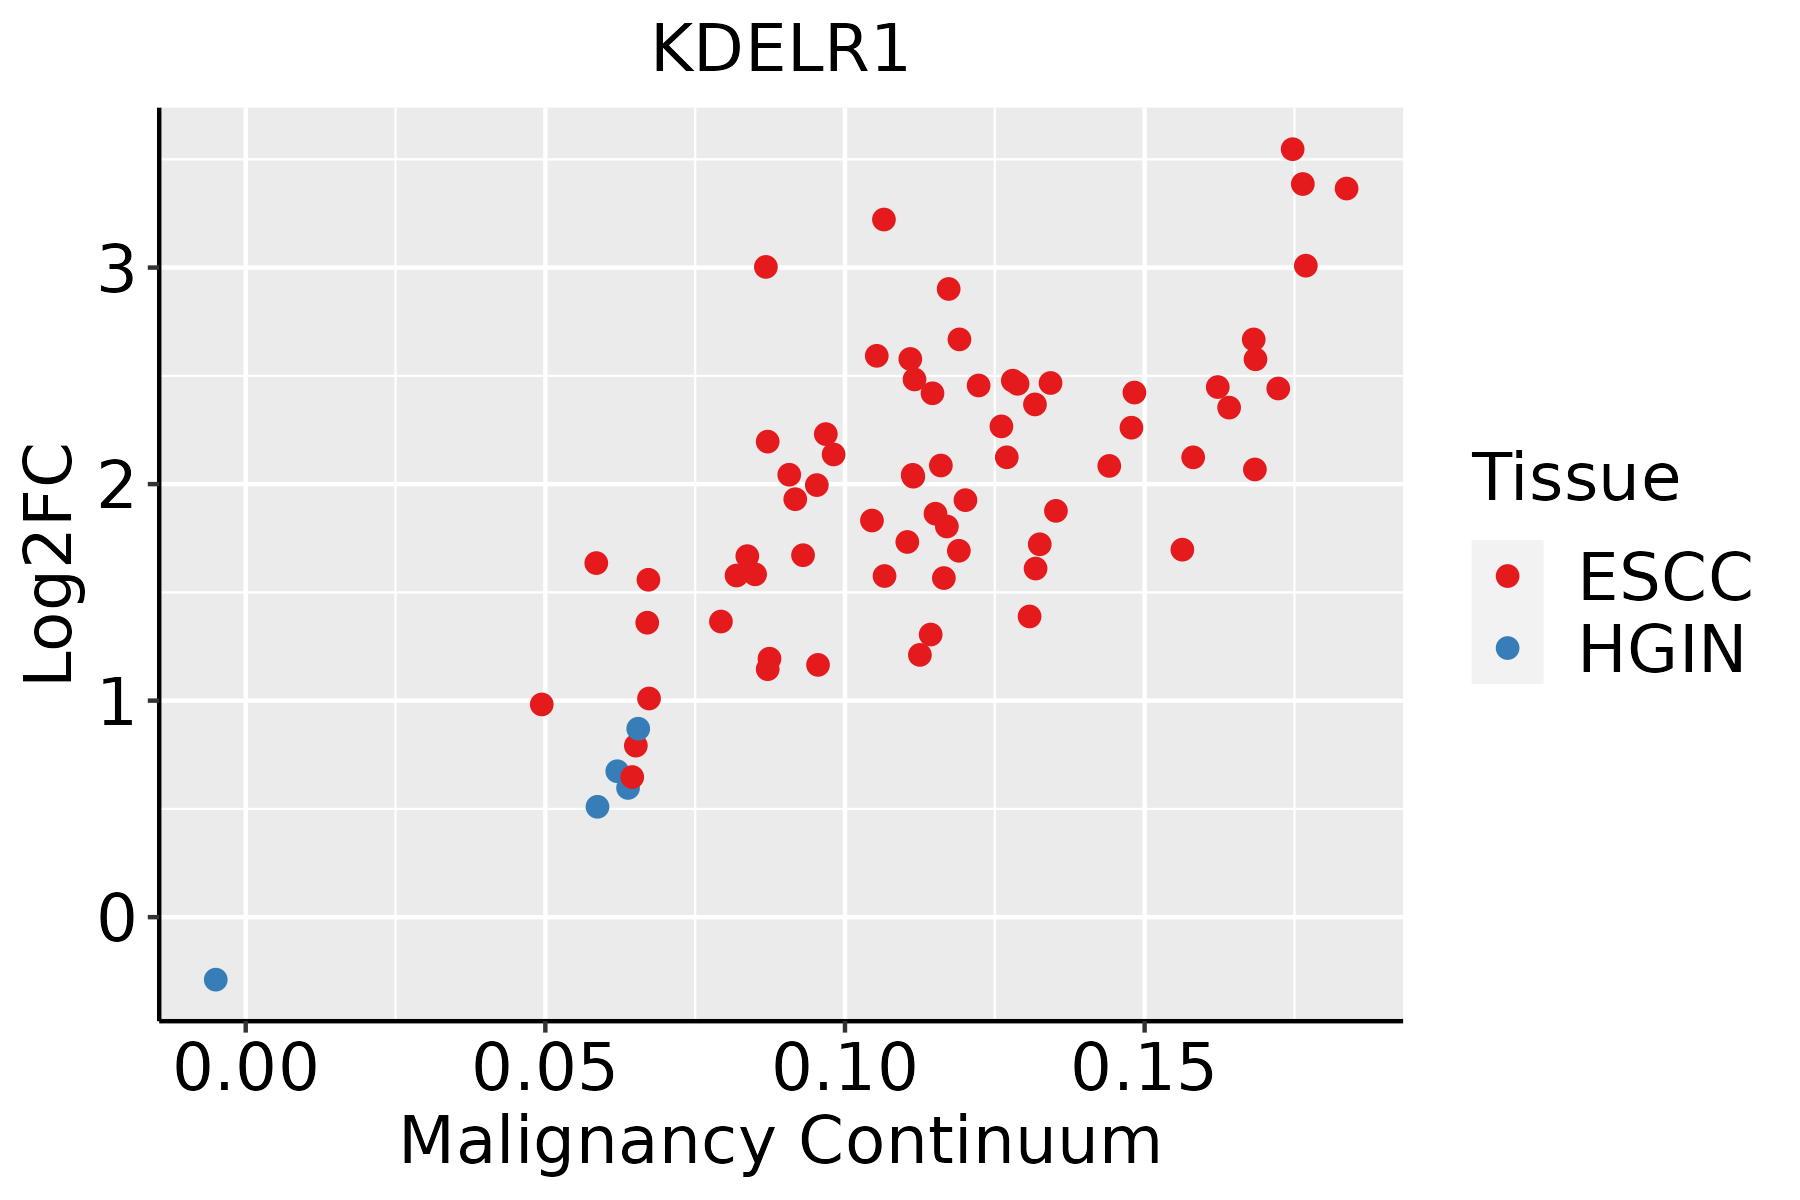 | ESCC: Esophageal squamous cell carcinoma |
| HGIN: High-grade intraepithelial neoplasias | ||
| LGIN: Low-grade intraepithelial neoplasias | ||
| Liver |  | HCC: Hepatocellular carcinoma |
| NAFLD: Non-alcoholic fatty liver disease | ||
| Oral Cavity | 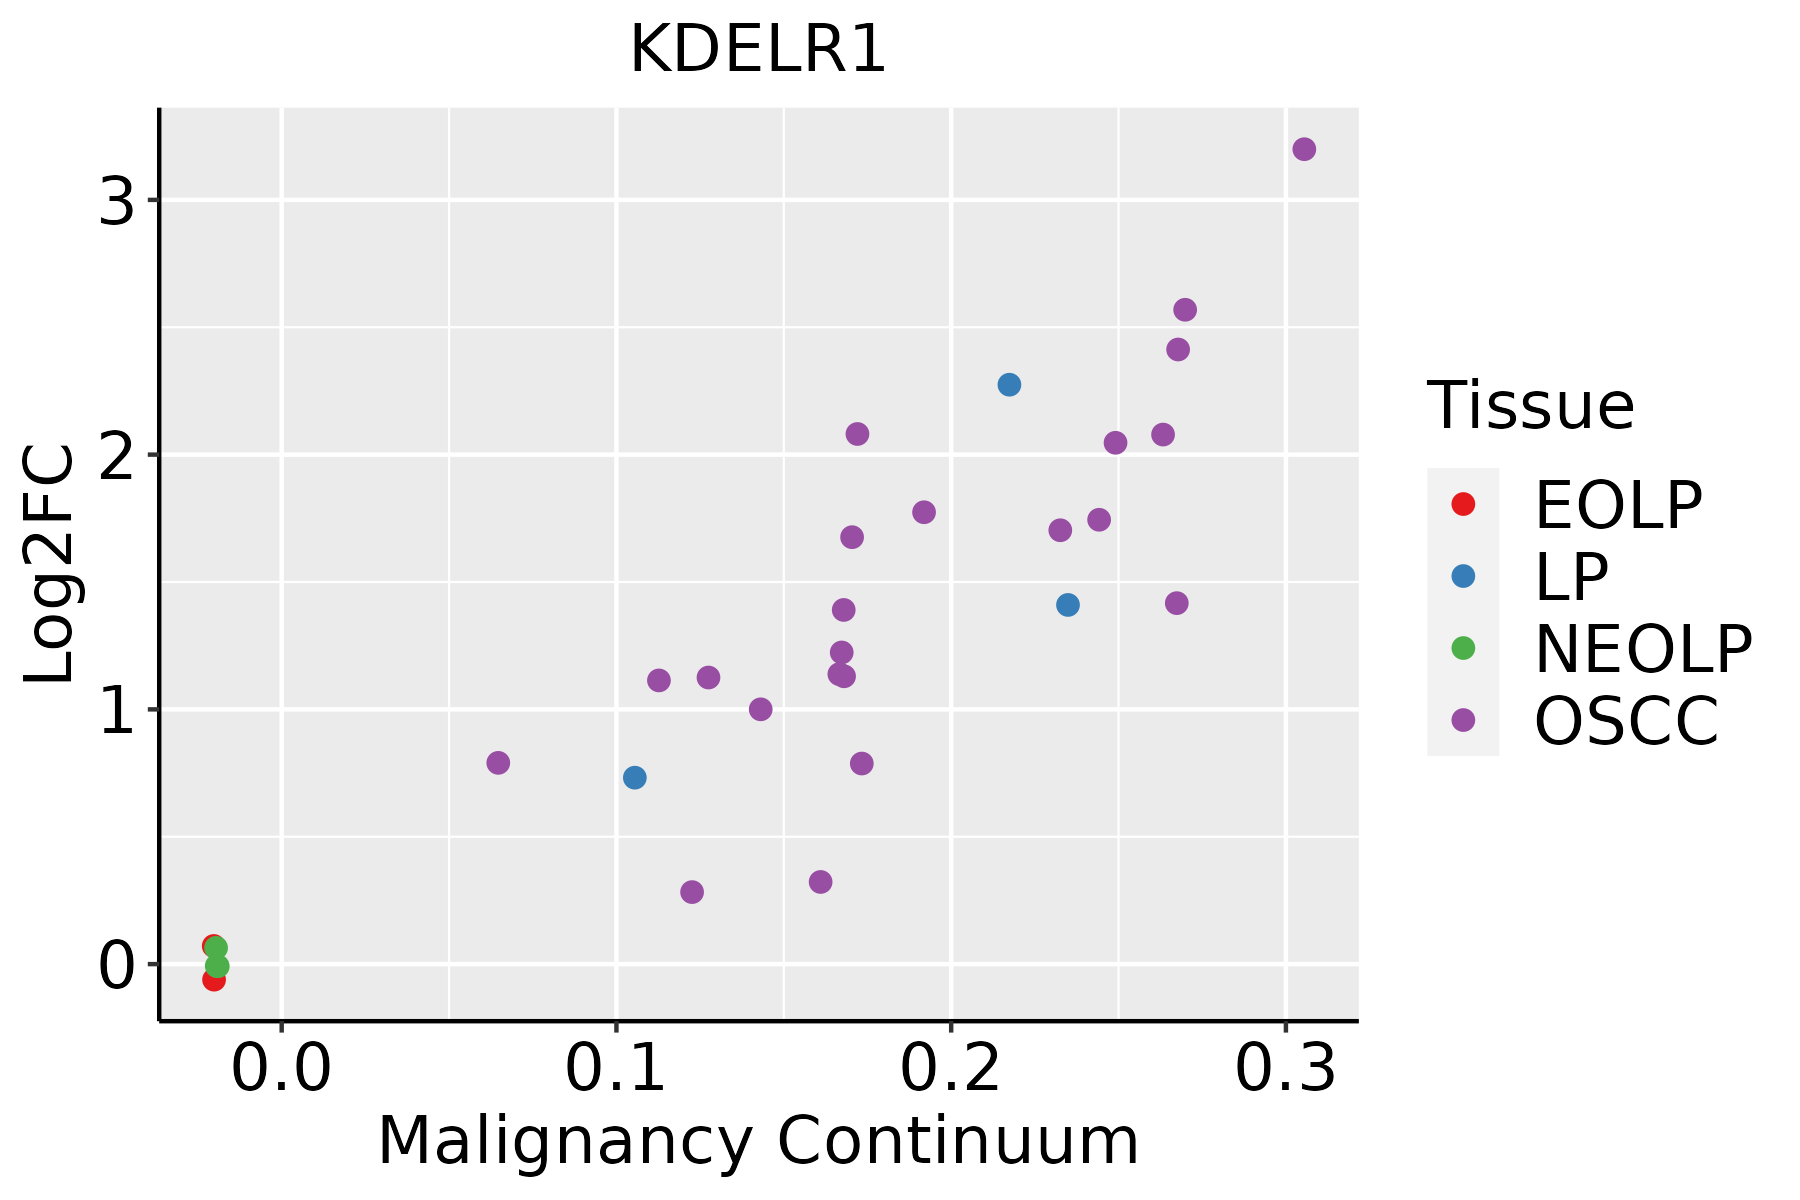 | EOLP: Erosive Oral lichen planus |
| LP: leukoplakia | ||
| NEOLP: Non-erosive oral lichen planus | ||
| OSCC: Oral squamous cell carcinoma | ||
| Prostate |  | BPH: Benign Prostatic Hyperplasia |
| Skin | 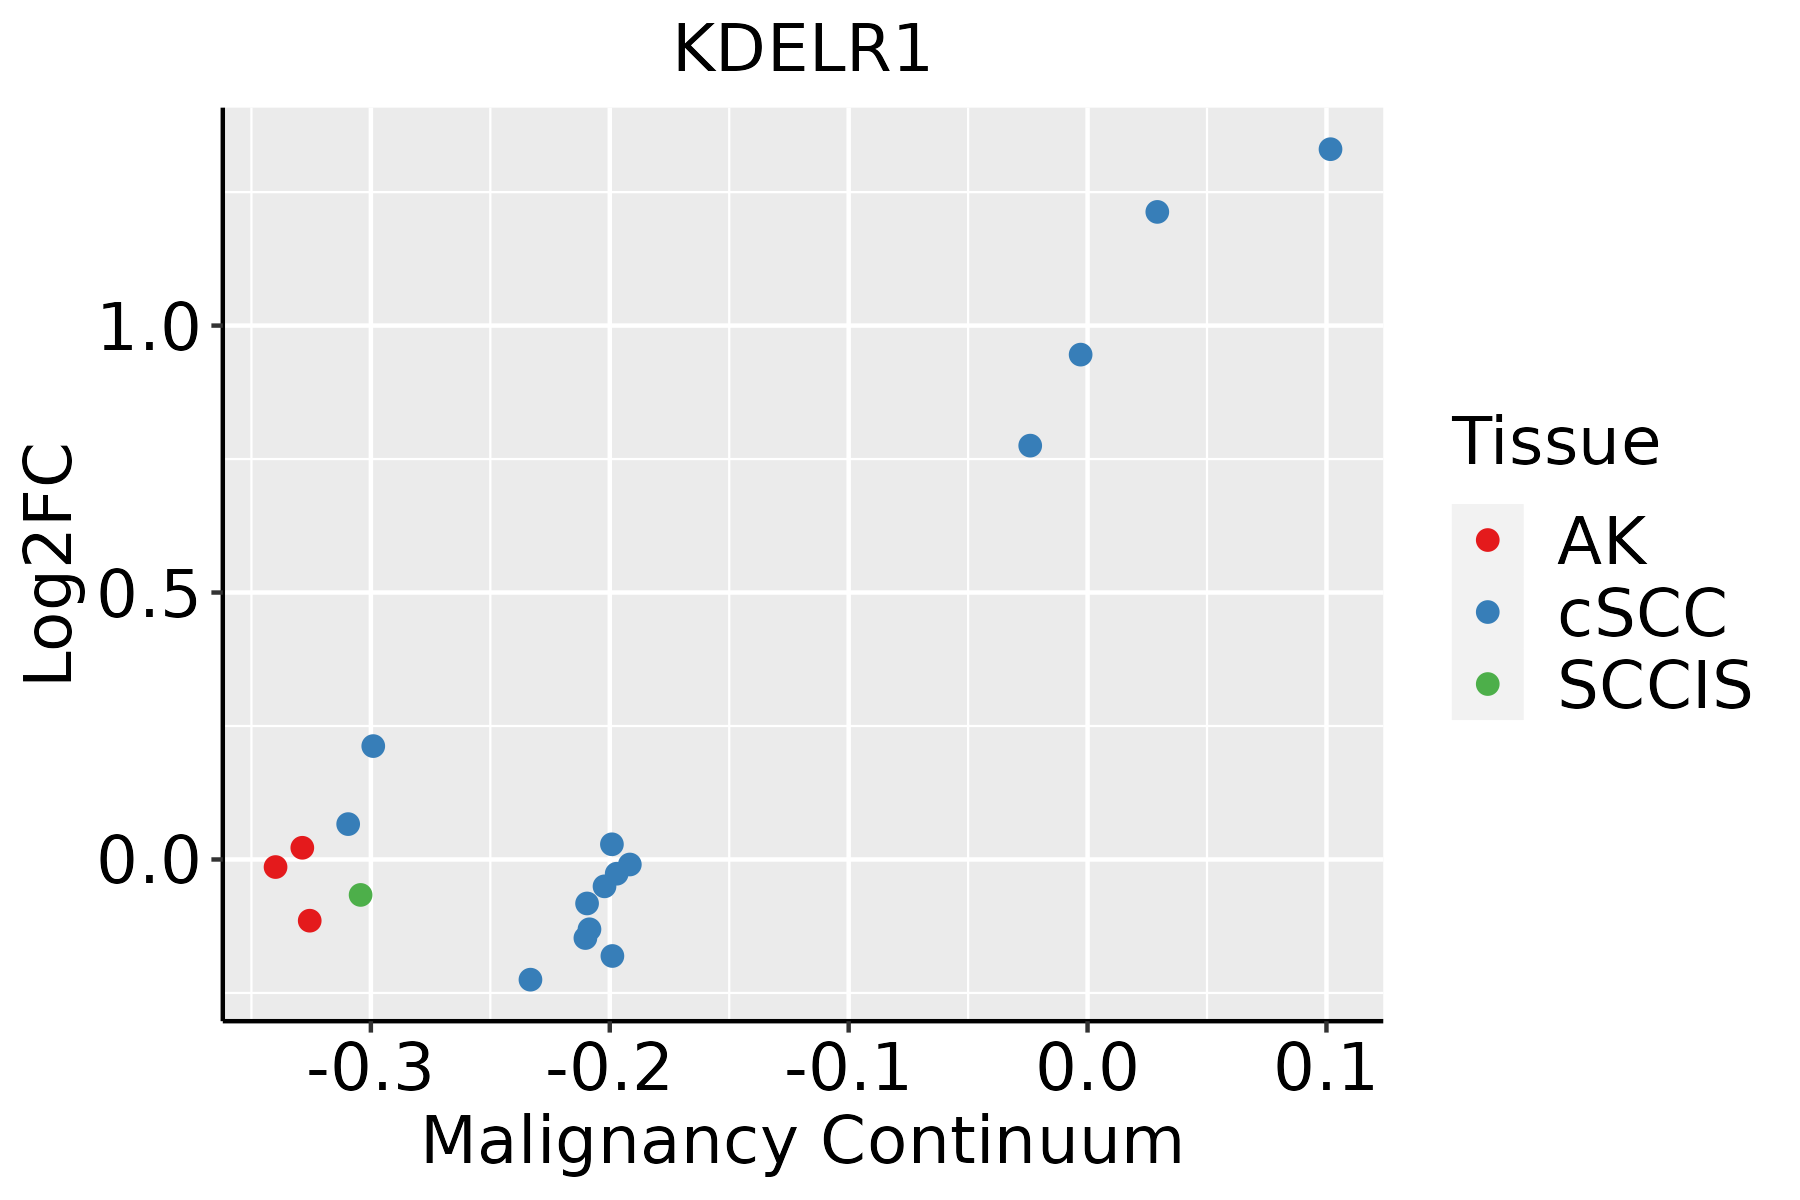 | AK: Actinic keratosis |
| cSCC: Cutaneous squamous cell carcinoma | ||
| SCCIS:squamous cell carcinoma in situ | ||
| Thyroid |  | ATC: Anaplastic thyroid cancer |
| HT: Hashimoto's thyroiditis | ||
| PTC: Papillary thyroid cancer |
| ∗log2FC in expression of this searched gene in stem-like cells from each diseased tissue sample relative to stem-like cells in normal samples in each tissue plotted against the malignancy continuum. Samples are colored based on if they are from different disease stage. |
Top |
Malignant transformation related pathway analysis |
| Find out the enriched GO biological processes and KEGG pathways involved in transition from healthy to precancer to cancer |
| Tissue | Disease Stage | Enriched GO biological Processes |
| Colorectum | AD |  |
| Colorectum | SER |  |
| Colorectum | MSS |  |
| Colorectum | MSI-H |  |
| Colorectum | FAP |  |
| ∗Top 15 enriched GO BP terms are showed in the bar plot of each disease state in each tissue. Each row represents a significant GO biological process which is colored according to the -log10(p.adjust). |
| Page: 1 2 3 4 5 6 7 8 9 |
| GO ID | Tissue | Disease Stage | Description | Gene Ratio | Bg Ratio | pvalue | p.adjust | Count |
| GO:005165114 | Breast | IDC | maintenance of location in cell | 37/1434 | 214/18723 | 2.39e-06 | 9.35e-05 | 37 |
| GO:004518514 | Breast | IDC | maintenance of protein location | 21/1434 | 94/18723 | 6.69e-06 | 2.05e-04 | 21 |
| GO:007097213 | Breast | IDC | protein localization to endoplasmic reticulum | 18/1434 | 74/18723 | 8.58e-06 | 2.47e-04 | 18 |
| GO:005123513 | Breast | IDC | maintenance of location | 48/1434 | 327/18723 | 9.90e-06 | 2.77e-04 | 48 |
| GO:004211012 | Breast | IDC | T cell activation | 64/1434 | 487/18723 | 1.49e-05 | 3.77e-04 | 64 |
| GO:003250714 | Breast | IDC | maintenance of protein location in cell | 16/1434 | 65/18723 | 2.29e-05 | 5.51e-04 | 16 |
| GO:007259512 | Breast | IDC | maintenance of protein localization in organelle | 12/1434 | 42/18723 | 4.94e-05 | 1.08e-03 | 12 |
| GO:00354371 | Breast | IDC | maintenance of protein localization in endoplasmic reticulum | 6/1434 | 14/18723 | 3.50e-04 | 5.13e-03 | 6 |
| GO:190313111 | Breast | IDC | mononuclear cell differentiation | 51/1434 | 426/18723 | 9.81e-04 | 1.11e-02 | 51 |
| GO:00068906 | Breast | IDC | retrograde vesicle-mediated transport, Golgi to endoplasmic reticulum | 10/1434 | 52/18723 | 5.49e-03 | 4.03e-02 | 10 |
| GO:004211021 | Breast | DCIS | T cell activation | 65/1390 | 487/18723 | 2.78e-06 | 9.42e-05 | 65 |
| GO:005165123 | Breast | DCIS | maintenance of location in cell | 36/1390 | 214/18723 | 3.07e-06 | 1.02e-04 | 36 |
| GO:004518521 | Breast | DCIS | maintenance of protein location | 21/1390 | 94/18723 | 4.12e-06 | 1.24e-04 | 21 |
| GO:007097222 | Breast | DCIS | protein localization to endoplasmic reticulum | 18/1390 | 74/18723 | 5.57e-06 | 1.60e-04 | 18 |
| GO:005123523 | Breast | DCIS | maintenance of location | 47/1390 | 327/18723 | 9.55e-06 | 2.56e-04 | 47 |
| GO:003250722 | Breast | DCIS | maintenance of protein location in cell | 16/1390 | 65/18723 | 1.56e-05 | 3.79e-04 | 16 |
| GO:007259521 | Breast | DCIS | maintenance of protein localization in organelle | 12/1390 | 42/18723 | 3.64e-05 | 7.86e-04 | 12 |
| GO:00354372 | Breast | DCIS | maintenance of protein localization in endoplasmic reticulum | 6/1390 | 14/18723 | 2.96e-04 | 4.32e-03 | 6 |
| GO:19031312 | Breast | DCIS | mononuclear cell differentiation | 51/1390 | 426/18723 | 4.88e-04 | 6.40e-03 | 51 |
| GO:000689012 | Breast | DCIS | retrograde vesicle-mediated transport, Golgi to endoplasmic reticulum | 10/1390 | 52/18723 | 4.41e-03 | 3.41e-02 | 10 |
| Page: 1 2 3 4 5 6 7 8 9 10 11 12 |
| Pathway ID | Tissue | Disease Stage | Description | Gene Ratio | Bg Ratio | pvalue | p.adjust | qvalue | Count |
| hsa0511022 | Breast | IDC | Vibrio cholerae infection | 17/867 | 50/8465 | 4.82e-06 | 6.82e-05 | 5.10e-05 | 17 |
| hsa0511032 | Breast | IDC | Vibrio cholerae infection | 17/867 | 50/8465 | 4.82e-06 | 6.82e-05 | 5.10e-05 | 17 |
| hsa0511041 | Breast | DCIS | Vibrio cholerae infection | 17/846 | 50/8465 | 3.45e-06 | 4.45e-05 | 3.28e-05 | 17 |
| hsa0511051 | Breast | DCIS | Vibrio cholerae infection | 17/846 | 50/8465 | 3.45e-06 | 4.45e-05 | 3.28e-05 | 17 |
| hsa0511016 | Cervix | CC | Vibrio cholerae infection | 18/1267 | 50/8465 | 1.91e-04 | 1.11e-03 | 6.55e-04 | 18 |
| hsa0511017 | Cervix | CC | Vibrio cholerae infection | 18/1267 | 50/8465 | 1.91e-04 | 1.11e-03 | 6.55e-04 | 18 |
| hsa0511023 | Cervix | N_HPV | Vibrio cholerae infection | 8/349 | 50/8465 | 9.07e-04 | 6.49e-03 | 5.08e-03 | 8 |
| hsa0511033 | Cervix | N_HPV | Vibrio cholerae infection | 8/349 | 50/8465 | 9.07e-04 | 6.49e-03 | 5.08e-03 | 8 |
| hsa05110 | Colorectum | AD | Vibrio cholerae infection | 29/2092 | 50/8465 | 5.10e-07 | 7.12e-06 | 4.54e-06 | 29 |
| hsa051101 | Colorectum | AD | Vibrio cholerae infection | 29/2092 | 50/8465 | 5.10e-07 | 7.12e-06 | 4.54e-06 | 29 |
| hsa051102 | Colorectum | SER | Vibrio cholerae infection | 24/1580 | 50/8465 | 2.17e-06 | 3.13e-05 | 2.28e-05 | 24 |
| hsa051103 | Colorectum | SER | Vibrio cholerae infection | 24/1580 | 50/8465 | 2.17e-06 | 3.13e-05 | 2.28e-05 | 24 |
| hsa051104 | Colorectum | MSS | Vibrio cholerae infection | 27/1875 | 50/8465 | 8.58e-07 | 1.20e-05 | 7.34e-06 | 27 |
| hsa051105 | Colorectum | MSS | Vibrio cholerae infection | 27/1875 | 50/8465 | 8.58e-07 | 1.20e-05 | 7.34e-06 | 27 |
| hsa051106 | Colorectum | MSI-H | Vibrio cholerae infection | 18/797 | 50/8465 | 2.77e-07 | 5.61e-06 | 4.70e-06 | 18 |
| hsa051107 | Colorectum | MSI-H | Vibrio cholerae infection | 18/797 | 50/8465 | 2.77e-07 | 5.61e-06 | 4.70e-06 | 18 |
| hsa0511018 | Endometrium | AEH | Vibrio cholerae infection | 18/1197 | 50/8465 | 9.09e-05 | 8.69e-04 | 6.36e-04 | 18 |
| hsa0511019 | Endometrium | AEH | Vibrio cholerae infection | 18/1197 | 50/8465 | 9.09e-05 | 8.69e-04 | 6.36e-04 | 18 |
| hsa0511024 | Endometrium | EEC | Vibrio cholerae infection | 18/1237 | 50/8465 | 1.40e-04 | 1.32e-03 | 9.82e-04 | 18 |
| hsa0511034 | Endometrium | EEC | Vibrio cholerae infection | 18/1237 | 50/8465 | 1.40e-04 | 1.32e-03 | 9.82e-04 | 18 |
| Page: 1 2 |
Top |
Cell-cell communication analysis |
| Identification of potential cell-cell interactions between two cell types and their ligand-receptor pairs for different disease states |
| Ligand | Receptor | LRpair | Pathway | Tissue | Disease Stage |
| Page: 1 |
Top |
Single-cell gene regulatory network inference analysis |
| Find out the significant the regulons (TFs) and the target genes of each regulon across cell types for different disease states |
| TF | Cell Type | Tissue | Disease Stage | Target Gene | RSS | Regulon Activity |
| ∗The dot plots of a searched regulon are shown for all cell subpopulations in each disease state of each tissue based on the regulon specific score inferred using pySCENIC and by calculating the average expression. |
| Page: 1 |
Top |
Somatic mutation of malignant transformation related genes |
| Annotation of somatic variants for genes involved in malignant transformation |
| Hugo Symbol | Variant Class | Variant Classification | dbSNP RS | HGVSc | HGVSp | HGVSp Short | SWISSPROT | BIOTYPE | SIFT | PolyPhen | Tumor Sample Barcode | Tissue | Histology | Sex | Age | Stage | Therapy Types | Drugs | Outcome |
| KDELR1 | SNV | Missense_Mutation | novel | c.170N>T | p.Ser57Leu | p.S57L | P24390 | protein_coding | deleterious(0) | probably_damaging(0.928) | TCGA-A7-A26H-01 | Breast | breast invasive carcinoma | Female | >=65 | I/II | Hormone Therapy | anastrozole | PD |
| KDELR1 | SNV | Missense_Mutation | c.212N>G | p.Ser71Cys | p.S71C | P24390 | protein_coding | deleterious(0) | probably_damaging(0.972) | TCGA-C5-A1MH-01 | Cervix | cervical & endocervical cancer | Female | >=65 | III/IV | Chemotherapy | cisplatin | PD | |
| KDELR1 | SNV | Missense_Mutation | c.14G>A | p.Arg5Gln | p.R5Q | P24390 | protein_coding | deleterious(0.01) | possibly_damaging(0.621) | TCGA-JW-A5VJ-01 | Cervix | cervical & endocervical cancer | Female | <65 | I/II | Unknown | Unknown | PD | |
| KDELR1 | SNV | Missense_Mutation | rs769954207 | c.427N>A | p.Glu143Lys | p.E143K | P24390 | protein_coding | tolerated(0.1) | possibly_damaging(0.477) | TCGA-LP-A4AV-01 | Cervix | cervical & endocervical cancer | Female | <65 | I/II | Unknown | Unknown | SD |
| KDELR1 | SNV | Missense_Mutation | c.28N>A | p.Leu10Ile | p.L10I | P24390 | protein_coding | tolerated(0.11) | benign(0.007) | TCGA-A6-5665-01 | Colorectum | colon adenocarcinoma | Female | >=65 | I/II | Unknown | Unknown | PD | |
| KDELR1 | SNV | Missense_Mutation | c.475C>T | p.Arg159Cys | p.R159C | P24390 | protein_coding | deleterious(0) | probably_damaging(1) | TCGA-AA-A010-01 | Colorectum | colon adenocarcinoma | Female | <65 | I/II | Chemotherapy | folinic | CR | |
| KDELR1 | SNV | Missense_Mutation | c.308C>T | p.Ala103Val | p.A103V | P24390 | protein_coding | tolerated(0.39) | benign(0.013) | TCGA-AD-5900-01 | Colorectum | colon adenocarcinoma | Male | >=65 | I/II | Unknown | Unknown | SD | |
| KDELR1 | SNV | Missense_Mutation | rs780757543 | c.298N>A | p.Val100Ile | p.V100I | P24390 | protein_coding | tolerated(0.71) | benign(0.08) | TCGA-CM-4743-01 | Colorectum | colon adenocarcinoma | Male | >=65 | I/II | Chemotherapy | capecitabine | SD |
| KDELR1 | SNV | Missense_Mutation | c.475N>T | p.Arg159Cys | p.R159C | P24390 | protein_coding | deleterious(0) | probably_damaging(1) | TCGA-WS-AB45-01 | Colorectum | colon adenocarcinoma | Female | <65 | I/II | Unknown | Unknown | SD | |
| KDELR1 | insertion | Frame_Shift_Ins | novel | c.436_437insG | p.Thr146SerfsTer151 | p.T146Sfs*151 | P24390 | protein_coding | TCGA-AA-3821-01 | Colorectum | colon adenocarcinoma | Female | >=65 | I/II | Unknown | Unknown | SD |
| Page: 1 2 3 |
Top |
Related drugs of malignant transformation related genes |
| Identification of chemicals and drugs interact with genes involved in malignant transfromation |
| (DGIdb 4.0) |
| Entrez ID | Symbol | Category | Interaction Types | Drug Claim Name | Drug Name | PMIDs |
| Page: 1 |

Copyright 2023-Present -The University of Texas Health Science Center at Houston |