
|
|||||
|
 | |
| |
| |
| |
| |
| |
|
Gene: KCTD15 |
Gene summary for KCTD15 |
| Gene information | Species | Human | Gene symbol | KCTD15 | Gene ID | 79047 |
| Gene name | potassium channel tetramerization domain containing 15 | |
| Gene Alias | KCTD15 | |
| Cytomap | 19q13.11 | |
| Gene Type | protein-coding | GO ID | GO:0008150 | UniProtAcc | Q96SI1 |
Top |
Malignant transformation analysis |
| Identification of the aberrant gene expression in precancerous and cancerous lesions by comparing the gene expression of stem-like cells in diseased tissues with normal stem cells |
| Entrez ID | Symbol | Replicates | Species | Organ | Tissue | Adj P-value | Log2FC | Malignancy |
| 79047 | KCTD15 | C04 | Human | Oral cavity | OSCC | 4.45e-10 | 5.04e-01 | 0.2633 |
| 79047 | KCTD15 | C30 | Human | Oral cavity | OSCC | 6.06e-21 | 6.87e-01 | 0.3055 |
| 79047 | KCTD15 | C46 | Human | Oral cavity | OSCC | 9.88e-11 | 2.31e-01 | 0.1673 |
| 79047 | KCTD15 | C51 | Human | Oral cavity | OSCC | 1.83e-02 | 2.40e-01 | 0.2674 |
| 79047 | KCTD15 | C08 | Human | Oral cavity | OSCC | 4.96e-05 | 2.09e-01 | 0.1919 |
| 79047 | KCTD15 | LP17 | Human | Oral cavity | LP | 1.19e-02 | 3.29e-01 | 0.2349 |
| 79047 | KCTD15 | SYSMH1 | Human | Oral cavity | OSCC | 7.06e-03 | 1.05e-01 | 0.1127 |
| 79047 | KCTD15 | SYSMH2 | Human | Oral cavity | OSCC | 7.05e-09 | 2.66e-01 | 0.2326 |
| 79047 | KCTD15 | SYSMH3 | Human | Oral cavity | OSCC | 4.38e-12 | 3.52e-01 | 0.2442 |
| 79047 | KCTD15 | male-WTA | Human | Thyroid | PTC | 6.75e-05 | 5.88e-02 | 0.1037 |
| 79047 | KCTD15 | PTC07 | Human | Thyroid | PTC | 4.81e-03 | 2.65e-02 | 0.2044 |
| 79047 | KCTD15 | ATC13 | Human | Thyroid | ATC | 2.37e-37 | 7.40e-01 | 0.34 |
| 79047 | KCTD15 | ATC2 | Human | Thyroid | ATC | 5.12e-06 | 5.84e-01 | 0.34 |
| 79047 | KCTD15 | ATC3 | Human | Thyroid | ATC | 2.82e-03 | 3.02e-01 | 0.338 |
| 79047 | KCTD15 | ATC5 | Human | Thyroid | ATC | 1.72e-39 | 8.16e-01 | 0.34 |
| Page: 1 |
| Tissue | Expression Dynamics | Abbreviation |
| Oral Cavity |  | EOLP: Erosive Oral lichen planus |
| LP: leukoplakia | ||
| NEOLP: Non-erosive oral lichen planus | ||
| OSCC: Oral squamous cell carcinoma | ||
| Thyroid | 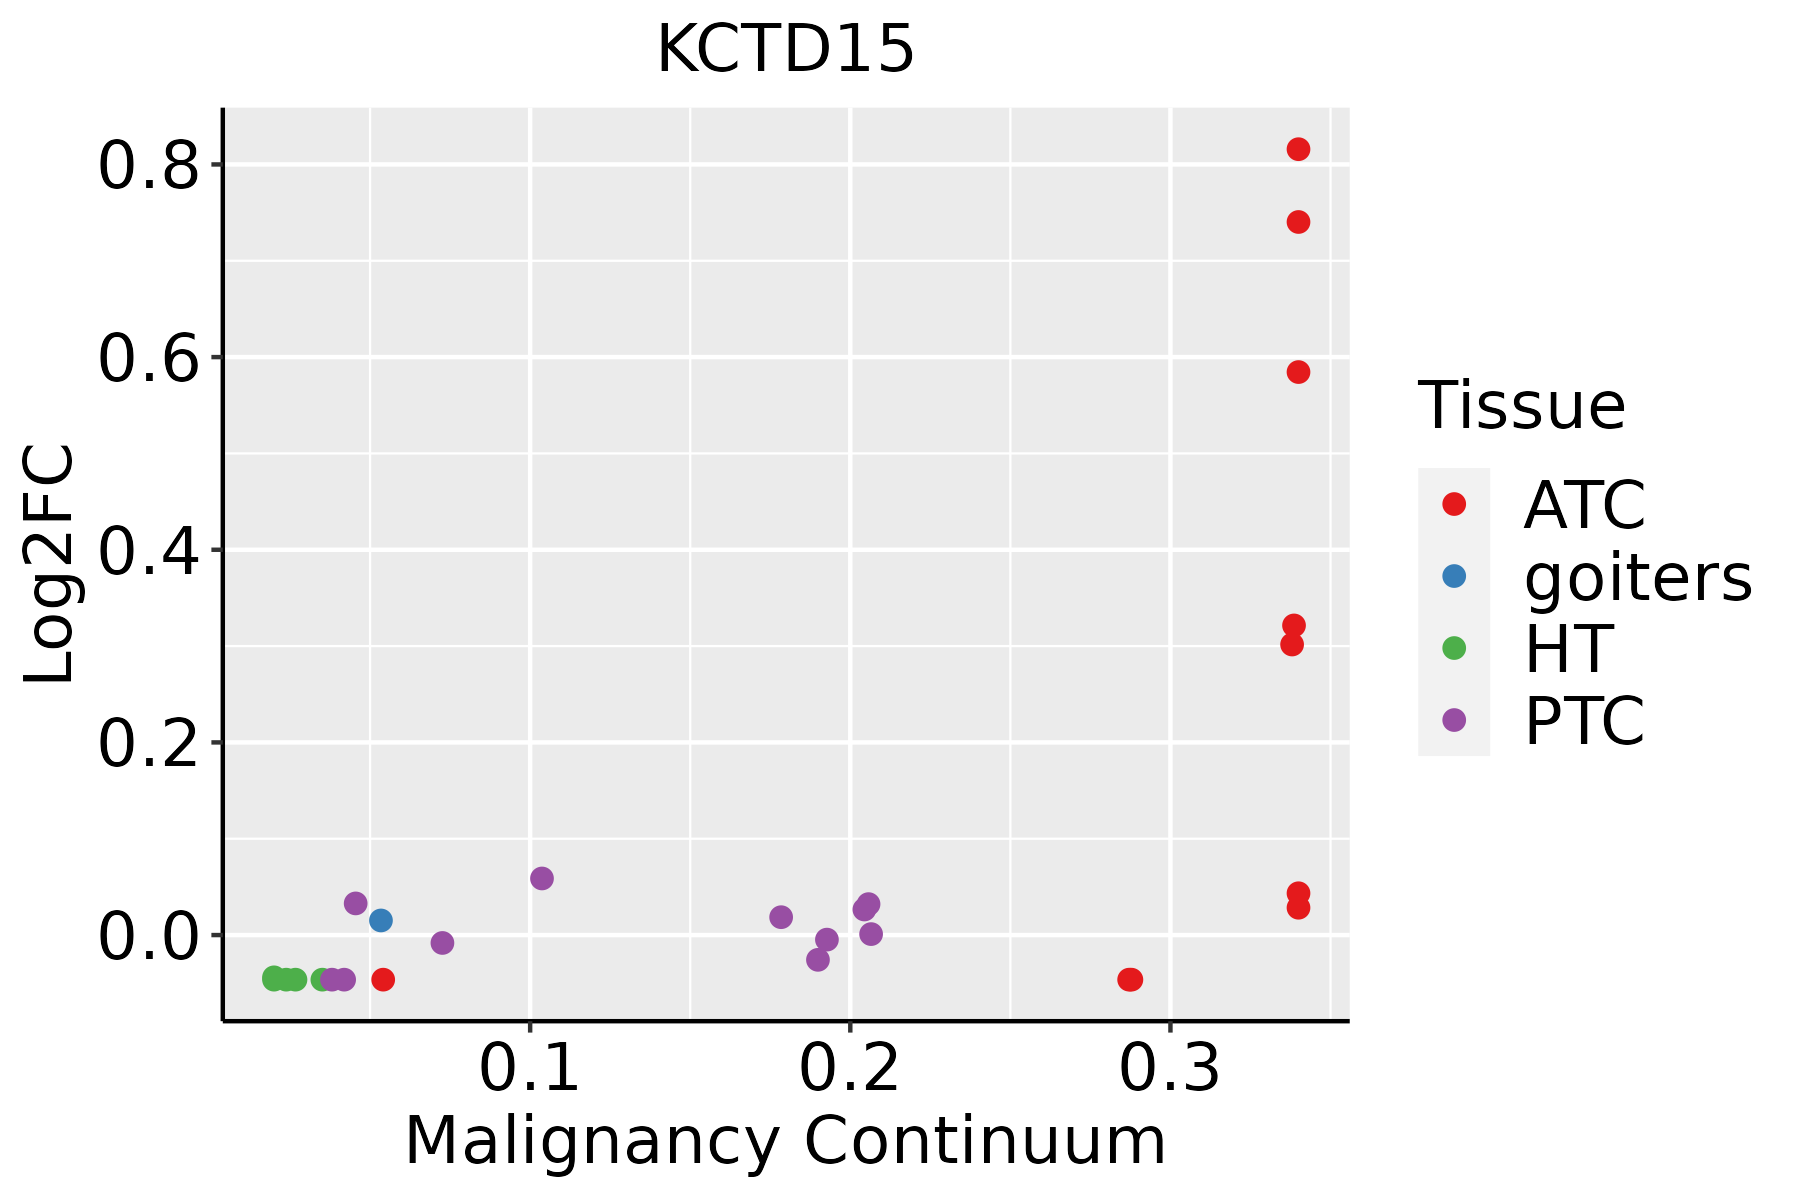 | ATC: Anaplastic thyroid cancer |
| HT: Hashimoto's thyroiditis | ||
| PTC: Papillary thyroid cancer |
| ∗log2FC in expression of this searched gene in stem-like cells from each diseased tissue sample relative to stem-like cells in normal samples in each tissue plotted against the malignancy continuum. Samples are colored based on if they are from different disease stage. |
Top |
Malignant transformation related pathway analysis |
| Find out the enriched GO biological processes and KEGG pathways involved in transition from healthy to precancer to cancer |
| Tissue | Disease Stage | Enriched GO biological Processes |
| Colorectum | AD |  |
| Colorectum | SER |  |
| Colorectum | MSS |  |
| Colorectum | MSI-H |  |
| Colorectum | FAP |  |
| ∗Top 15 enriched GO BP terms are showed in the bar plot of each disease state in each tissue. Each row represents a significant GO biological process which is colored according to the -log10(p.adjust). |
| Page: 1 2 3 4 5 6 7 8 9 |
| GO ID | Tissue | Disease Stage | Description | Gene Ratio | Bg Ratio | pvalue | p.adjust | Count |
| GO:0051259 | Oral cavity | OSCC | protein complex oligomerization | 121/7305 | 238/18723 | 1.29e-04 | 9.21e-04 | 121 |
| GO:00512591 | Oral cavity | LP | protein complex oligomerization | 85/4623 | 238/18723 | 8.81e-05 | 1.11e-03 | 85 |
| Page: 1 |
| Pathway ID | Tissue | Disease Stage | Description | Gene Ratio | Bg Ratio | pvalue | p.adjust | qvalue | Count |
| Page: 1 |
Top |
Cell-cell communication analysis |
| Identification of potential cell-cell interactions between two cell types and their ligand-receptor pairs for different disease states |
| Ligand | Receptor | LRpair | Pathway | Tissue | Disease Stage |
| Page: 1 |
Top |
Single-cell gene regulatory network inference analysis |
| Find out the significant the regulons (TFs) and the target genes of each regulon across cell types for different disease states |
| TF | Cell Type | Tissue | Disease Stage | Target Gene | RSS | Regulon Activity |
| ∗The dot plots of a searched regulon are shown for all cell subpopulations in each disease state of each tissue based on the regulon specific score inferred using pySCENIC and by calculating the average expression. |
| Page: 1 |
Top |
Somatic mutation of malignant transformation related genes |
| Annotation of somatic variants for genes involved in malignant transformation |
| Hugo Symbol | Variant Class | Variant Classification | dbSNP RS | HGVSc | HGVSp | HGVSp Short | SWISSPROT | BIOTYPE | SIFT | PolyPhen | Tumor Sample Barcode | Tissue | Histology | Sex | Age | Stage | Therapy Types | Drugs | Outcome |
| KCTD15 | SNV | Missense_Mutation | rs755060049 | c.709N>G | p.Phe237Val | p.F237V | Q96SI1 | protein_coding | tolerated(0.58) | benign(0.055) | TCGA-A2-A0CS-01 | Breast | breast invasive carcinoma | Female | >=65 | III/IV | Hormone Therapy | anastrozole | SD |
| KCTD15 | SNV | Missense_Mutation | rs755060049 | c.709N>G | p.Phe237Val | p.F237V | Q96SI1 | protein_coding | tolerated(0.58) | benign(0.055) | TCGA-BH-A18K-01 | Breast | breast invasive carcinoma | Female | <65 | I/II | Unknown | Unknown | PD |
| KCTD15 | insertion | Nonsense_Mutation | novel | c.124_125insATGTATTTTTGAAACAAAAATGCTCTTAATTTGATGTGAAATTTA | p.Ala42delinsAspValPheLeuLysGlnLysCysSerTerPheAspValLysPheThr | p.A42delinsDVFLKQKCS*FDVKFT | Q96SI1 | protein_coding | TCGA-A8-A06X-01 | Breast | breast invasive carcinoma | Female | >=65 | I/II | Unknown | Unknown | SD | ||
| KCTD15 | SNV | Missense_Mutation | c.472G>A | p.Glu158Lys | p.E158K | Q96SI1 | protein_coding | tolerated(0.12) | benign(0.01) | TCGA-C5-A7X3-01 | Cervix | cervical & endocervical cancer | Female | >=65 | III/IV | Chemotherapy | cisplatin | SD | |
| KCTD15 | SNV | Missense_Mutation | rs774560706 | c.35C>T | p.Ser12Leu | p.S12L | Q96SI1 | protein_coding | tolerated_low_confidence(0.33) | benign(0.003) | TCGA-EA-A410-01 | Cervix | cervical & endocervical cancer | Female | <65 | I/II | Unknown | Unknown | SD |
| KCTD15 | SNV | Missense_Mutation | novel | c.70N>A | p.Gly24Arg | p.G24R | Q96SI1 | protein_coding | deleterious_low_confidence(0.02) | benign(0.001) | TCGA-LP-A4AU-01 | Cervix | cervical & endocervical cancer | Female | <65 | III/IV | Chemotherapy | cisplatin | CR |
| KCTD15 | SNV | Missense_Mutation | c.247N>C | p.Ser83Arg | p.S83R | Q96SI1 | protein_coding | deleterious(0.03) | benign(0.044) | TCGA-A6-3809-01 | Colorectum | colon adenocarcinoma | Female | >=65 | I/II | Unknown | Unknown | SD | |
| KCTD15 | SNV | Missense_Mutation | rs770573450 | c.787N>T | p.Arg263Trp | p.R263W | Q96SI1 | protein_coding | deleterious(0) | probably_damaging(1) | TCGA-A6-6653-01 | Colorectum | colon adenocarcinoma | Male | >=65 | I/II | Unknown | Unknown | SD |
| KCTD15 | SNV | Missense_Mutation | rs199530630 | c.337N>A | p.Val113Ile | p.V113I | Q96SI1 | protein_coding | tolerated(1) | benign(0.003) | TCGA-CM-4743-01 | Colorectum | colon adenocarcinoma | Male | >=65 | I/II | Chemotherapy | capecitabine | SD |
| KCTD15 | SNV | Missense_Mutation | c.544N>A | p.Ala182Thr | p.A182T | Q96SI1 | protein_coding | tolerated(1) | benign(0.007) | TCGA-DM-A1HB-01 | Colorectum | colon adenocarcinoma | Male | >=65 | III/IV | Unknown | Unknown | SD |
| Page: 1 2 3 4 |
Top |
Related drugs of malignant transformation related genes |
| Identification of chemicals and drugs interact with genes involved in malignant transfromation |
| (DGIdb 4.0) |
| Entrez ID | Symbol | Category | Interaction Types | Drug Claim Name | Drug Name | PMIDs |
| Page: 1 |

Copyright 2023-Present -The University of Texas Health Science Center at Houston |