
|
|||||
|
 | |
| |
| |
| |
| |
| |
|
Gene: KCTD14 |
Gene summary for KCTD14 |
| Gene information | Species | Human | Gene symbol | KCTD14 | Gene ID | 65987 |
| Gene name | potassium channel tetramerization domain containing 14 | |
| Gene Alias | KCTD14 | |
| Cytomap | 11q14.1 | |
| Gene Type | protein-coding | GO ID | GO:0008150 | UniProtAcc | Q9BQ13 |
Top |
Malignant transformation analysis |
| Identification of the aberrant gene expression in precancerous and cancerous lesions by comparing the gene expression of stem-like cells in diseased tissues with normal stem cells |
| Entrez ID | Symbol | Replicates | Species | Organ | Tissue | Adj P-value | Log2FC | Malignancy |
| 65987 | KCTD14 | P2T-E | Human | Esophagus | ESCC | 2.88e-07 | 1.06e-01 | 0.1177 |
| 65987 | KCTD14 | P4T-E | Human | Esophagus | ESCC | 3.00e-02 | 6.54e-02 | 0.1323 |
| 65987 | KCTD14 | P10T-E | Human | Esophagus | ESCC | 2.51e-05 | 8.32e-02 | 0.116 |
| 65987 | KCTD14 | P16T-E | Human | Esophagus | ESCC | 4.81e-13 | 4.07e-01 | 0.1153 |
| 65987 | KCTD14 | P17T-E | Human | Esophagus | ESCC | 1.36e-03 | 1.36e-01 | 0.1278 |
| 65987 | KCTD14 | P20T-E | Human | Esophagus | ESCC | 3.06e-03 | 5.30e-02 | 0.1124 |
| 65987 | KCTD14 | P24T-E | Human | Esophagus | ESCC | 4.97e-05 | 2.05e-01 | 0.1287 |
| 65987 | KCTD14 | P37T-E | Human | Esophagus | ESCC | 2.49e-03 | 9.65e-02 | 0.1371 |
| 65987 | KCTD14 | P38T-E | Human | Esophagus | ESCC | 5.33e-08 | 3.10e-01 | 0.127 |
| 65987 | KCTD14 | P52T-E | Human | Esophagus | ESCC | 4.79e-07 | 3.61e-01 | 0.1555 |
| 65987 | KCTD14 | P54T-E | Human | Esophagus | ESCC | 2.88e-02 | 1.42e-01 | 0.0975 |
| 65987 | KCTD14 | P56T-E | Human | Esophagus | ESCC | 2.49e-02 | 4.71e-01 | 0.1613 |
| 65987 | KCTD14 | P57T-E | Human | Esophagus | ESCC | 2.91e-04 | 1.49e-01 | 0.0926 |
| 65987 | KCTD14 | P62T-E | Human | Esophagus | ESCC | 1.34e-10 | 1.77e-01 | 0.1302 |
| 65987 | KCTD14 | P65T-E | Human | Esophagus | ESCC | 8.81e-07 | 8.84e-02 | 0.0978 |
| 65987 | KCTD14 | P74T-E | Human | Esophagus | ESCC | 8.82e-08 | 3.36e-01 | 0.1479 |
| 65987 | KCTD14 | P75T-E | Human | Esophagus | ESCC | 6.14e-11 | 2.78e-01 | 0.1125 |
| 65987 | KCTD14 | P76T-E | Human | Esophagus | ESCC | 1.40e-28 | 5.89e-01 | 0.1207 |
| 65987 | KCTD14 | P80T-E | Human | Esophagus | ESCC | 4.80e-04 | 3.10e-01 | 0.155 |
| 65987 | KCTD14 | P89T-E | Human | Esophagus | ESCC | 3.86e-12 | 6.22e-01 | 0.1752 |
| Page: 1 2 |
| Tissue | Expression Dynamics | Abbreviation |
| Esophagus | 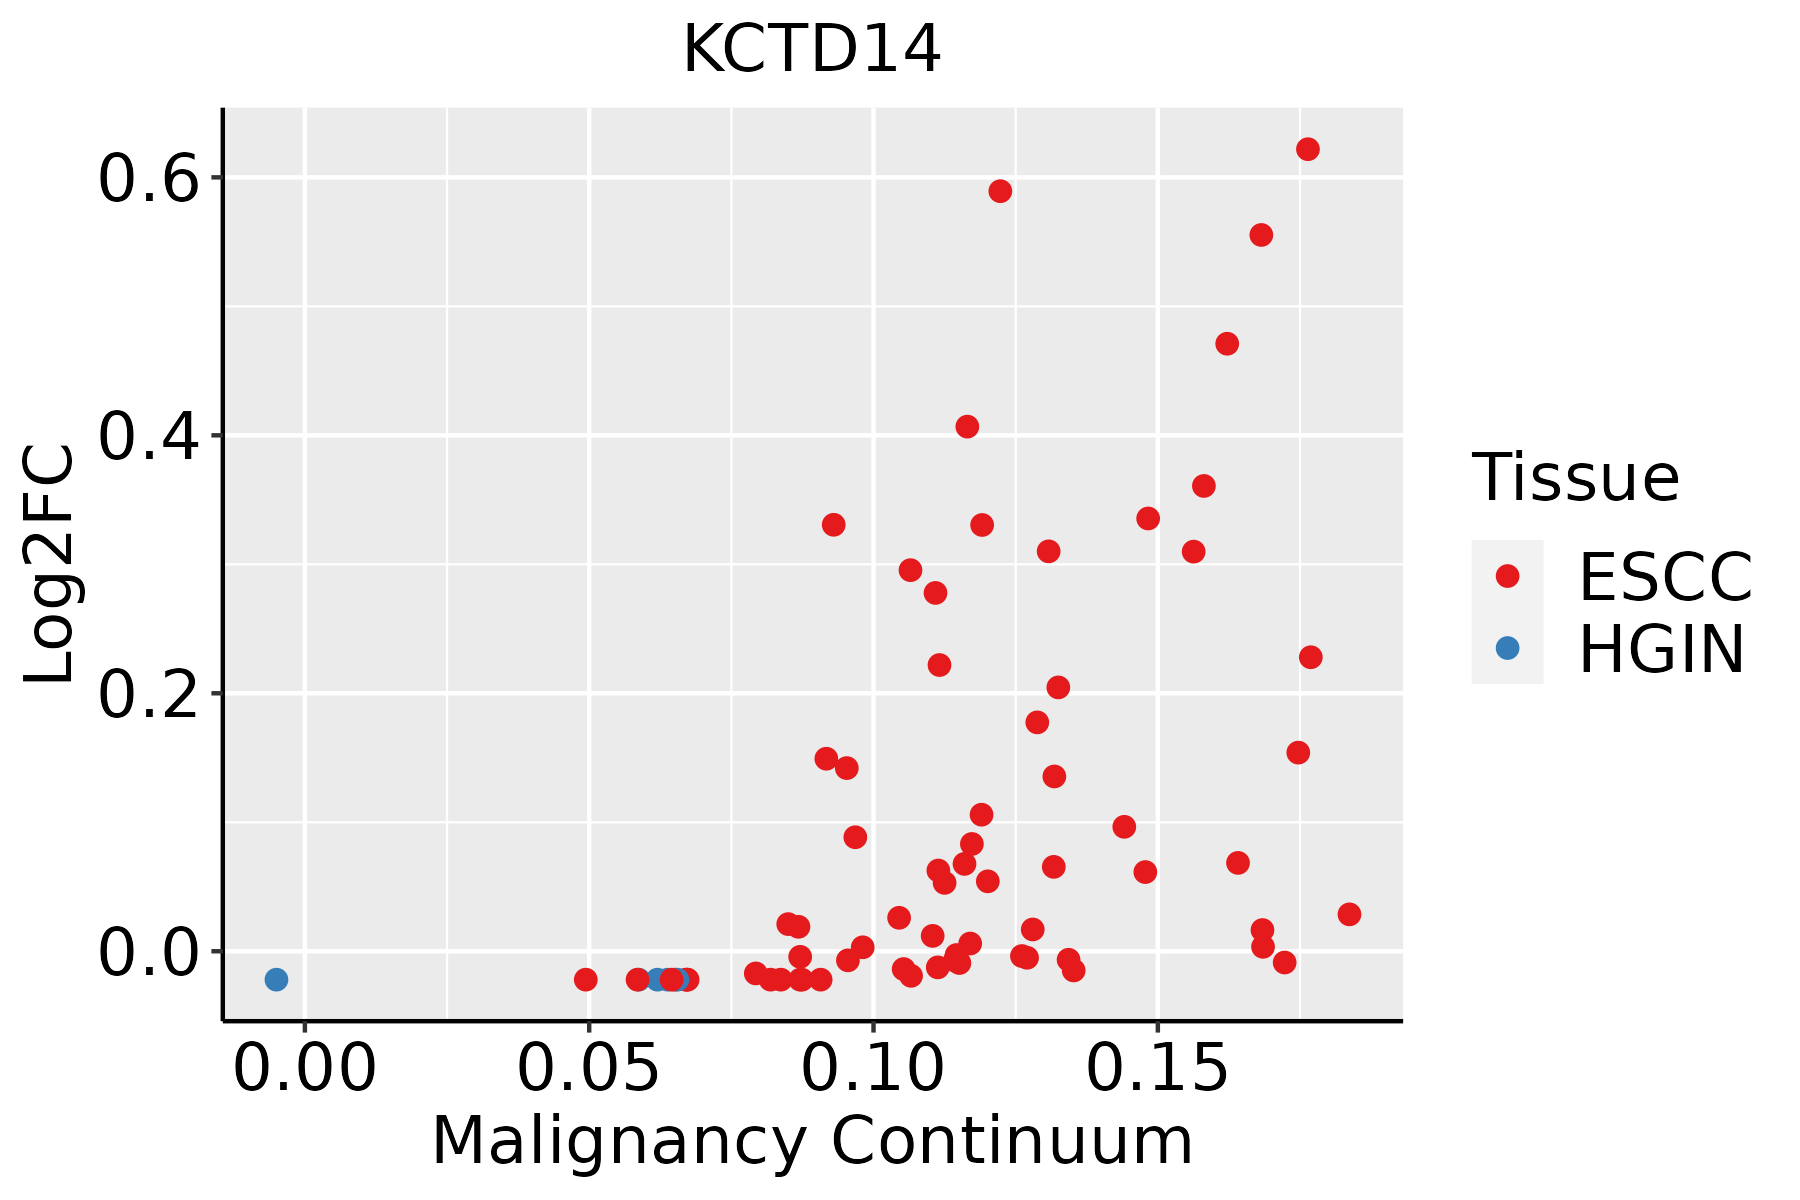 | ESCC: Esophageal squamous cell carcinoma |
| HGIN: High-grade intraepithelial neoplasias | ||
| LGIN: Low-grade intraepithelial neoplasias |
| ∗log2FC in expression of this searched gene in stem-like cells from each diseased tissue sample relative to stem-like cells in normal samples in each tissue plotted against the malignancy continuum. Samples are colored based on if they are from different disease stage. |
Top |
Malignant transformation related pathway analysis |
| Find out the enriched GO biological processes and KEGG pathways involved in transition from healthy to precancer to cancer |
| Tissue | Disease Stage | Enriched GO biological Processes |
| Colorectum | AD |  |
| Colorectum | SER |  |
| Colorectum | MSS |  |
| Colorectum | MSI-H |  |
| Colorectum | FAP |  |
| ∗Top 15 enriched GO BP terms are showed in the bar plot of each disease state in each tissue. Each row represents a significant GO biological process which is colored according to the -log10(p.adjust). |
| Page: 1 2 3 4 5 6 7 8 9 |
| GO ID | Tissue | Disease Stage | Description | Gene Ratio | Bg Ratio | pvalue | p.adjust | Count |
| GO:00512592 | Esophagus | ESCC | protein complex oligomerization | 130/8552 | 238/18723 | 3.29e-03 | 1.36e-02 | 130 |
| Page: 1 |
| Pathway ID | Tissue | Disease Stage | Description | Gene Ratio | Bg Ratio | pvalue | p.adjust | qvalue | Count |
| Page: 1 |
Top |
Cell-cell communication analysis |
| Identification of potential cell-cell interactions between two cell types and their ligand-receptor pairs for different disease states |
| Ligand | Receptor | LRpair | Pathway | Tissue | Disease Stage |
| Page: 1 |
Top |
Single-cell gene regulatory network inference analysis |
| Find out the significant the regulons (TFs) and the target genes of each regulon across cell types for different disease states |
| TF | Cell Type | Tissue | Disease Stage | Target Gene | RSS | Regulon Activity |
| ∗The dot plots of a searched regulon are shown for all cell subpopulations in each disease state of each tissue based on the regulon specific score inferred using pySCENIC and by calculating the average expression. |
| Page: 1 |
Top |
Somatic mutation of malignant transformation related genes |
| Annotation of somatic variants for genes involved in malignant transformation |
| Hugo Symbol | Variant Class | Variant Classification | dbSNP RS | HGVSc | HGVSp | HGVSp Short | SWISSPROT | BIOTYPE | SIFT | PolyPhen | Tumor Sample Barcode | Tissue | Histology | Sex | Age | Stage | Therapy Types | Drugs | Outcome |
| KCTD14 | SNV | Missense_Mutation | novel | c.289C>G | p.Gln97Glu | p.Q97E | Q9BQ13 | protein_coding | tolerated(0.27) | possibly_damaging(0.473) | TCGA-A2-A3XT-01 | Breast | breast invasive carcinoma | Female | <65 | I/II | Chemotherapy | cyclophosphamide | PR |
| KCTD14 | SNV | Missense_Mutation | novel | c.676N>C | p.Tyr226His | p.Y226H | Q9BQ13 | protein_coding | deleterious(0) | probably_damaging(0.998) | TCGA-AN-A046-01 | Breast | breast invasive carcinoma | Female | >=65 | I/II | Unknown | Unknown | SD |
| KCTD14 | SNV | Missense_Mutation | rs377147362 | c.340N>A | p.Glu114Lys | p.E114K | Q9BQ13 | protein_coding | tolerated(0.41) | benign(0.307) | TCGA-AN-A046-01 | Breast | breast invasive carcinoma | Female | >=65 | I/II | Unknown | Unknown | SD |
| KCTD14 | SNV | Missense_Mutation | rs534936161 | c.281N>A | p.Arg94His | p.R94H | Q9BQ13 | protein_coding | deleterious(0.03) | probably_damaging(1) | TCGA-2W-A8YY-01 | Cervix | cervical & endocervical cancer | Female | <65 | I/II | Chemotherapy | cisplatin | CR |
| KCTD14 | SNV | Missense_Mutation | rs374366969 | c.724N>A | p.Glu242Lys | p.E242K | Q9BQ13 | protein_coding | tolerated(1) | benign(0) | TCGA-AA-3984-01 | Colorectum | colon adenocarcinoma | Female | <65 | I/II | Unknown | Unknown | SD |
| KCTD14 | SNV | Missense_Mutation | rs374366969 | c.724G>A | p.Glu242Lys | p.E242K | Q9BQ13 | protein_coding | tolerated(1) | benign(0) | TCGA-AA-A00N-01 | Colorectum | colon adenocarcinoma | Male | >=65 | I/II | Unknown | Unknown | PD |
| KCTD14 | SNV | Missense_Mutation | rs748740683 | c.634N>A | p.Asp212Asn | p.D212N | Q9BQ13 | protein_coding | deleterious(0) | possibly_damaging(0.893) | TCGA-AZ-4313-01 | Colorectum | colon adenocarcinoma | Female | <65 | I/II | Unknown | Unknown | SD |
| KCTD14 | SNV | Missense_Mutation | rs752112333 | c.115G>A | p.Val39Ile | p.V39I | Q9BQ13 | protein_coding | tolerated(0.24) | possibly_damaging(0.636) | TCGA-AZ-4615-01 | Colorectum | colon adenocarcinoma | Male | >=65 | III/IV | Chemotherapy | xeloda | PD |
| KCTD14 | SNV | Missense_Mutation | c.466G>T | p.Ala156Ser | p.A156S | Q9BQ13 | protein_coding | deleterious(0.02) | probably_damaging(0.996) | TCGA-CA-6718-01 | Colorectum | colon adenocarcinoma | Male | <65 | I/II | Unknown | Unknown | PD | |
| KCTD14 | SNV | Missense_Mutation | c.635A>G | p.Asp212Gly | p.D212G | Q9BQ13 | protein_coding | deleterious(0) | probably_damaging(0.937) | TCGA-CK-4951-01 | Colorectum | colon adenocarcinoma | Female | >=65 | I/II | Unknown | Unknown | PD |
| Page: 1 2 3 4 |
Top |
Related drugs of malignant transformation related genes |
| Identification of chemicals and drugs interact with genes involved in malignant transfromation |
| (DGIdb 4.0) |
| Entrez ID | Symbol | Category | Interaction Types | Drug Claim Name | Drug Name | PMIDs |
| Page: 1 |

Copyright 2023-Present -The University of Texas Health Science Center at Houston |