
|
|||||
|
 | |
| |
| |
| |
| |
| |
|
Gene: KCTD12 |
Gene summary for KCTD12 |
| Gene information | Species | Human | Gene symbol | KCTD12 | Gene ID | 115207 |
| Gene name | potassium channel tetramerization domain containing 12 | |
| Gene Alias | C13orf2 | |
| Cytomap | 13q22.3 | |
| Gene Type | protein-coding | GO ID | GO:0008150 | UniProtAcc | A0A140VJM4 |
Top |
Malignant transformation analysis |
| Identification of the aberrant gene expression in precancerous and cancerous lesions by comparing the gene expression of stem-like cells in diseased tissues with normal stem cells |
| Entrez ID | Symbol | Replicates | Species | Organ | Tissue | Adj P-value | Log2FC | Malignancy |
| 115207 | KCTD12 | C04 | Human | Oral cavity | OSCC | 2.82e-05 | 3.57e-01 | 0.2633 |
| 115207 | KCTD12 | C21 | Human | Oral cavity | OSCC | 3.12e-16 | 6.50e-01 | 0.2678 |
| 115207 | KCTD12 | C30 | Human | Oral cavity | OSCC | 1.03e-05 | 5.04e-01 | 0.3055 |
| 115207 | KCTD12 | C43 | Human | Oral cavity | OSCC | 2.27e-05 | 1.12e-01 | 0.1704 |
| 115207 | KCTD12 | C51 | Human | Oral cavity | OSCC | 4.81e-03 | 3.67e-01 | 0.2674 |
| 115207 | KCTD12 | C06 | Human | Oral cavity | OSCC | 3.26e-02 | 6.43e-01 | 0.2699 |
| 115207 | KCTD12 | C08 | Human | Oral cavity | OSCC | 1.75e-03 | 1.60e-02 | 0.1919 |
| 115207 | KCTD12 | C09 | Human | Oral cavity | OSCC | 1.57e-02 | 1.46e-01 | 0.1431 |
| 115207 | KCTD12 | SYSMH1 | Human | Oral cavity | OSCC | 1.75e-07 | 1.58e-01 | 0.1127 |
| 115207 | KCTD12 | SYSMH3 | Human | Oral cavity | OSCC | 3.61e-04 | 1.45e-01 | 0.2442 |
| Page: 1 |
| Tissue | Expression Dynamics | Abbreviation |
| Oral Cavity | 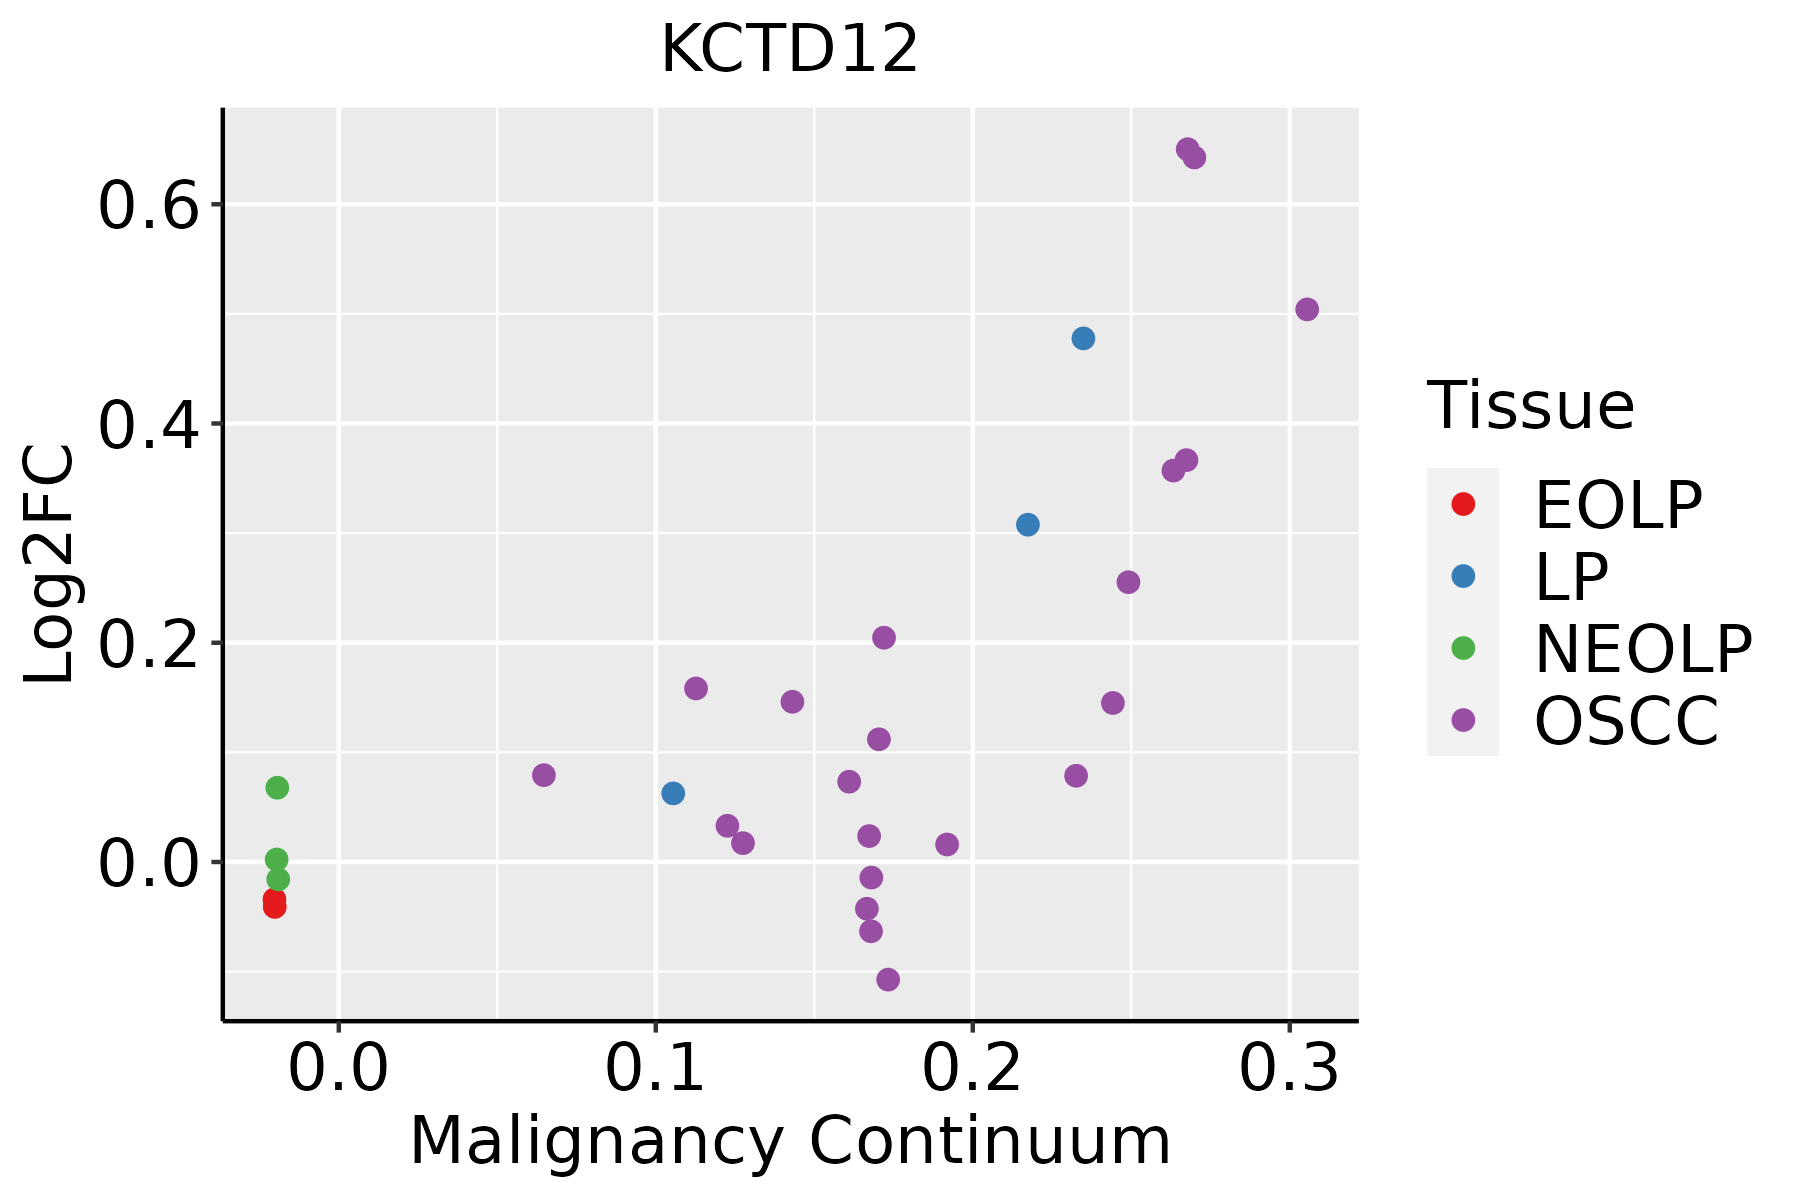 | EOLP: Erosive Oral lichen planus |
| LP: leukoplakia | ||
| NEOLP: Non-erosive oral lichen planus | ||
| OSCC: Oral squamous cell carcinoma |
| ∗log2FC in expression of this searched gene in stem-like cells from each diseased tissue sample relative to stem-like cells in normal samples in each tissue plotted against the malignancy continuum. Samples are colored based on if they are from different disease stage. |
Top |
Malignant transformation related pathway analysis |
| Find out the enriched GO biological processes and KEGG pathways involved in transition from healthy to precancer to cancer |
| Tissue | Disease Stage | Enriched GO biological Processes |
| Colorectum | AD |  |
| Colorectum | SER |  |
| Colorectum | MSS |  |
| Colorectum | MSI-H |  |
| Colorectum | FAP |  |
| ∗Top 15 enriched GO BP terms are showed in the bar plot of each disease state in each tissue. Each row represents a significant GO biological process which is colored according to the -log10(p.adjust). |
| Page: 1 2 3 4 5 6 7 8 9 |
| GO ID | Tissue | Disease Stage | Description | Gene Ratio | Bg Ratio | pvalue | p.adjust | Count |
| GO:0051259 | Oral cavity | OSCC | protein complex oligomerization | 121/7305 | 238/18723 | 1.29e-04 | 9.21e-04 | 121 |
| Page: 1 |
| Pathway ID | Tissue | Disease Stage | Description | Gene Ratio | Bg Ratio | pvalue | p.adjust | qvalue | Count |
| Page: 1 |
Top |
Cell-cell communication analysis |
| Identification of potential cell-cell interactions between two cell types and their ligand-receptor pairs for different disease states |
| Ligand | Receptor | LRpair | Pathway | Tissue | Disease Stage |
| Page: 1 |
Top |
Single-cell gene regulatory network inference analysis |
| Find out the significant the regulons (TFs) and the target genes of each regulon across cell types for different disease states |
| TF | Cell Type | Tissue | Disease Stage | Target Gene | RSS | Regulon Activity |
| ∗The dot plots of a searched regulon are shown for all cell subpopulations in each disease state of each tissue based on the regulon specific score inferred using pySCENIC and by calculating the average expression. |
| Page: 1 |
Top |
Somatic mutation of malignant transformation related genes |
| Annotation of somatic variants for genes involved in malignant transformation |
| Hugo Symbol | Variant Class | Variant Classification | dbSNP RS | HGVSc | HGVSp | HGVSp Short | SWISSPROT | BIOTYPE | SIFT | PolyPhen | Tumor Sample Barcode | Tissue | Histology | Sex | Age | Stage | Therapy Types | Drugs | Outcome |
| KCTD12 | SNV | Missense_Mutation | novel | c.938N>C | p.Ile313Thr | p.I313T | Q96CX2 | protein_coding | deleterious(0.01) | benign(0.122) | TCGA-E9-A1N3-01 | Breast | breast invasive carcinoma | Female | >=65 | III/IV | Chemotherapy | 5-fluorouracil | CR |
| KCTD12 | deletion | In_Frame_Del | novel | c.121_132delGGGGGCCAGGTG | p.Gly41_Val44del | p.G41_V44del | Q96CX2 | protein_coding | TCGA-D8-A1XW-01 | Breast | breast invasive carcinoma | Female | <65 | I/II | Chemotherapy | adriamycin+cyclophosphamide | SD | ||
| KCTD12 | SNV | Missense_Mutation | c.704N>C | p.Arg235Pro | p.R235P | Q96CX2 | protein_coding | deleterious(0) | possibly_damaging(0.905) | TCGA-CK-4951-01 | Colorectum | colon adenocarcinoma | Female | >=65 | I/II | Unknown | Unknown | PD | |
| KCTD12 | SNV | Missense_Mutation | c.811T>C | p.Tyr271His | p.Y271H | Q96CX2 | protein_coding | deleterious(0.05) | benign(0.159) | TCGA-CK-6746-01 | Colorectum | colon adenocarcinoma | Female | >=65 | I/II | Unknown | Unknown | SD | |
| KCTD12 | SNV | Missense_Mutation | c.905N>A | p.Phe302Tyr | p.F302Y | Q96CX2 | protein_coding | tolerated(0.29) | benign(0.007) | TCGA-G4-6294-01 | Colorectum | colon adenocarcinoma | Male | >=65 | III/IV | Chemotherapy | fluorouracil | PD | |
| KCTD12 | SNV | Missense_Mutation | novel | c.652N>C | p.Tyr218His | p.Y218H | Q96CX2 | protein_coding | tolerated(0.12) | benign(0.043) | TCGA-G4-6586-01 | Colorectum | colon adenocarcinoma | Female | >=65 | I/II | Unknown | Unknown | SD |
| KCTD12 | SNV | Missense_Mutation | c.677N>T | p.Ala226Val | p.A226V | Q96CX2 | protein_coding | deleterious(0.01) | benign(0.062) | TCGA-WS-AB45-01 | Colorectum | colon adenocarcinoma | Female | <65 | I/II | Unknown | Unknown | SD | |
| KCTD12 | SNV | Missense_Mutation | novel | c.838G>A | p.Ala280Thr | p.A280T | Q96CX2 | protein_coding | deleterious(0) | probably_damaging(0.998) | TCGA-AG-A002-01 | Colorectum | rectum adenocarcinoma | Male | <65 | I/II | Unknown | Unknown | SD |
| KCTD12 | deletion | Frame_Shift_Del | novel | c.41delN | p.Gly14AlafsTer25 | p.G14Afs*25 | Q96CX2 | protein_coding | TCGA-AA-3947-01 | Colorectum | colon adenocarcinoma | Female | <65 | I/II | Unknown | Unknown | SD | ||
| KCTD12 | SNV | Missense_Mutation | novel | c.686N>G | p.Lys229Arg | p.K229R | Q96CX2 | protein_coding | deleterious(0.04) | possibly_damaging(0.619) | TCGA-DF-A2KU-01 | Endometrium | uterine corpus endometrioid carcinoma | Female | Unknown | I/II | Unknown | Unknown | SD |
| Page: 1 2 |
Top |
Related drugs of malignant transformation related genes |
| Identification of chemicals and drugs interact with genes involved in malignant transfromation |
| (DGIdb 4.0) |
| Entrez ID | Symbol | Category | Interaction Types | Drug Claim Name | Drug Name | PMIDs |
| Page: 1 |

Copyright 2023-Present -The University of Texas Health Science Center at Houston |