
|
|||||
|
 | |
| |
| |
| |
| |
| |
|
Gene: KCTD11 |
Gene summary for KCTD11 |
| Gene information | Species | Human | Gene symbol | KCTD11 | Gene ID | 147040 |
| Gene name | potassium channel tetramerization domain containing 11 | |
| Gene Alias | C17orf36 | |
| Cytomap | 17p13.1 | |
| Gene Type | protein-coding | GO ID | GO:0006464 | UniProtAcc | A0A158RFT7 |
Top |
Malignant transformation analysis |
| Identification of the aberrant gene expression in precancerous and cancerous lesions by comparing the gene expression of stem-like cells in diseased tissues with normal stem cells |
| Entrez ID | Symbol | Replicates | Species | Organ | Tissue | Adj P-value | Log2FC | Malignancy |
| 147040 | KCTD11 | LZE4T | Human | Esophagus | ESCC | 5.46e-08 | 3.62e-01 | 0.0811 |
| 147040 | KCTD11 | LZE8T | Human | Esophagus | ESCC | 1.23e-06 | 2.28e-01 | 0.067 |
| 147040 | KCTD11 | LZE24T | Human | Esophagus | ESCC | 9.60e-04 | 1.72e-01 | 0.0596 |
| 147040 | KCTD11 | P1T-E | Human | Esophagus | ESCC | 6.04e-03 | 2.14e-01 | 0.0875 |
| 147040 | KCTD11 | P2T-E | Human | Esophagus | ESCC | 4.94e-17 | 2.42e-01 | 0.1177 |
| 147040 | KCTD11 | P4T-E | Human | Esophagus | ESCC | 4.75e-13 | 2.89e-01 | 0.1323 |
| 147040 | KCTD11 | P5T-E | Human | Esophagus | ESCC | 8.80e-13 | 2.49e-01 | 0.1327 |
| 147040 | KCTD11 | P8T-E | Human | Esophagus | ESCC | 1.22e-07 | 1.44e-01 | 0.0889 |
| 147040 | KCTD11 | P10T-E | Human | Esophagus | ESCC | 9.42e-06 | 1.10e-01 | 0.116 |
| 147040 | KCTD11 | P11T-E | Human | Esophagus | ESCC | 1.08e-12 | 6.79e-01 | 0.1426 |
| 147040 | KCTD11 | P12T-E | Human | Esophagus | ESCC | 5.55e-09 | 2.68e-01 | 0.1122 |
| 147040 | KCTD11 | P15T-E | Human | Esophagus | ESCC | 1.89e-04 | 1.43e-01 | 0.1149 |
| 147040 | KCTD11 | P16T-E | Human | Esophagus | ESCC | 1.70e-09 | 1.98e-01 | 0.1153 |
| 147040 | KCTD11 | P17T-E | Human | Esophagus | ESCC | 3.11e-06 | 3.60e-01 | 0.1278 |
| 147040 | KCTD11 | P19T-E | Human | Esophagus | ESCC | 8.81e-04 | 3.79e-01 | 0.1662 |
| 147040 | KCTD11 | P20T-E | Human | Esophagus | ESCC | 4.83e-06 | 1.69e-01 | 0.1124 |
| 147040 | KCTD11 | P21T-E | Human | Esophagus | ESCC | 1.62e-19 | 4.01e-01 | 0.1617 |
| 147040 | KCTD11 | P22T-E | Human | Esophagus | ESCC | 9.27e-05 | 1.18e-01 | 0.1236 |
| 147040 | KCTD11 | P23T-E | Human | Esophagus | ESCC | 1.32e-07 | 2.09e-01 | 0.108 |
| 147040 | KCTD11 | P24T-E | Human | Esophagus | ESCC | 1.37e-09 | 1.87e-01 | 0.1287 |
| Page: 1 2 3 4 |
| Tissue | Expression Dynamics | Abbreviation |
| Esophagus | 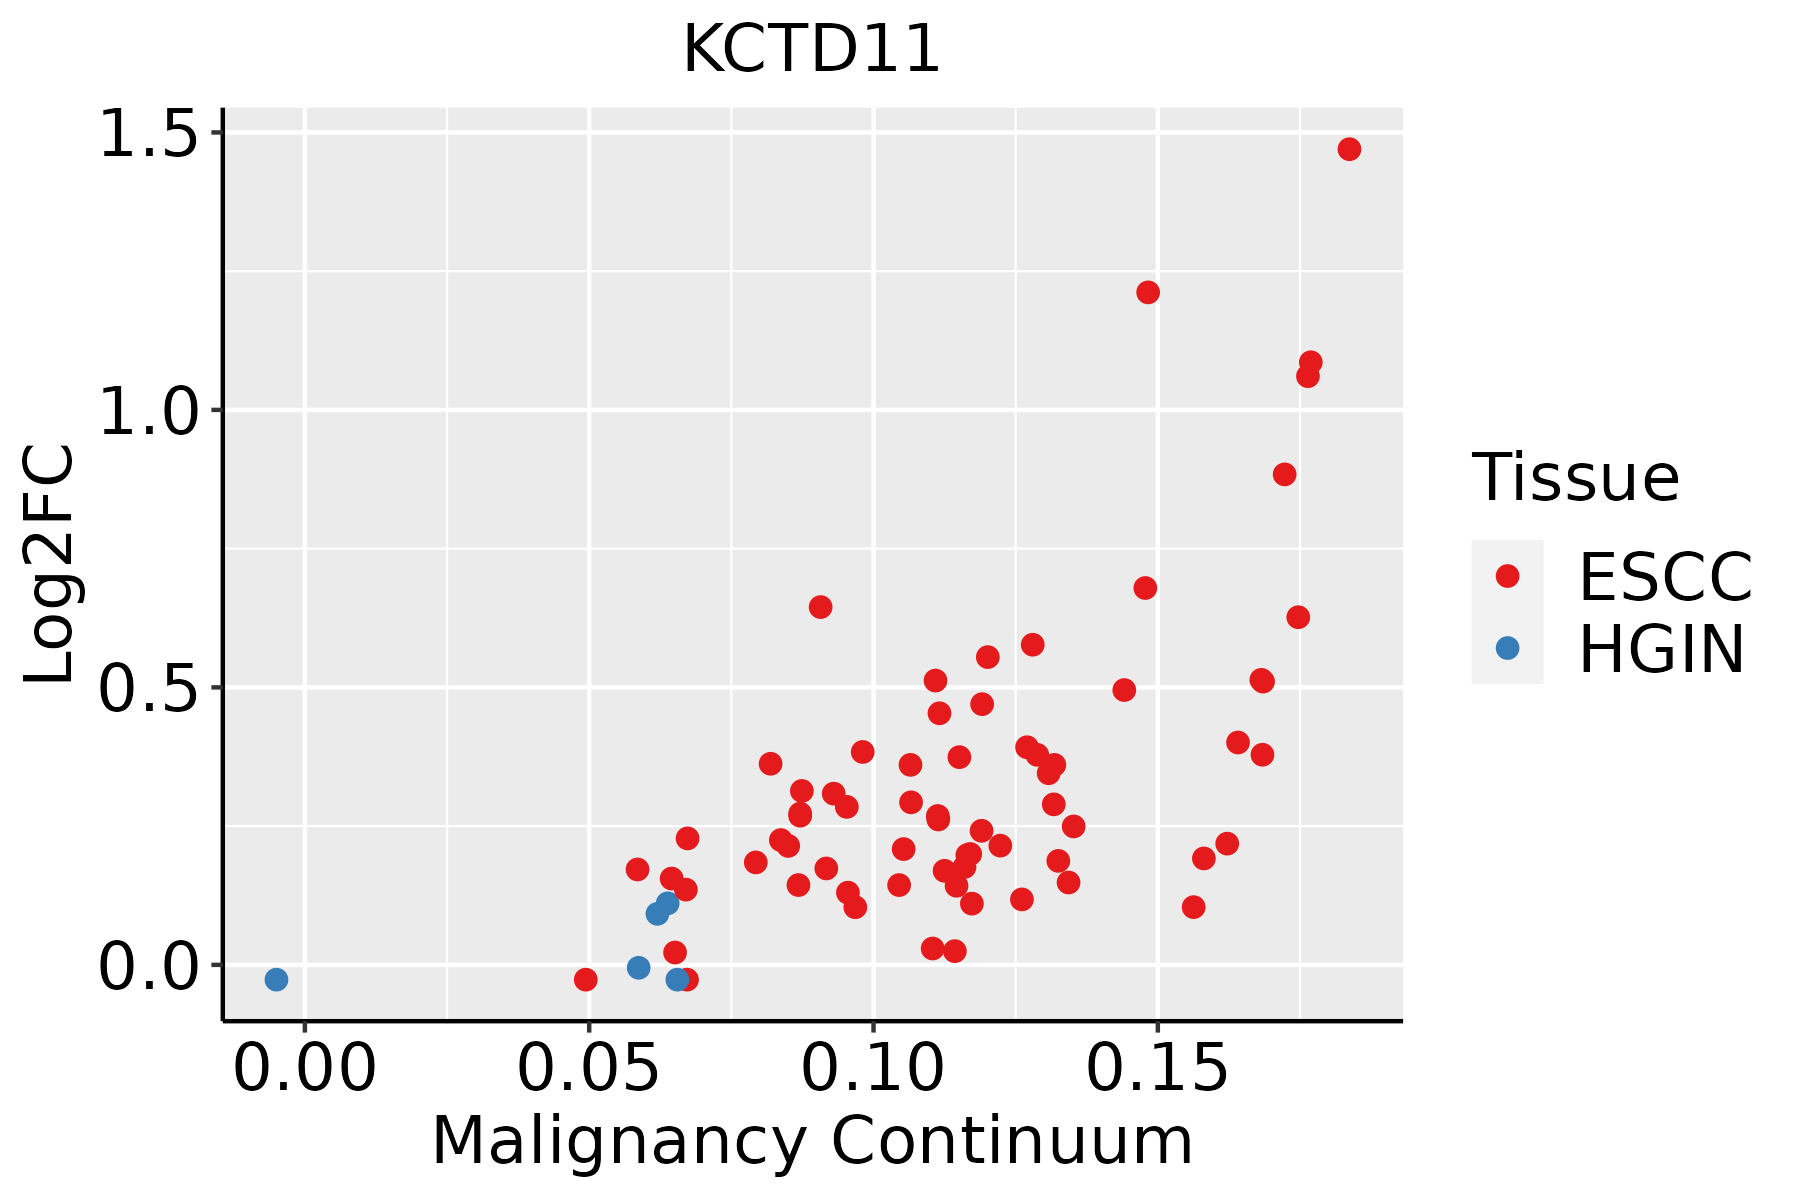 | ESCC: Esophageal squamous cell carcinoma |
| HGIN: High-grade intraepithelial neoplasias | ||
| LGIN: Low-grade intraepithelial neoplasias | ||
| Oral Cavity | 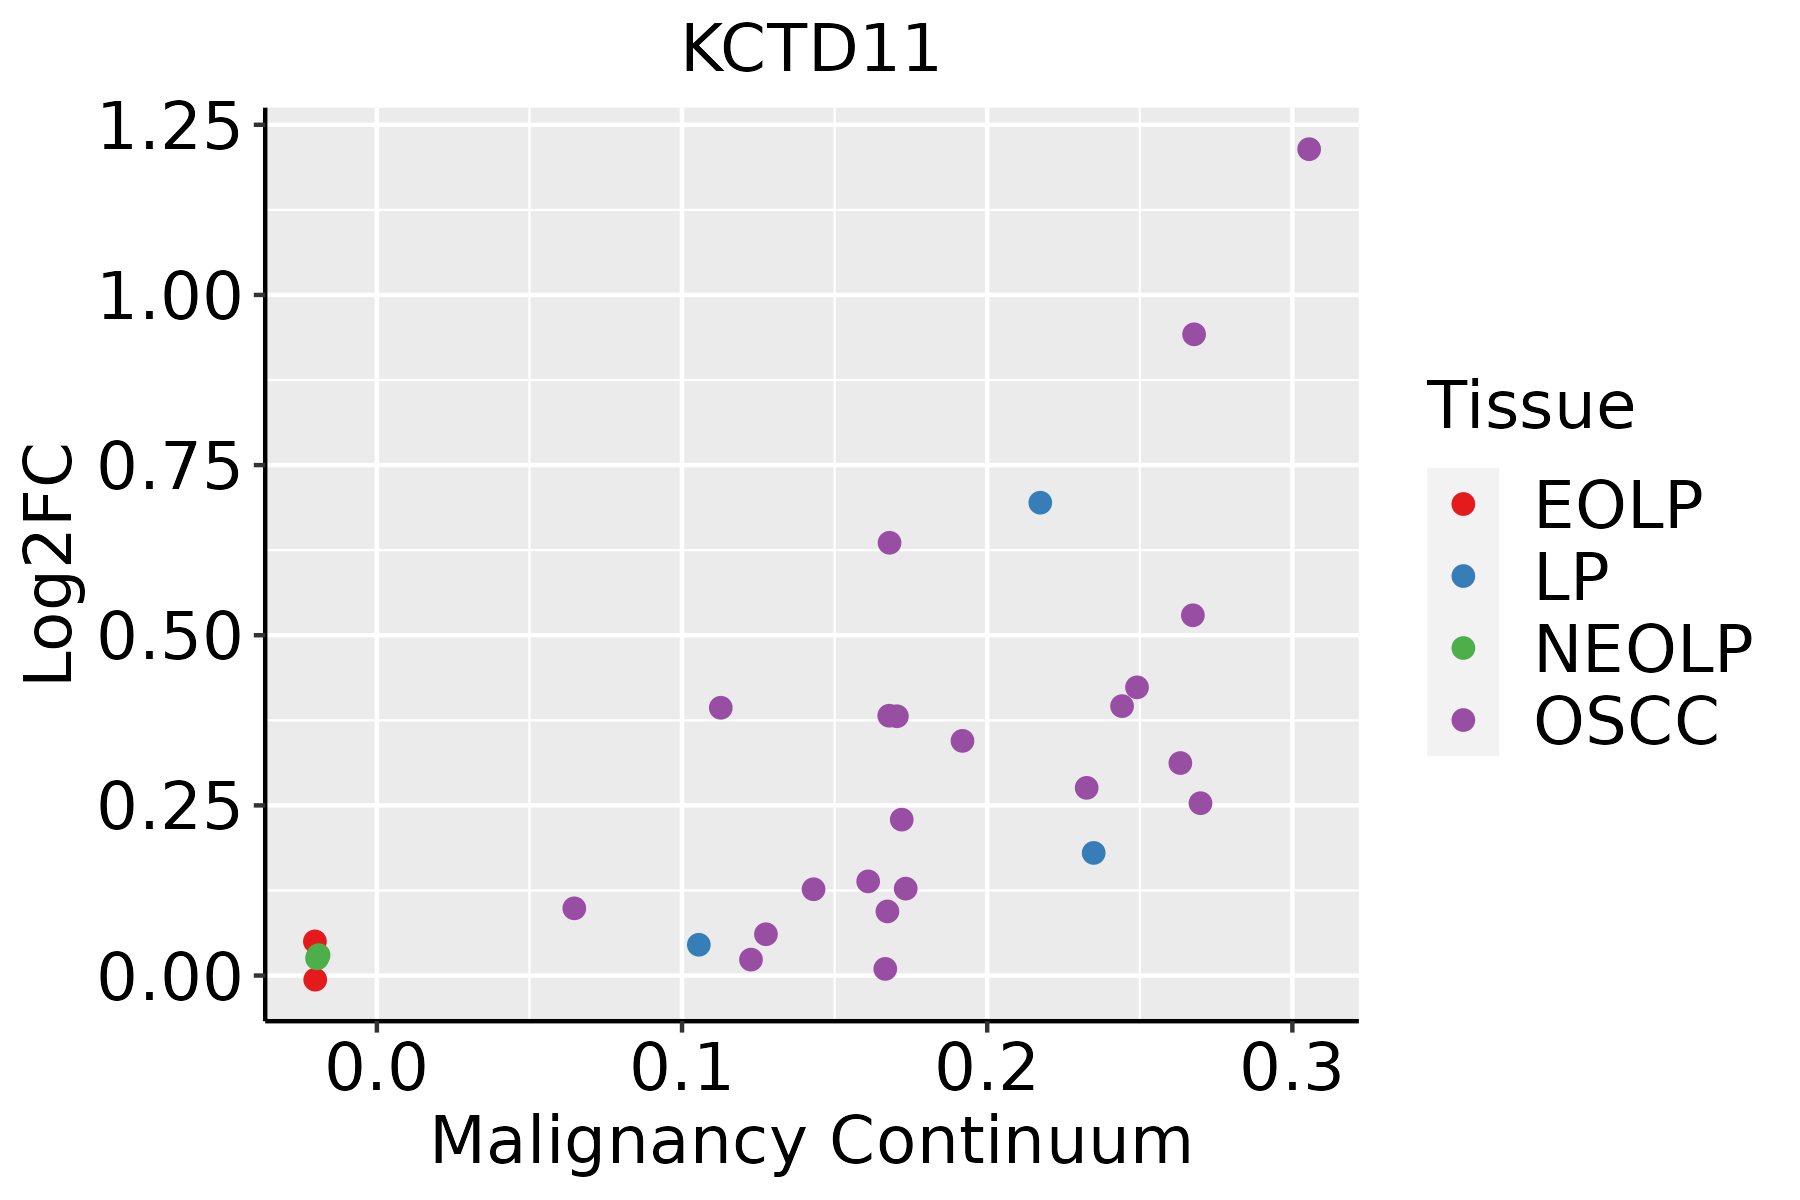 | EOLP: Erosive Oral lichen planus |
| LP: leukoplakia | ||
| NEOLP: Non-erosive oral lichen planus | ||
| OSCC: Oral squamous cell carcinoma |
| ∗log2FC in expression of this searched gene in stem-like cells from each diseased tissue sample relative to stem-like cells in normal samples in each tissue plotted against the malignancy continuum. Samples are colored based on if they are from different disease stage. |
Top |
Malignant transformation related pathway analysis |
| Find out the enriched GO biological processes and KEGG pathways involved in transition from healthy to precancer to cancer |
| Tissue | Disease Stage | Enriched GO biological Processes |
| Colorectum | AD |  |
| Colorectum | SER |  |
| Colorectum | MSS |  |
| Colorectum | MSI-H |  |
| Colorectum | FAP |  |
| ∗Top 15 enriched GO BP terms are showed in the bar plot of each disease state in each tissue. Each row represents a significant GO biological process which is colored according to the -log10(p.adjust). |
| Page: 1 2 3 4 5 6 7 8 9 |
| GO ID | Tissue | Disease Stage | Description | Gene Ratio | Bg Ratio | pvalue | p.adjust | Count |
| GO:00512592 | Esophagus | ESCC | protein complex oligomerization | 130/8552 | 238/18723 | 3.29e-03 | 1.36e-02 | 130 |
| GO:0051259 | Oral cavity | OSCC | protein complex oligomerization | 121/7305 | 238/18723 | 1.29e-04 | 9.21e-04 | 121 |
| GO:00512591 | Oral cavity | LP | protein complex oligomerization | 85/4623 | 238/18723 | 8.81e-05 | 1.11e-03 | 85 |
| Page: 1 |
| Pathway ID | Tissue | Disease Stage | Description | Gene Ratio | Bg Ratio | pvalue | p.adjust | qvalue | Count |
| Page: 1 |
Top |
Cell-cell communication analysis |
| Identification of potential cell-cell interactions between two cell types and their ligand-receptor pairs for different disease states |
| Ligand | Receptor | LRpair | Pathway | Tissue | Disease Stage |
| Page: 1 |
Top |
Single-cell gene regulatory network inference analysis |
| Find out the significant the regulons (TFs) and the target genes of each regulon across cell types for different disease states |
| TF | Cell Type | Tissue | Disease Stage | Target Gene | RSS | Regulon Activity |
| ∗The dot plots of a searched regulon are shown for all cell subpopulations in each disease state of each tissue based on the regulon specific score inferred using pySCENIC and by calculating the average expression. |
| Page: 1 |
Top |
Somatic mutation of malignant transformation related genes |
| Annotation of somatic variants for genes involved in malignant transformation |
| Hugo Symbol | Variant Class | Variant Classification | dbSNP RS | HGVSc | HGVSp | HGVSp Short | SWISSPROT | BIOTYPE | SIFT | PolyPhen | Tumor Sample Barcode | Tissue | Histology | Sex | Age | Stage | Therapy Types | Drugs | Outcome |
| KCTD11 | SNV | Missense_Mutation | c.202C>T | p.Pro68Ser | p.P68S | Q693B1 | protein_coding | deleterious(0.01) | probably_damaging(0.995) | TCGA-AA-3821-01 | Colorectum | colon adenocarcinoma | Female | >=65 | I/II | Unknown | Unknown | SD | |
| KCTD11 | SNV | Missense_Mutation | rs769368508 | c.419N>A | p.Arg140Gln | p.R140Q | Q693B1 | protein_coding | tolerated(0.09) | benign(0.015) | TCGA-AA-A00N-01 | Colorectum | colon adenocarcinoma | Male | >=65 | I/II | Unknown | Unknown | PD |
| KCTD11 | SNV | Missense_Mutation | rs754017618 | c.349G>A | p.Val117Ile | p.V117I | Q693B1 | protein_coding | tolerated(0.07) | benign(0.017) | TCGA-AA-A01R-01 | Colorectum | colon adenocarcinoma | Male | <65 | III/IV | Chemotherapy | 5-fluorouracil | PD |
| KCTD11 | SNV | Missense_Mutation | rs865964999 | c.485N>A | p.Arg162His | p.R162H | Q693B1 | protein_coding | tolerated(0.16) | benign(0) | TCGA-AD-6895-01 | Colorectum | colon adenocarcinoma | Male | >=65 | III/IV | Unknown | Unknown | SD |
| KCTD11 | SNV | Missense_Mutation | rs781114097 | c.100N>T | p.Arg34Trp | p.R34W | Q693B1 | protein_coding | deleterious(0) | possibly_damaging(0.887) | TCGA-AY-6386-01 | Colorectum | colon adenocarcinoma | Female | >=65 | III/IV | Chemotherapy | 5-fu | SD |
| KCTD11 | SNV | Missense_Mutation | c.622G>A | p.Gly208Ser | p.G208S | Q693B1 | protein_coding | deleterious(0.01) | benign(0.007) | TCGA-D5-6930-01 | Colorectum | colon adenocarcinoma | Male | >=65 | I/II | Unknown | Unknown | SD | |
| KCTD11 | SNV | Missense_Mutation | c.11N>A | p.Ala4Asp | p.A4D | Q693B1 | protein_coding | deleterious(0) | benign(0.31) | TCGA-G4-6628-01 | Colorectum | colon adenocarcinoma | Male | >=65 | I/II | Unknown | Unknown | SD | |
| KCTD11 | SNV | Missense_Mutation | novel | c.101N>A | p.Arg34Gln | p.R34Q | Q693B1 | protein_coding | deleterious(0.03) | benign(0.052) | TCGA-A5-A0G2-01 | Endometrium | uterine corpus endometrioid carcinoma | Female | <65 | III/IV | Unknown | Unknown | SD |
| KCTD11 | SNV | Missense_Mutation | c.274N>A | p.Ala92Thr | p.A92T | Q693B1 | protein_coding | tolerated(0.28) | possibly_damaging(0.639) | TCGA-AP-A059-01 | Endometrium | uterine corpus endometrioid carcinoma | Female | >=65 | I/II | Unknown | Unknown | SD | |
| KCTD11 | SNV | Missense_Mutation | novel | c.353N>G | p.Gln118Arg | p.Q118R | Q693B1 | protein_coding | tolerated(0.22) | benign(0) | TCGA-AP-A1DK-01 | Endometrium | uterine corpus endometrioid carcinoma | Female | <65 | I/II | Unknown | Unknown | SD |
| Page: 1 2 3 |
Top |
Related drugs of malignant transformation related genes |
| Identification of chemicals and drugs interact with genes involved in malignant transfromation |
| (DGIdb 4.0) |
| Entrez ID | Symbol | Category | Interaction Types | Drug Claim Name | Drug Name | PMIDs |
| Page: 1 |

Copyright 2023-Present -The University of Texas Health Science Center at Houston |