Schematic overview of the cellular and molecular mechanisms involved in the cancer progression, including the proposed cellular and molecular mechanisms in cancer cells trajectory. AT1: alveolar type 1 cells; AT2: alveolar type 2 cells; AAH: atypical adenomatous hyperplasia; AIS: adenocarcinoma in situ; MIA: minimally invasive adenocarcinoma; IA: invasive adenocarcinoma; EMT: epithelial-mesenchymal transition

Home

Download

Statistics

Help

Contact

Center for Computational Systems Medicine
leaf

Gene summary

leaf

Malignant transformation analysis

leaf

Malignant transformation related pathway analysis

leaf

Cell-cell communication analysis

leaf

Single-cell gene regulatory network inference analysis

leaf

Somatic mutation of malignant transformation related genes

leaf

Related drugs of malignant transformation related genes

Gene: KCTD10

Gene summary for KCTD10

check button Gene summary.

Gene informationSpeciesHuman
Gene symbol

KCTD10

Gene ID

83892

Gene namepotassium channel tetramerization domain containing 10
Gene AliasBTBD28
Cytomap12q24.11
Gene Typeprotein-coding
GO ID

GO:0006464

UniProtAcc

Q9H3F6


Top

Malignant transformation analysis

check button Identification of the aberrant gene expression in precancerous and cancerous lesions by comparing the gene expression of stem-like cells in diseased tissues with normal stem cells
check button Malignant transformation involving gene list.
Entrez IDSymbolReplicatesSpeciesOrganTissueAdj P-valueLog2FCMalignancy
83892KCTD10LZE4THumanEsophagusESCC1.10e-026.33e-020.0811
83892KCTD10LZE7THumanEsophagusESCC8.72e-062.02e-010.0667
83892KCTD10LZE24THumanEsophagusESCC2.34e-049.95e-020.0596
83892KCTD10P1T-EHumanEsophagusESCC4.51e-028.54e-020.0875
83892KCTD10P2T-EHumanEsophagusESCC6.74e-162.88e-010.1177
83892KCTD10P4T-EHumanEsophagusESCC4.64e-111.86e-010.1323
83892KCTD10P5T-EHumanEsophagusESCC8.70e-089.18e-020.1327
83892KCTD10P8T-EHumanEsophagusESCC1.13e-141.50e-010.0889
83892KCTD10P10T-EHumanEsophagusESCC4.79e-053.07e-020.116
83892KCTD10P11T-EHumanEsophagusESCC8.01e-052.50e-010.1426
83892KCTD10P12T-EHumanEsophagusESCC1.12e-043.33e-020.1122
83892KCTD10P15T-EHumanEsophagusESCC5.62e-072.06e-010.1149
83892KCTD10P16T-EHumanEsophagusESCC1.13e-152.06e-010.1153
83892KCTD10P20T-EHumanEsophagusESCC1.38e-066.00e-020.1124
83892KCTD10P21T-EHumanEsophagusESCC5.16e-142.93e-010.1617
83892KCTD10P22T-EHumanEsophagusESCC5.16e-091.15e-010.1236
83892KCTD10P23T-EHumanEsophagusESCC7.63e-091.43e-010.108
83892KCTD10P24T-EHumanEsophagusESCC2.83e-071.15e-010.1287
83892KCTD10P26T-EHumanEsophagusESCC3.39e-081.25e-010.1276
83892KCTD10P27T-EHumanEsophagusESCC2.25e-111.49e-010.1055
Page: 1 2 3 4 5 

check button Transcriptomic changes along malignancy continuum.
TissueExpression DynamicsAbbreviation
EsophagusThe image shows the transcriptomic changes along malignancy continuum.log2FC in expression of this searched gene in stem-like cells from each diseased tissue sample relative to stem-like cells in normal samples in each tissue plotted against the malignancy continuum. Samples are colored based on if they are from different disease stage.
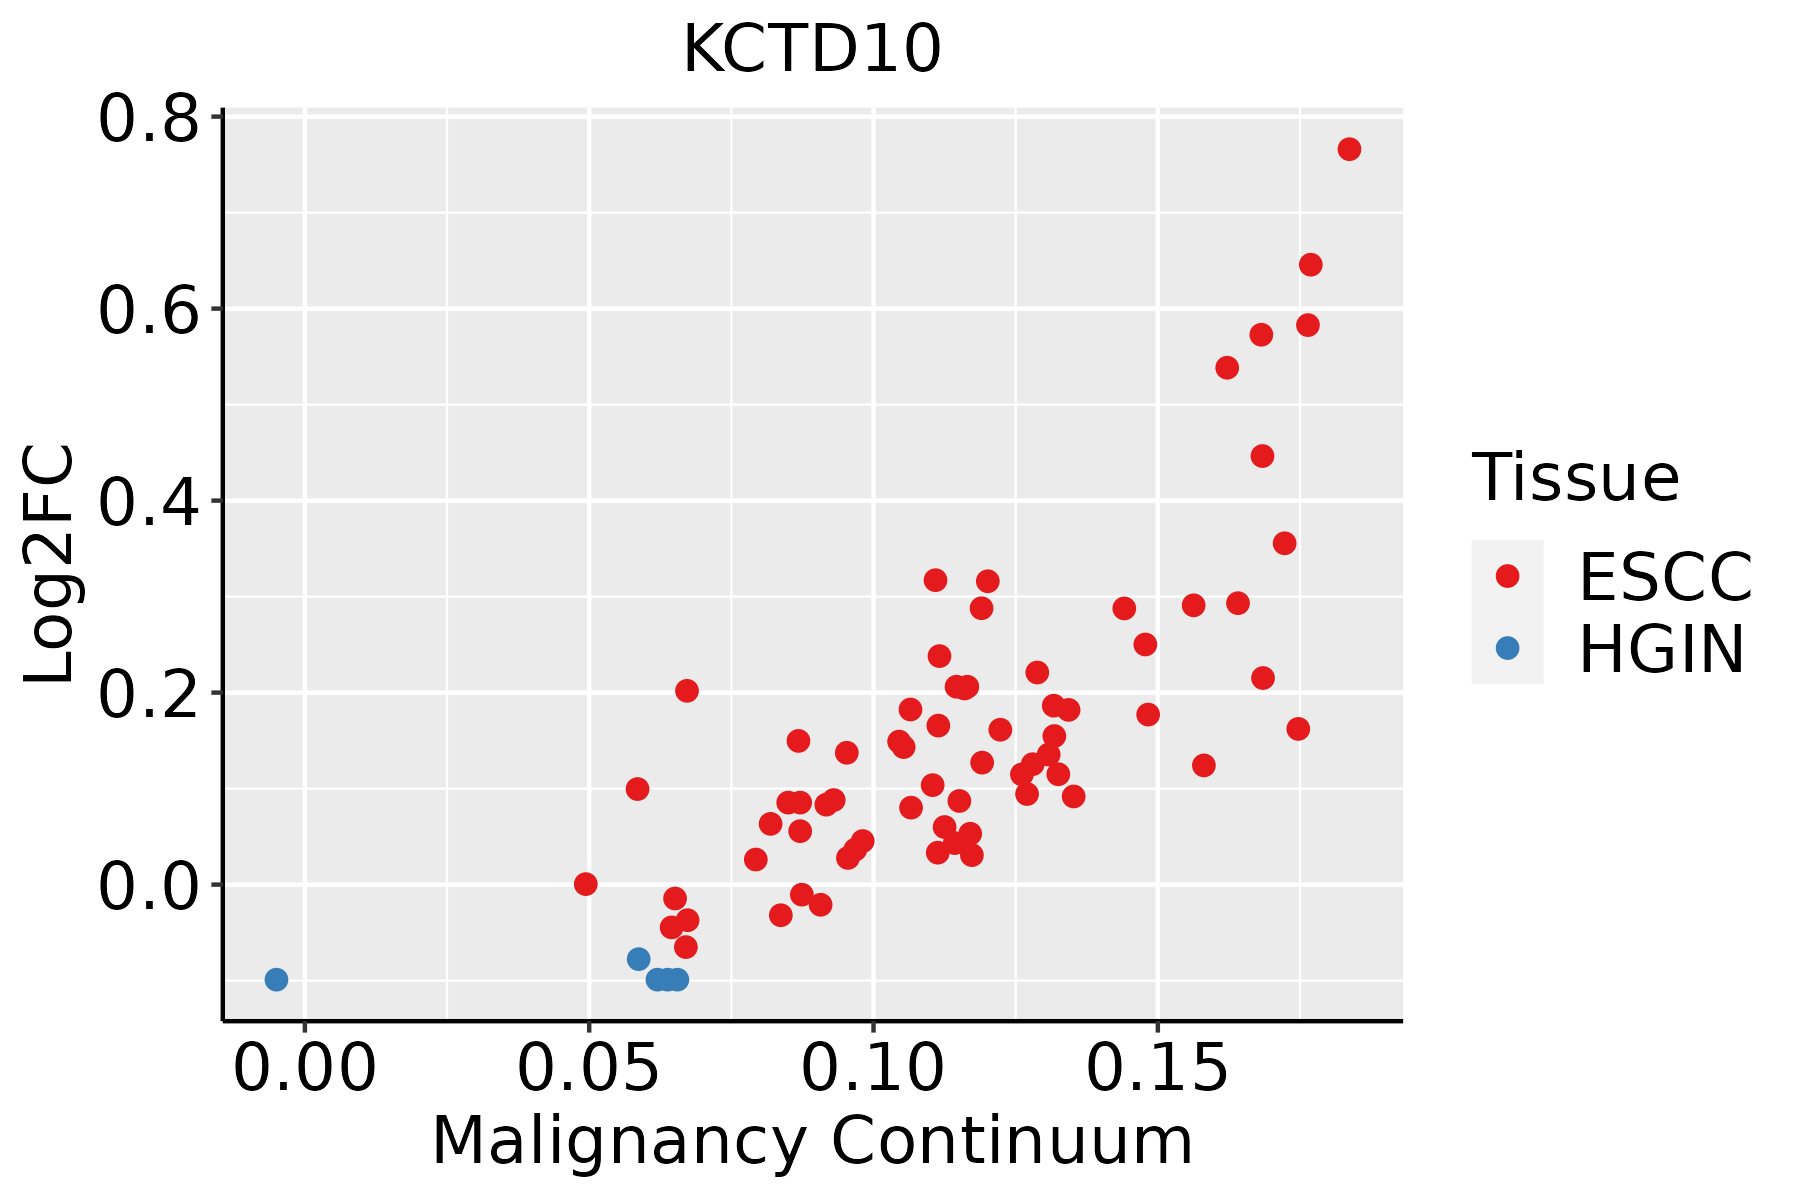
ESCC: Esophageal squamous cell carcinoma
HGIN: High-grade intraepithelial neoplasias
LGIN: Low-grade intraepithelial neoplasias
LiverThe image shows the transcriptomic changes along malignancy continuum.log2FC in expression of this searched gene in stem-like cells from each diseased tissue sample relative to stem-like cells in normal samples in each tissue plotted against the malignancy continuum. Samples are colored based on if they are from different disease stage.HCC: Hepatocellular carcinoma
NAFLD: Non-alcoholic fatty liver disease
Oral CavityThe image shows the transcriptomic changes along malignancy continuum.log2FC in expression of this searched gene in stem-like cells from each diseased tissue sample relative to stem-like cells in normal samples in each tissue plotted against the malignancy continuum. Samples are colored based on if they are from different disease stage.EOLP: Erosive Oral lichen planus
LP: leukoplakia
NEOLP: Non-erosive oral lichen planus
OSCC: Oral squamous cell carcinoma
ThyroidThe image shows the transcriptomic changes along malignancy continuum.log2FC in expression of this searched gene in stem-like cells from each diseased tissue sample relative to stem-like cells in normal samples in each tissue plotted against the malignancy continuum. Samples are colored based on if they are from different disease stage.
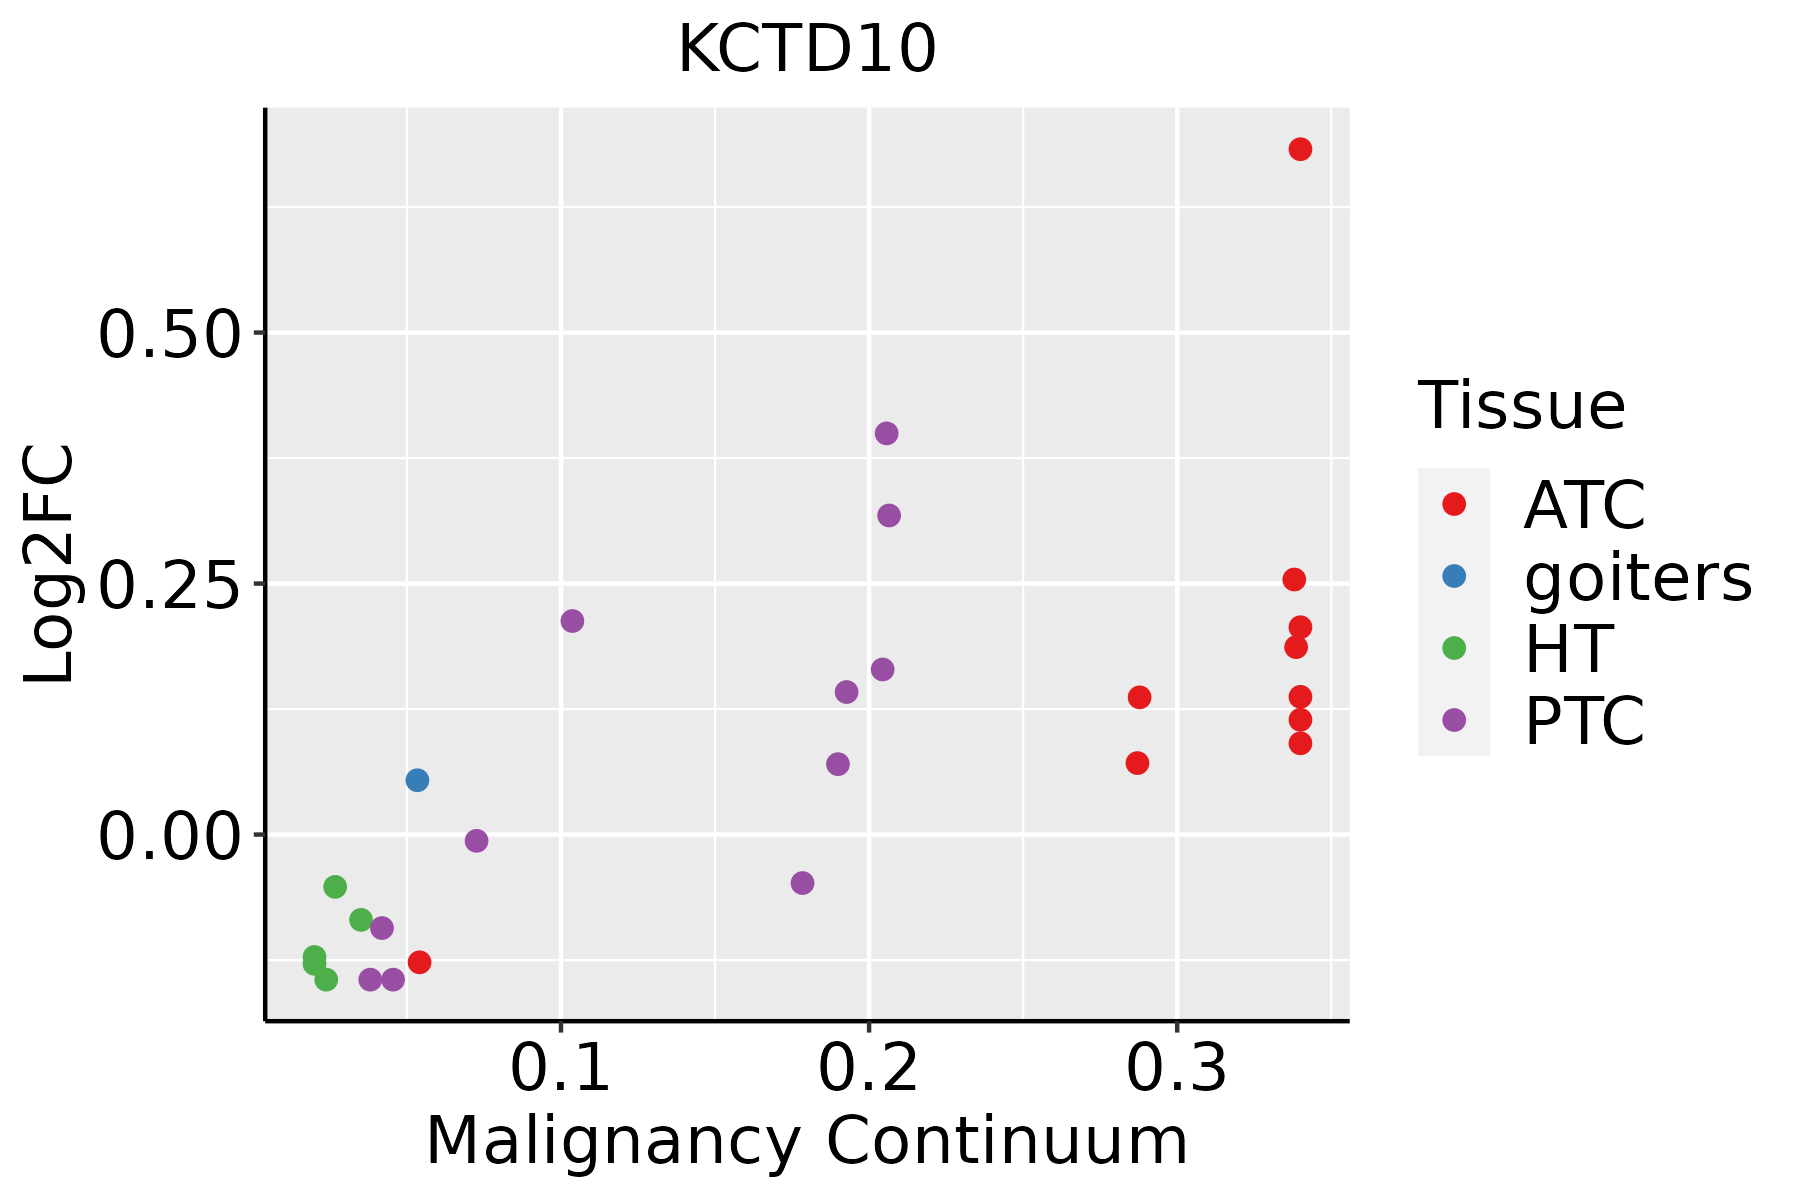
ATC: Anaplastic thyroid cancer
HT: Hashimoto's thyroiditis
PTC: Papillary thyroid cancer
∗log2FC in expression of this searched gene in stem-like cells from each diseased tissue sample relative to stem-like cells in normal samples in each tissue plotted against the malignancy continuum. Samples are colored based on if they are from different disease stage.

Top

Malignant transformation related pathway analysis

check buttonFind out the enriched GO biological processes and KEGG pathways involved in transition from healthy to precancer to cancer
check button Figure of enriched GO biological processes.
TissueDisease StageEnriched GO biological Processes
ColorectumADGO analysis - Figure of enriched GO biological processes: Top 15 enriched GO BP terms are showed in the bar plot of each disease state in each tissue. Each row represents a significant GO biological process which is colored according to the -log10(p.adjust).
ColorectumSERGO analysis - Figure of enriched GO biological processes: Top 15 enriched GO BP terms are showed in the bar plot of each disease state in each tissue. Each row represents a significant GO biological process which is colored according to the -log10(p.adjust).
ColorectumMSSGO analysis - Figure of enriched GO biological processes: Top 15 enriched GO BP terms are showed in the bar plot of each disease state in each tissue. Each row represents a significant GO biological process which is colored according to the -log10(p.adjust).
ColorectumMSI-HGO analysis - Figure of enriched GO biological processes: Top 15 enriched GO BP terms are showed in the bar plot of each disease state in each tissue. Each row represents a significant GO biological process which is colored according to the -log10(p.adjust).
ColorectumFAPGO analysis - Figure of enriched GO biological processes: Top 15 enriched GO BP terms are showed in the bar plot of each disease state in each tissue. Each row represents a significant GO biological process which is colored according to the -log10(p.adjust).
∗Top 15 enriched GO BP terms are showed in the bar plot of each disease state in each tissue. Each row represents a significant GO biological process which is colored according to the -log10(p.adjust).
Page: 1 2 3 4 5 6 7 8 9 

check button Enriched GO biological processes.
GO IDTissueDisease StageDescriptionGene RatioBg Ratiopvaluep.adjustCount
GO:0010498111EsophagusESCCproteasomal protein catabolic process369/8552490/187231.13e-411.80e-38369
GO:0043161111EsophagusESCCproteasome-mediated ubiquitin-dependent protein catabolic process312/8552412/187233.53e-364.48e-33312
GO:000726510EsophagusESCCRas protein signal transduction201/8552337/187231.44e-072.30e-06201
GO:000726610EsophagusESCCRho protein signal transduction81/8552137/187231.03e-035.20e-0381
GO:00465789EsophagusESCCregulation of Ras protein signal transduction106/8552189/187232.49e-031.08e-02106
GO:00512592EsophagusESCCprotein complex oligomerization130/8552238/187233.29e-031.36e-02130
GO:005105610EsophagusESCCregulation of small GTPase mediated signal transduction157/8552302/187231.55e-024.98e-02157
GO:001049822LiverHCCproteasomal protein catabolic process351/7958490/187236.92e-401.46e-36351
GO:004316122LiverHCCproteasome-mediated ubiquitin-dependent protein catabolic process299/7958412/187237.82e-368.27e-33299
GO:000726521LiverHCCRas protein signal transduction187/7958337/187238.89e-071.35e-05187
GO:000726621LiverHCCRho protein signal transduction76/7958137/187231.46e-037.75e-0376
GO:004657811LiverHCCregulation of Ras protein signal transduction100/7958189/187232.42e-031.18e-02100
GO:00350242LiverHCCnegative regulation of Rho protein signal transduction16/795822/187234.03e-031.76e-0216
GO:001049820Oral cavityOSCCproteasomal protein catabolic process336/7305490/187235.45e-418.63e-38336
GO:004316120Oral cavityOSCCproteasome-mediated ubiquitin-dependent protein catabolic process285/7305412/187235.68e-365.99e-33285
GO:00072659Oral cavityOSCCRas protein signal transduction185/7305337/187231.95e-094.60e-08185
GO:00072669Oral cavityOSCCRho protein signal transduction76/7305137/187236.64e-055.37e-0476
GO:0051259Oral cavityOSCCprotein complex oligomerization121/7305238/187231.29e-049.21e-04121
GO:00350245Oral cavityOSCCnegative regulation of Rho protein signal transduction16/730522/187231.40e-036.79e-0316
GO:00465788Oral cavityOSCCregulation of Ras protein signal transduction90/7305189/187239.58e-033.40e-0290
Page: 1 2 

check button Enriched KEGG pathways.
Pathway IDTissueDisease StageDescriptionGene RatioBg Ratiopvaluep.adjustqvalueCount
Page: 1 

Top

Cell-cell communication analysis

check buttonIdentification of potential cell-cell interactions between two cell types and their ligand-receptor pairs for different disease states
LigandReceptorLRpairPathwayTissueDisease Stage
Page: 1 

Top

Single-cell gene regulatory network inference analysis

check buttonFind out the significant the regulons (TFs) and the target genes of each regulon across cell types for different disease states
TFCell TypeTissueDisease StageTarget GeneRSSRegulon Activity
∗The dot plots of a searched regulon are shown for all cell subpopulations in each disease state of each tissue based on the regulon specific score inferred using pySCENIC and by calculating the average expression.
Page: 1 

Top

Somatic mutation of malignant transformation related genes

check buttonAnnotation of somatic variants for genes involved in malignant transformation
Hugo SymbolVariant ClassVariant ClassificationdbSNP RSHGVScHGVSpHGVSp ShortSWISSPROTBIOTYPESIFTPolyPhenTumor Sample BarcodeTissueHistologySexAgeStageTherapy TypesDrugsOutcome
KCTD10SNVMissense_Mutationc.751N>Ap.Glu251Lysp.E251KQ9H3F6protein_codingdeleterious(0)probably_damaging(0.957)TCGA-AC-A3W6-01Breastbreast invasive carcinomaFemale>=65III/IVUnknownUnknownSD
KCTD10SNVMissense_Mutationrs369957720c.889N>Ap.Val297Metp.V297MQ9H3F6protein_codingdeleterious_low_confidence(0.04)probably_damaging(0.994)TCGA-AC-A3W7-01Breastbreast invasive carcinomaFemale>=65I/IIHormone TherapyfemaraSD
KCTD10SNVMissense_Mutationc.512N>Cp.Lys171Thrp.K171TQ9H3F6protein_codingtolerated(0.05)probably_damaging(0.986)TCGA-B6-A0WS-01Breastbreast invasive carcinomaFemale<65I/IIUnknownUnknownSD
KCTD10SNVMissense_Mutationc.727N>Ap.Glu243Lysp.E243KQ9H3F6protein_codingdeleterious(0)probably_damaging(0.947)TCGA-D8-A1JN-01Breastbreast invasive carcinomaFemale>=65III/IVHormone TherapyanastrozolumSD
KCTD10SNVMissense_Mutationc.374N>Gp.Gln125Argp.Q125RQ9H3F6protein_codingtolerated(0.07)benign(0.009)TCGA-D8-A1XK-01Breastbreast invasive carcinomaFemale<65I/IIChemotherapydoxorubicine+cyclophosphamideSD
KCTD10insertionIn_Frame_Insnovelc.489_490insACCTCGAACAAAAAGCAAATGAGAAGAAATCATCACp.Leu163_Leu164insThrSerAsnLysLysGlnMetArgArgAsnHisHisp.L163_L164insTSNKKQMRRNHHQ9H3F6protein_codingTCGA-AN-A041-01Breastbreast invasive carcinomaFemale<65I/IIUnknownUnknownSD
KCTD10SNVMissense_Mutationnovelc.195N>Ap.Met65Ilep.M65IQ9H3F6protein_codingtolerated(0.22)benign(0.145)TCGA-Q1-A5R2-01Cervixcervical & endocervical cancerFemale<65I/IIChemotherapycisplatinPR
KCTD10SNVMissense_Mutationc.706N>Ap.Glu236Lysp.E236KQ9H3F6protein_codingdeleterious(0)probably_damaging(0.928)TCGA-Q1-A73O-01Cervixcervical & endocervical cancerFemale<65I/IIChemotherapycisplatinCR
KCTD10SNVMissense_Mutationc.657G>Cp.Gln219Hisp.Q219HQ9H3F6protein_codingtolerated(0.54)benign(0.001)TCGA-VS-A8QH-01Cervixcervical & endocervical cancerFemale>=65I/IIChemotherapygemcitabinePD
KCTD10SNVMissense_Mutationrs200831911c.872N>Ap.Arg291Glnp.R291QQ9H3F6protein_codingtolerated_low_confidence(0.32)benign(0.262)TCGA-A6-2686-01Colorectumcolon adenocarcinomaFemale>=65I/IIUnknownUnknownSD
Page: 1 2 3 4 5 

Top

Related drugs of malignant transformation related genes

check buttonIdentification of chemicals and drugs interact with genes involved in malignant transfromation
(DGIdb 4.0)
Entrez IDSymbolCategoryInteraction TypesDrug Claim NameDrug NamePMIDs
Page: 1