
|
|||||
|
 | |
| |
| |
| |
| |
| |
|
Gene: KCNT2 |
Gene summary for KCNT2 |
| Gene information | Species | Human | Gene symbol | KCNT2 | Gene ID | 343450 |
| Gene name | potassium sodium-activated channel subfamily T member 2 | |
| Gene Alias | DEE57 | |
| Cytomap | 1q31.3 | |
| Gene Type | protein-coding | GO ID | GO:0006810 | UniProtAcc | Q6UVM3 |
Top |
Malignant transformation analysis |
| Identification of the aberrant gene expression in precancerous and cancerous lesions by comparing the gene expression of stem-like cells in diseased tissues with normal stem cells |
| Entrez ID | Symbol | Replicates | Species | Organ | Tissue | Adj P-value | Log2FC | Malignancy |
| 343450 | KCNT2 | NAFLD1 | Human | Liver | NAFLD | 8.49e-19 | 1.15e+00 | -0.04 |
| 343450 | KCNT2 | S41 | Human | Liver | Cirrhotic | 3.93e-05 | 6.02e-01 | -0.0343 |
| 343450 | KCNT2 | HCC1_Meng | Human | Liver | HCC | 5.82e-57 | -1.87e-01 | 0.0246 |
| 343450 | KCNT2 | HCC2_Meng | Human | Liver | HCC | 1.22e-08 | -3.36e-01 | 0.0107 |
| 343450 | KCNT2 | cirrhotic1 | Human | Liver | Cirrhotic | 2.20e-10 | -3.33e-01 | 0.0202 |
| 343450 | KCNT2 | cirrhotic2 | Human | Liver | Cirrhotic | 1.30e-08 | -3.26e-01 | 0.0201 |
| 343450 | KCNT2 | HCC1 | Human | Liver | HCC | 9.91e-07 | -1.48e-01 | 0.5336 |
| 343450 | KCNT2 | Pt13.a | Human | Liver | HCC | 1.85e-08 | -3.27e-01 | 0.021 |
| 343450 | KCNT2 | Pt14.d | Human | Liver | HCC | 3.67e-06 | -2.90e-01 | 0.0143 |
| 343450 | KCNT2 | S016 | Human | Liver | HCC | 1.56e-02 | -3.38e-01 | 0.2243 |
| 343450 | KCNT2 | S027 | Human | Liver | HCC | 2.52e-05 | 2.47e-01 | 0.2446 |
| 343450 | KCNT2 | S028 | Human | Liver | HCC | 1.89e-13 | 2.18e-01 | 0.2503 |
| 343450 | KCNT2 | S029 | Human | Liver | HCC | 2.82e-05 | 8.78e-02 | 0.2581 |
| 343450 | KCNT2 | HTA12-15-2 | Human | Pancreas | PDAC | 3.40e-10 | 7.20e-01 | 0.2315 |
| 343450 | KCNT2 | HTA12-23-1 | Human | Pancreas | PDAC | 7.37e-16 | 1.21e+00 | 0.3405 |
| 343450 | KCNT2 | HTA12-25-1 | Human | Pancreas | PDAC | 3.74e-18 | 1.23e+00 | 0.313 |
| 343450 | KCNT2 | HTA12-26-1 | Human | Pancreas | PDAC | 2.52e-36 | 1.47e+00 | 0.3728 |
| 343450 | KCNT2 | HTA12-29-1 | Human | Pancreas | PDAC | 1.41e-72 | 1.55e+00 | 0.3722 |
| 343450 | KCNT2 | HTA12-30-1 | Human | Pancreas | PDAC | 5.66e-08 | 1.45e+00 | 0.3671 |
| 343450 | KCNT2 | HTA12-32-1 | Human | Pancreas | PDAC | 4.23e-05 | 9.72e-01 | 0.3624 |
| Page: 1 2 |
| Tissue | Expression Dynamics | Abbreviation |
| Liver | 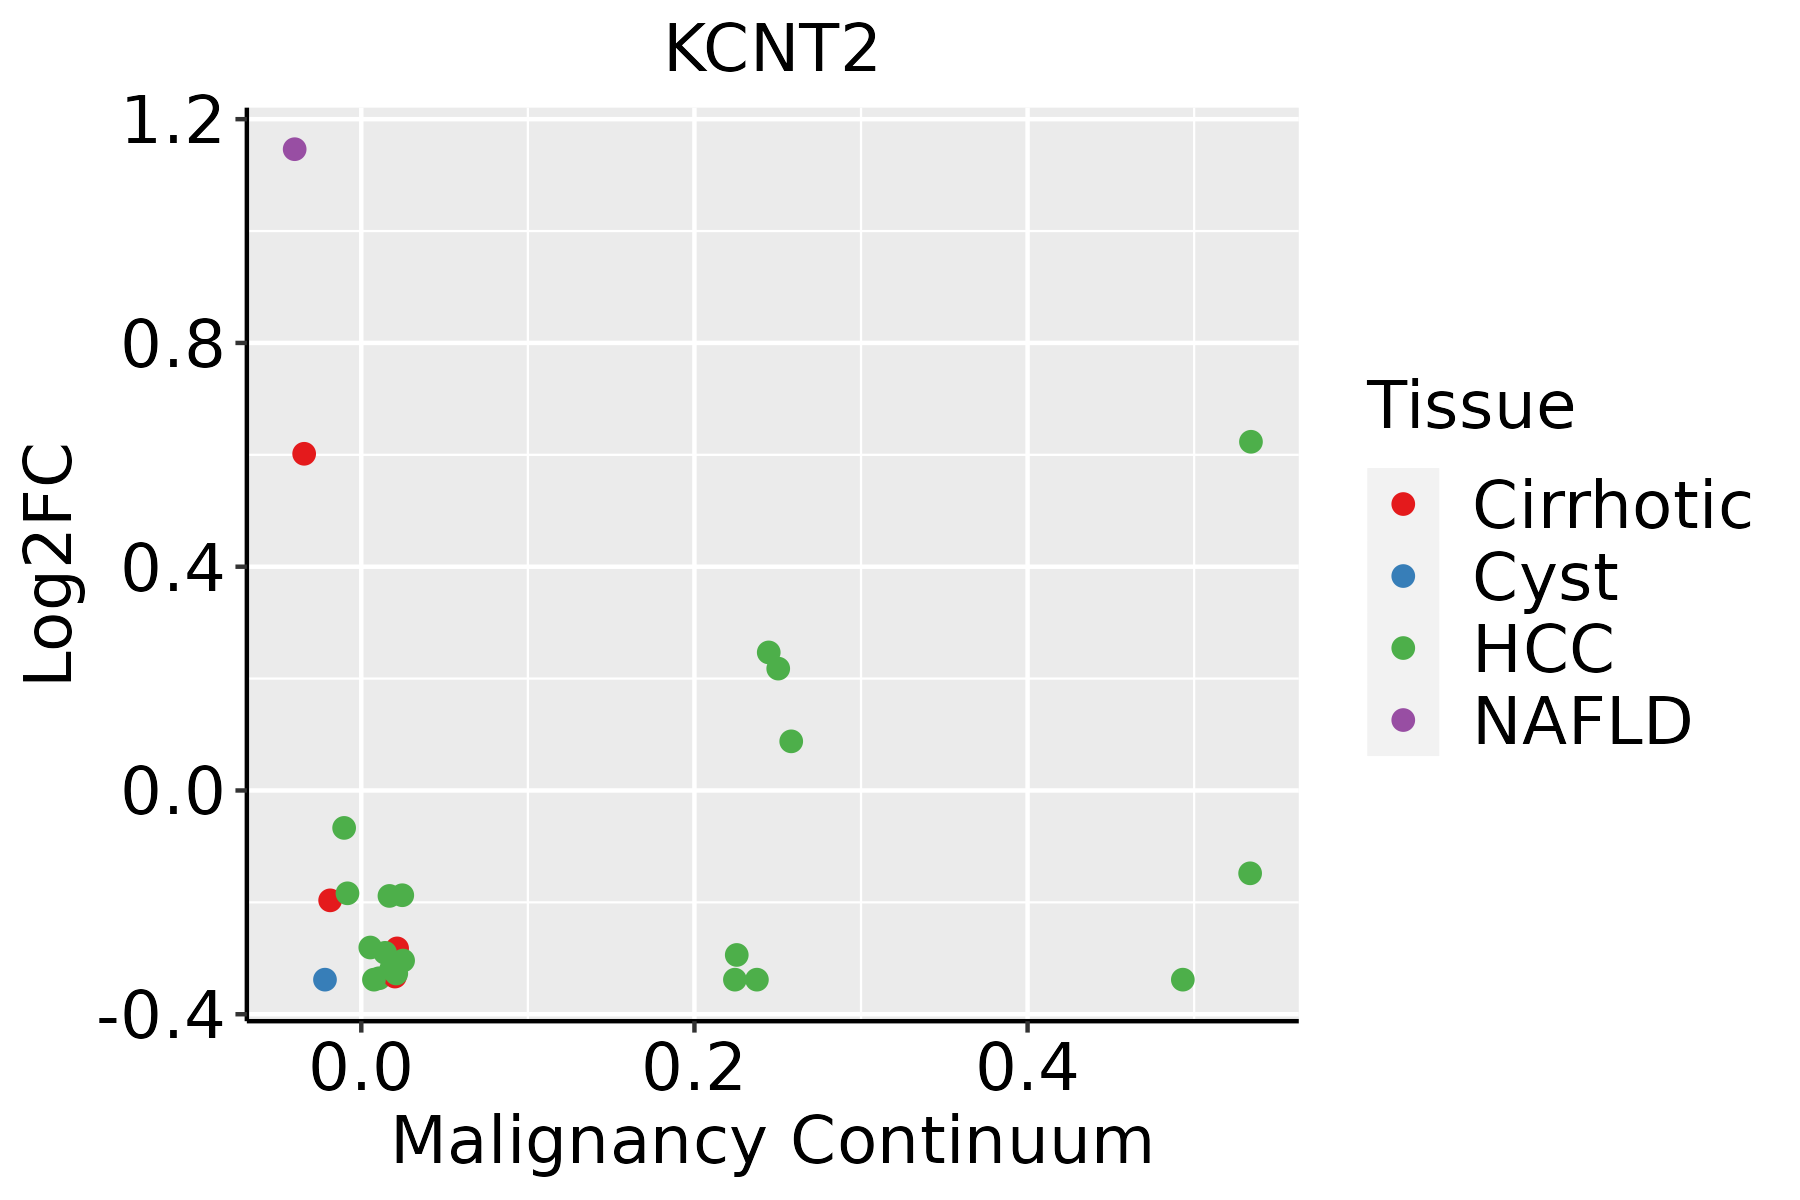 | HCC: Hepatocellular carcinoma |
| NAFLD: Non-alcoholic fatty liver disease |
| ∗log2FC in expression of this searched gene in stem-like cells from each diseased tissue sample relative to stem-like cells in normal samples in each tissue plotted against the malignancy continuum. Samples are colored based on if they are from different disease stage. |
Top |
Malignant transformation related pathway analysis |
| Find out the enriched GO biological processes and KEGG pathways involved in transition from healthy to precancer to cancer |
| Tissue | Disease Stage | Enriched GO biological Processes |
| Colorectum | AD |  |
| Colorectum | SER |  |
| Colorectum | MSS |  |
| Colorectum | MSI-H |  |
| Colorectum | FAP |  |
| ∗Top 15 enriched GO BP terms are showed in the bar plot of each disease state in each tissue. Each row represents a significant GO biological process which is colored according to the -log10(p.adjust). |
| Page: 1 2 3 4 5 6 7 8 9 |
| GO ID | Tissue | Disease Stage | Description | Gene Ratio | Bg Ratio | pvalue | p.adjust | Count |
| Page: 1 |
| Pathway ID | Tissue | Disease Stage | Description | Gene Ratio | Bg Ratio | pvalue | p.adjust | qvalue | Count |
| Page: 1 |
Top |
Cell-cell communication analysis |
| Identification of potential cell-cell interactions between two cell types and their ligand-receptor pairs for different disease states |
| Ligand | Receptor | LRpair | Pathway | Tissue | Disease Stage |
| Page: 1 |
Top |
Single-cell gene regulatory network inference analysis |
| Find out the significant the regulons (TFs) and the target genes of each regulon across cell types for different disease states |
| TF | Cell Type | Tissue | Disease Stage | Target Gene | RSS | Regulon Activity |
| ∗The dot plots of a searched regulon are shown for all cell subpopulations in each disease state of each tissue based on the regulon specific score inferred using pySCENIC and by calculating the average expression. |
| Page: 1 |
Top |
Somatic mutation of malignant transformation related genes |
| Annotation of somatic variants for genes involved in malignant transformation |
| Hugo Symbol | Variant Class | Variant Classification | dbSNP RS | HGVSc | HGVSp | HGVSp Short | SWISSPROT | BIOTYPE | SIFT | PolyPhen | Tumor Sample Barcode | Tissue | Histology | Sex | Age | Stage | Therapy Types | Drugs | Outcome |
| KCNT2 | SNV | Missense_Mutation | c.2434G>T | p.Asp812Tyr | p.D812Y | Q6UVM3 | protein_coding | deleterious(0) | probably_damaging(0.984) | TCGA-A1-A0SH-01 | Breast | breast invasive carcinoma | Female | <65 | I/II | Chemotherapy | tc | SD | |
| KCNT2 | SNV | Missense_Mutation | novel | c.1353N>G | p.Cys451Trp | p.C451W | Q6UVM3 | protein_coding | deleterious(0) | probably_damaging(0.993) | TCGA-A7-A4SB-01 | Breast | breast invasive carcinoma | Female | <65 | III/IV | Chemotherapy | docetaxel | CR |
| KCNT2 | SNV | Missense_Mutation | c.2602N>T | p.Arg868Trp | p.R868W | Q6UVM3 | protein_coding | deleterious(0) | possibly_damaging(0.51) | TCGA-A8-A07Z-01 | Breast | breast invasive carcinoma | Female | >=65 | I/II | Unspecific | Exemestane | SD | |
| KCNT2 | SNV | Missense_Mutation | c.1504N>A | p.Glu502Lys | p.E502K | Q6UVM3 | protein_coding | tolerated(0.05) | possibly_damaging(0.685) | TCGA-A8-A08T-01 | Breast | breast invasive carcinoma | Female | <65 | III/IV | Unknown | Unknown | PD | |
| KCNT2 | SNV | Missense_Mutation | c.1115G>A | p.Arg372Lys | p.R372K | Q6UVM3 | protein_coding | deleterious(0) | probably_damaging(0.992) | TCGA-AC-A23C-01 | Breast | breast invasive carcinoma | Female | <65 | I/II | Chemotherapy | chemo | CR | |
| KCNT2 | SNV | Missense_Mutation | rs367968673 | c.410N>A | p.Arg137Gln | p.R137Q | Q6UVM3 | protein_coding | tolerated(0.34) | benign(0.006) | TCGA-AN-A0AK-01 | Breast | breast invasive carcinoma | Female | >=65 | I/II | Unknown | Unknown | SD |
| KCNT2 | SNV | Missense_Mutation | novel | c.2024N>T | p.Ser675Phe | p.S675F | Q6UVM3 | protein_coding | deleterious(0.03) | possibly_damaging(0.56) | TCGA-AR-A2LE-01 | Breast | breast invasive carcinoma | Female | >=65 | I/II | Hormone Therapy | tamoxiphen | PD |
| KCNT2 | SNV | Missense_Mutation | c.2288A>G | p.His763Arg | p.H763R | Q6UVM3 | protein_coding | tolerated(0.45) | benign(0.005) | TCGA-B6-A0RS-01 | Breast | breast invasive carcinoma | Female | <65 | I/II | Unknown | Unknown | PD | |
| KCNT2 | SNV | Missense_Mutation | c.2000A>G | p.Tyr667Cys | p.Y667C | Q6UVM3 | protein_coding | deleterious(0.04) | benign(0.013) | TCGA-BH-A0BD-01 | Breast | breast invasive carcinoma | Female | <65 | I/II | Chemotherapy | doxorubicin | SD | |
| KCNT2 | SNV | Missense_Mutation | c.1709G>C | p.Arg570Thr | p.R570T | Q6UVM3 | protein_coding | tolerated(0.17) | benign(0.001) | TCGA-D8-A1J8-01 | Breast | breast invasive carcinoma | Female | >=65 | I/II | Hormone Therapy | nolvadex | SD |
| Page: 1 2 3 4 5 6 7 8 9 10 11 12 13 14 15 16 17 18 19 20 21 22 23 24 25 |
Top |
Related drugs of malignant transformation related genes |
| Identification of chemicals and drugs interact with genes involved in malignant transfromation |
| (DGIdb 4.0) |
| Entrez ID | Symbol | Category | Interaction Types | Drug Claim Name | Drug Name | PMIDs |
| 343450 | KCNT2 | ION CHANNEL, DRUGGABLE GENOME | blocker | 135651249 | ||
| 343450 | KCNT2 | ION CHANNEL, DRUGGABLE GENOME | activator | 135650269 | ||
| 343450 | KCNT2 | ION CHANNEL, DRUGGABLE GENOME | blocker | 53801073 | CLOFILIUM | |
| 343450 | KCNT2 | ION CHANNEL, DRUGGABLE GENOME | inhibitor | 135650820 | ||
| 343450 | KCNT2 | ION CHANNEL, DRUGGABLE GENOME | phorbol 12-myristate 13-acetate | |||
| 343450 | KCNT2 | ION CHANNEL, DRUGGABLE GENOME | Bisphosphonates | |||
| 343450 | KCNT2 | ION CHANNEL, DRUGGABLE GENOME | blocker | 135652729 | ||
| 343450 | KCNT2 | ION CHANNEL, DRUGGABLE GENOME | activator | 135650716 |
| Page: 1 |

Copyright 2023-Present -The University of Texas Health Science Center at Houston |