
|
|||||
|
 | |
| |
| |
| |
| |
| |
|
Gene: KCNS3 |
Gene summary for KCNS3 |
| Gene information | Species | Human | Gene symbol | KCNS3 | Gene ID | 3790 |
| Gene name | potassium voltage-gated channel modifier subfamily S member 3 | |
| Gene Alias | KV9.3 | |
| Cytomap | 2p24.2 | |
| Gene Type | protein-coding | GO ID | GO:0006810 | UniProtAcc | Q9BQ31 |
Top |
Malignant transformation analysis |
| Identification of the aberrant gene expression in precancerous and cancerous lesions by comparing the gene expression of stem-like cells in diseased tissues with normal stem cells |
| Entrez ID | Symbol | Replicates | Species | Organ | Tissue | Adj P-value | Log2FC | Malignancy |
| 3790 | KCNS3 | LZE2D | Human | Esophagus | HGIN | 2.73e-03 | 4.64e-01 | 0.0642 |
| 3790 | KCNS3 | LZE7T | Human | Esophagus | ESCC | 3.51e-03 | 1.42e-01 | 0.0667 |
| 3790 | KCNS3 | LZE20T | Human | Esophagus | ESCC | 9.63e-04 | 1.79e-01 | 0.0662 |
| 3790 | KCNS3 | LZE22T | Human | Esophagus | ESCC | 2.62e-04 | 6.24e-01 | 0.068 |
| 3790 | KCNS3 | LZE24T | Human | Esophagus | ESCC | 3.70e-33 | 1.02e+00 | 0.0596 |
| 3790 | KCNS3 | P1T-E | Human | Esophagus | ESCC | 1.40e-14 | 7.42e-01 | 0.0875 |
| 3790 | KCNS3 | P2T-E | Human | Esophagus | ESCC | 3.26e-16 | 3.77e-01 | 0.1177 |
| 3790 | KCNS3 | P4T-E | Human | Esophagus | ESCC | 2.51e-16 | 4.88e-01 | 0.1323 |
| 3790 | KCNS3 | P5T-E | Human | Esophagus | ESCC | 4.19e-23 | 4.06e-01 | 0.1327 |
| 3790 | KCNS3 | P8T-E | Human | Esophagus | ESCC | 2.01e-21 | 4.07e-01 | 0.0889 |
| 3790 | KCNS3 | P9T-E | Human | Esophagus | ESCC | 9.46e-27 | 5.60e-01 | 0.1131 |
| 3790 | KCNS3 | P10T-E | Human | Esophagus | ESCC | 1.37e-19 | 2.66e-01 | 0.116 |
| 3790 | KCNS3 | P11T-E | Human | Esophagus | ESCC | 4.97e-19 | 7.84e-01 | 0.1426 |
| 3790 | KCNS3 | P12T-E | Human | Esophagus | ESCC | 4.03e-27 | 5.32e-01 | 0.1122 |
| 3790 | KCNS3 | P15T-E | Human | Esophagus | ESCC | 3.71e-09 | 2.80e-01 | 0.1149 |
| 3790 | KCNS3 | P16T-E | Human | Esophagus | ESCC | 5.19e-19 | 3.88e-01 | 0.1153 |
| 3790 | KCNS3 | P17T-E | Human | Esophagus | ESCC | 1.88e-05 | 3.84e-01 | 0.1278 |
| 3790 | KCNS3 | P19T-E | Human | Esophagus | ESCC | 1.29e-13 | 1.43e+00 | 0.1662 |
| 3790 | KCNS3 | P20T-E | Human | Esophagus | ESCC | 3.79e-50 | 1.07e+00 | 0.1124 |
| 3790 | KCNS3 | P21T-E | Human | Esophagus | ESCC | 1.49e-23 | 3.86e-01 | 0.1617 |
| Page: 1 2 3 4 |
| Tissue | Expression Dynamics | Abbreviation |
| Esophagus |  | ESCC: Esophageal squamous cell carcinoma |
| HGIN: High-grade intraepithelial neoplasias | ||
| LGIN: Low-grade intraepithelial neoplasias | ||
| Oral Cavity | 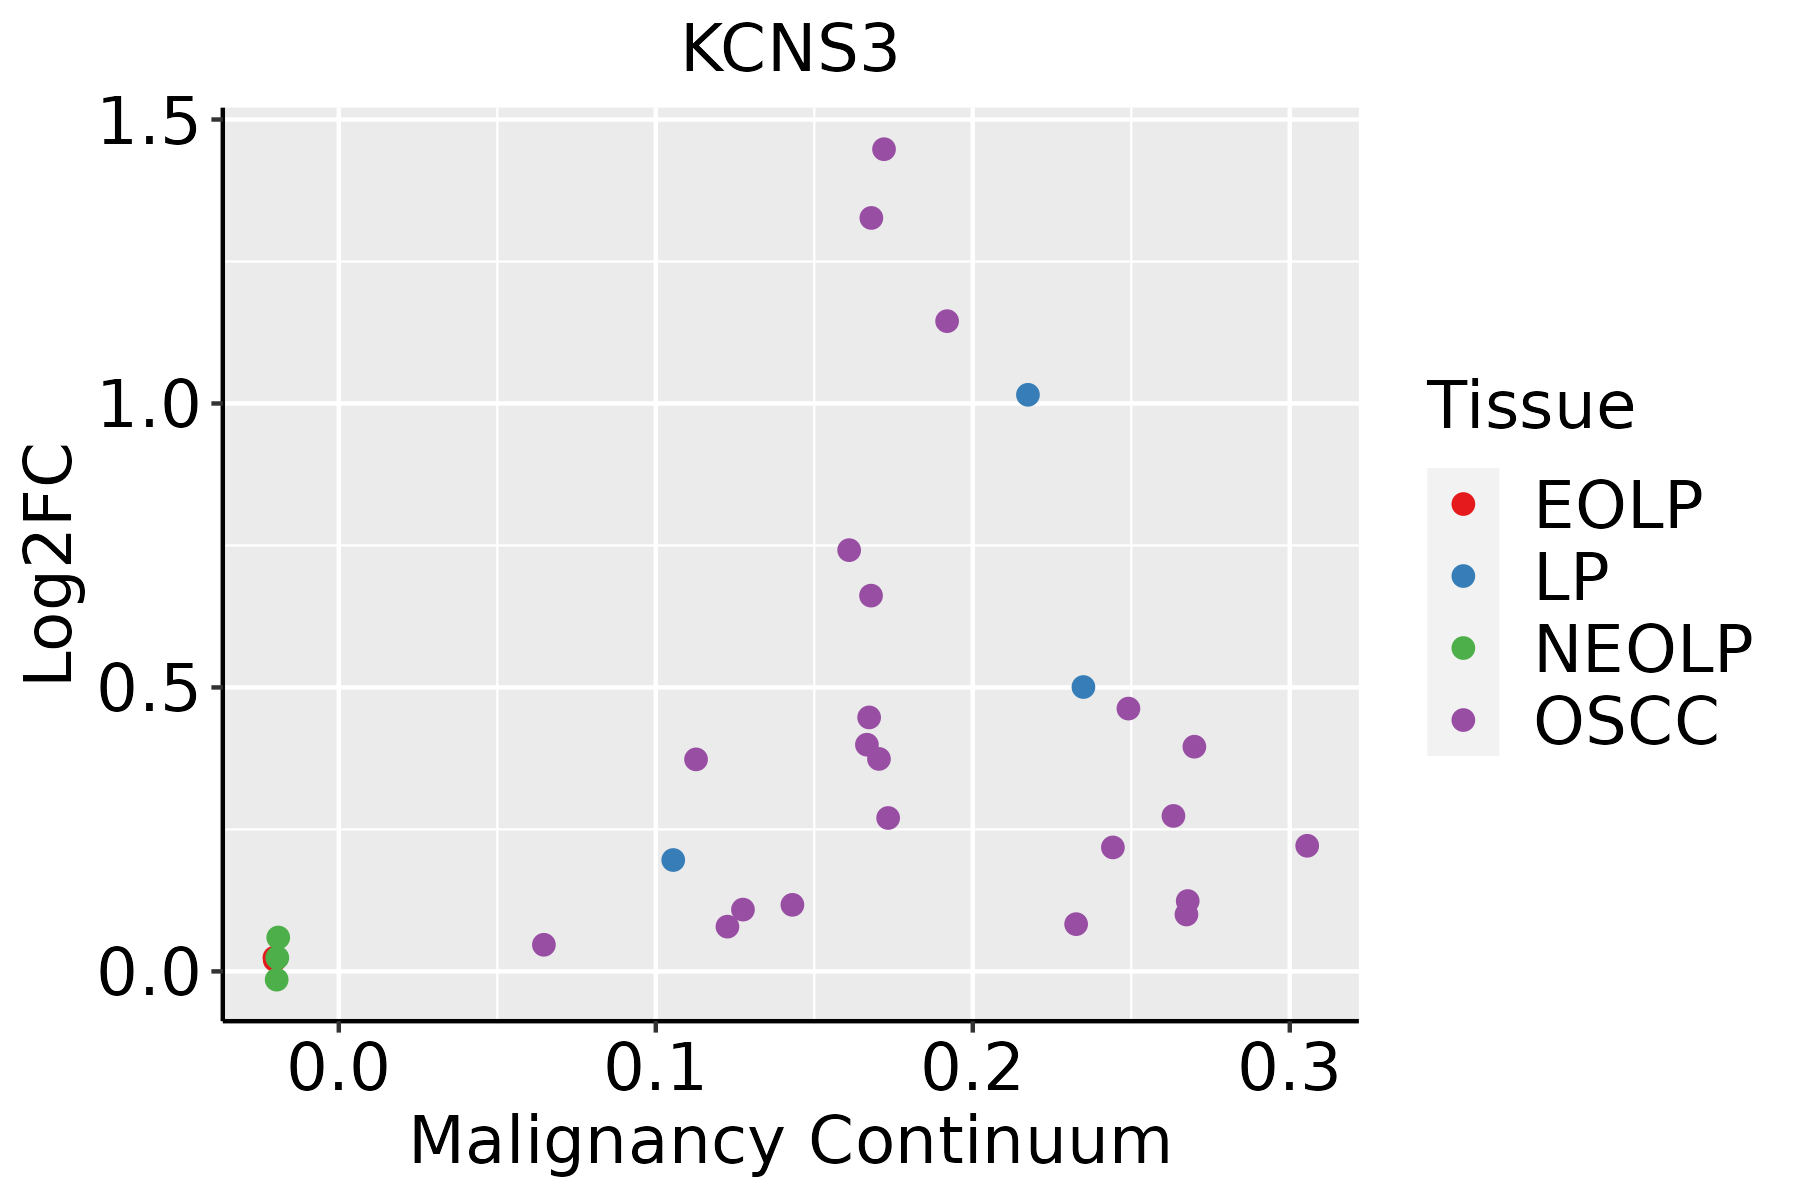 | EOLP: Erosive Oral lichen planus |
| LP: leukoplakia | ||
| NEOLP: Non-erosive oral lichen planus | ||
| OSCC: Oral squamous cell carcinoma |
| ∗log2FC in expression of this searched gene in stem-like cells from each diseased tissue sample relative to stem-like cells in normal samples in each tissue plotted against the malignancy continuum. Samples are colored based on if they are from different disease stage. |
Top |
Malignant transformation related pathway analysis |
| Find out the enriched GO biological processes and KEGG pathways involved in transition from healthy to precancer to cancer |
| Tissue | Disease Stage | Enriched GO biological Processes |
| Colorectum | AD |  |
| Colorectum | SER |  |
| Colorectum | MSS |  |
| Colorectum | MSI-H |  |
| Colorectum | FAP |  |
| ∗Top 15 enriched GO BP terms are showed in the bar plot of each disease state in each tissue. Each row represents a significant GO biological process which is colored according to the -log10(p.adjust). |
| Page: 1 2 3 4 5 6 7 8 9 |
| GO ID | Tissue | Disease Stage | Description | Gene Ratio | Bg Ratio | pvalue | p.adjust | Count |
| GO:00512592 | Esophagus | ESCC | protein complex oligomerization | 130/8552 | 238/18723 | 3.29e-03 | 1.36e-02 | 130 |
| GO:0051259 | Oral cavity | OSCC | protein complex oligomerization | 121/7305 | 238/18723 | 1.29e-04 | 9.21e-04 | 121 |
| GO:00512591 | Oral cavity | LP | protein complex oligomerization | 85/4623 | 238/18723 | 8.81e-05 | 1.11e-03 | 85 |
| Page: 1 |
| Pathway ID | Tissue | Disease Stage | Description | Gene Ratio | Bg Ratio | pvalue | p.adjust | qvalue | Count |
| Page: 1 |
Top |
Cell-cell communication analysis |
| Identification of potential cell-cell interactions between two cell types and their ligand-receptor pairs for different disease states |
| Ligand | Receptor | LRpair | Pathway | Tissue | Disease Stage |
| Page: 1 |
Top |
Single-cell gene regulatory network inference analysis |
| Find out the significant the regulons (TFs) and the target genes of each regulon across cell types for different disease states |
| TF | Cell Type | Tissue | Disease Stage | Target Gene | RSS | Regulon Activity |
| ∗The dot plots of a searched regulon are shown for all cell subpopulations in each disease state of each tissue based on the regulon specific score inferred using pySCENIC and by calculating the average expression. |
| Page: 1 |
Top |
Somatic mutation of malignant transformation related genes |
| Annotation of somatic variants for genes involved in malignant transformation |
| Hugo Symbol | Variant Class | Variant Classification | dbSNP RS | HGVSc | HGVSp | HGVSp Short | SWISSPROT | BIOTYPE | SIFT | PolyPhen | Tumor Sample Barcode | Tissue | Histology | Sex | Age | Stage | Therapy Types | Drugs | Outcome |
| KCNS3 | SNV | Missense_Mutation | c.88N>G | p.Gln30Glu | p.Q30E | Q9BQ31 | protein_coding | tolerated(0.31) | benign(0.285) | TCGA-AC-A23C-01 | Breast | breast invasive carcinoma | Female | <65 | I/II | Chemotherapy | chemo | CR | |
| KCNS3 | SNV | Missense_Mutation | rs777273178 | c.371G>A | p.Arg124His | p.R124H | Q9BQ31 | protein_coding | deleterious(0.01) | benign(0) | TCGA-E2-A14P-01 | Breast | breast invasive carcinoma | Female | >=65 | III/IV | Targeted Molecular therapy | trastuzumab | SD |
| KCNS3 | SNV | Missense_Mutation | c.610N>T | p.Val204Phe | p.V204F | Q9BQ31 | protein_coding | tolerated(0.07) | benign(0.224) | TCGA-OL-A5D8-01 | Breast | breast invasive carcinoma | Female | <65 | I/II | Unknown | Unknown | SD | |
| KCNS3 | insertion | Nonsense_Mutation | novel | c.1408_1409insATTAGAATGGAGAATCCAGCGTA | p.Ala470AspfsTer2 | p.A470Dfs*2 | Q9BQ31 | protein_coding | TCGA-A8-A08X-01 | Breast | breast invasive carcinoma | Female | <65 | III/IV | Chemotherapy | doxorubicin | PD | ||
| KCNS3 | insertion | In_Frame_Ins | novel | c.156_157insCTG | p.Ala52_Ile53insLeu | p.A52_I53insL | Q9BQ31 | protein_coding | TCGA-BH-A0B8-01 | Breast | breast invasive carcinoma | Female | <65 | I/II | Hormone Therapy | arimidex | SD | ||
| KCNS3 | insertion | Nonsense_Mutation | novel | c.157_158insTAGTGCAATTACCATAAAGAGGTTTTCCCAAGTCAGG | p.Leu54ValfsTer5 | p.L54Vfs*5 | Q9BQ31 | protein_coding | TCGA-BH-A0B8-01 | Breast | breast invasive carcinoma | Female | <65 | I/II | Hormone Therapy | arimidex | SD | ||
| KCNS3 | SNV | Missense_Mutation | rs556337820 | c.920C>T | p.Ser307Leu | p.S307L | Q9BQ31 | protein_coding | deleterious(0) | probably_damaging(0.997) | TCGA-2W-A8YY-01 | Cervix | cervical & endocervical cancer | Female | <65 | I/II | Chemotherapy | cisplatin | CR |
| KCNS3 | SNV | Missense_Mutation | c.358C>T | p.Arg120Cys | p.R120C | Q9BQ31 | protein_coding | deleterious(0) | possibly_damaging(0.548) | TCGA-C5-A7CK-01 | Cervix | cervical & endocervical cancer | Female | <65 | I/II | Chemotherapy | cisplatin | SD | |
| KCNS3 | SNV | Missense_Mutation | c.1127N>A | p.Thr376Asn | p.T376N | Q9BQ31 | protein_coding | deleterious(0.01) | probably_damaging(0.961) | TCGA-DG-A2KK-01 | Cervix | cervical & endocervical cancer | Female | <65 | III/IV | Chemotherapy | cisplatin | SD | |
| KCNS3 | SNV | Missense_Mutation | rs780182339 | c.703G>A | p.Gly235Arg | p.G235R | Q9BQ31 | protein_coding | tolerated(0.08) | benign(0.259) | TCGA-JW-A69B-01 | Cervix | cervical & endocervical cancer | Female | <65 | I/II | Unknown | Unknown | SD |
| Page: 1 2 3 4 5 6 7 8 9 |
Top |
Related drugs of malignant transformation related genes |
| Identification of chemicals and drugs interact with genes involved in malignant transfromation |
| (DGIdb 4.0) |
| Entrez ID | Symbol | Category | Interaction Types | Drug Claim Name | Drug Name | PMIDs |
| 3790 | KCNS3 | ION CHANNEL, DRUGGABLE GENOME | blocker | CHEMBL1200728 | GUANIDINE HYDROCHLORIDE | |
| 3790 | KCNS3 | ION CHANNEL, DRUGGABLE GENOME | blocker | CHEMBL284348 | DALFAMPRIDINE | |
| 3790 | KCNS3 | ION CHANNEL, DRUGGABLE GENOME | blocker | CHEMBL113461 | TEDISAMIL | |
| 3790 | KCNS3 | ION CHANNEL, DRUGGABLE GENOME | blocker | CHEMBL2107762 | NERISPIRDINE |
| Page: 1 |

Copyright 2023-Present -The University of Texas Health Science Center at Houston |