
|
|||||
|
 | |
| |
| |
| |
| |
| |
|
Gene: KCNQ1 |
Gene summary for KCNQ1 |
| Gene information | Species | Human | Gene symbol | KCNQ1 | Gene ID | 3784 |
| Gene name | potassium voltage-gated channel subfamily Q member 1 | |
| Gene Alias | ATFB1 | |
| Cytomap | 11p15.5-p15.4 | |
| Gene Type | protein-coding | GO ID | GO:0001508 | UniProtAcc | P51787 |
Top |
Malignant transformation analysis |
| Identification of the aberrant gene expression in precancerous and cancerous lesions by comparing the gene expression of stem-like cells in diseased tissues with normal stem cells |
| Entrez ID | Symbol | Replicates | Species | Organ | Tissue | Adj P-value | Log2FC | Malignancy |
| 3784 | KCNQ1 | HTA11_3410_2000001011 | Human | Colorectum | AD | 7.19e-08 | -2.59e-01 | 0.0155 |
| 3784 | KCNQ1 | HTA11_2112_2000001011 | Human | Colorectum | SER | 6.76e-03 | -3.10e-01 | -0.2196 |
| 3784 | KCNQ1 | HTA11_1391_2000001011 | Human | Colorectum | AD | 1.33e-03 | 6.24e-01 | -0.059 |
| 3784 | KCNQ1 | HTA11_5212_2000001011 | Human | Colorectum | AD | 2.42e-02 | -5.62e-01 | -0.2061 |
| 3784 | KCNQ1 | HTA11_7696_3000711011 | Human | Colorectum | AD | 9.39e-04 | 5.37e-01 | 0.0674 |
| 3784 | KCNQ1 | HTA11_6818_2000001011 | Human | Colorectum | AD | 1.93e-02 | 4.81e-01 | 0.0112 |
| 3784 | KCNQ1 | HTA11_99999965062_69753 | Human | Colorectum | MSI-H | 4.22e-04 | 9.63e-01 | 0.3487 |
| 3784 | KCNQ1 | HTA11_99999971662_82457 | Human | Colorectum | MSS | 5.76e-24 | 1.29e+00 | 0.3859 |
| 3784 | KCNQ1 | F007 | Human | Colorectum | FAP | 1.10e-03 | -1.49e-02 | 0.1176 |
| 3784 | KCNQ1 | A001-C-207 | Human | Colorectum | FAP | 2.89e-04 | 4.26e-02 | 0.1278 |
| 3784 | KCNQ1 | A015-C-203 | Human | Colorectum | FAP | 1.37e-33 | -4.71e-01 | -0.1294 |
| 3784 | KCNQ1 | A015-C-204 | Human | Colorectum | FAP | 5.44e-08 | -2.71e-01 | -0.0228 |
| 3784 | KCNQ1 | A014-C-040 | Human | Colorectum | FAP | 6.96e-04 | -1.08e-01 | -0.1184 |
| 3784 | KCNQ1 | A002-C-201 | Human | Colorectum | FAP | 3.27e-12 | -5.05e-02 | 0.0324 |
| 3784 | KCNQ1 | A002-C-203 | Human | Colorectum | FAP | 9.07e-04 | 1.10e-01 | 0.2786 |
| 3784 | KCNQ1 | A001-C-119 | Human | Colorectum | FAP | 5.52e-09 | -3.43e-01 | -0.1557 |
| 3784 | KCNQ1 | A001-C-108 | Human | Colorectum | FAP | 8.30e-18 | -1.08e-03 | -0.0272 |
| 3784 | KCNQ1 | A002-C-205 | Human | Colorectum | FAP | 2.08e-29 | -3.69e-01 | -0.1236 |
| 3784 | KCNQ1 | A001-C-104 | Human | Colorectum | FAP | 4.78e-03 | 6.07e-02 | 0.0184 |
| 3784 | KCNQ1 | A015-C-005 | Human | Colorectum | FAP | 1.32e-02 | 4.87e-02 | -0.0336 |
| Page: 1 2 3 |
| Tissue | Expression Dynamics | Abbreviation |
| Colorectum (GSE201348) | 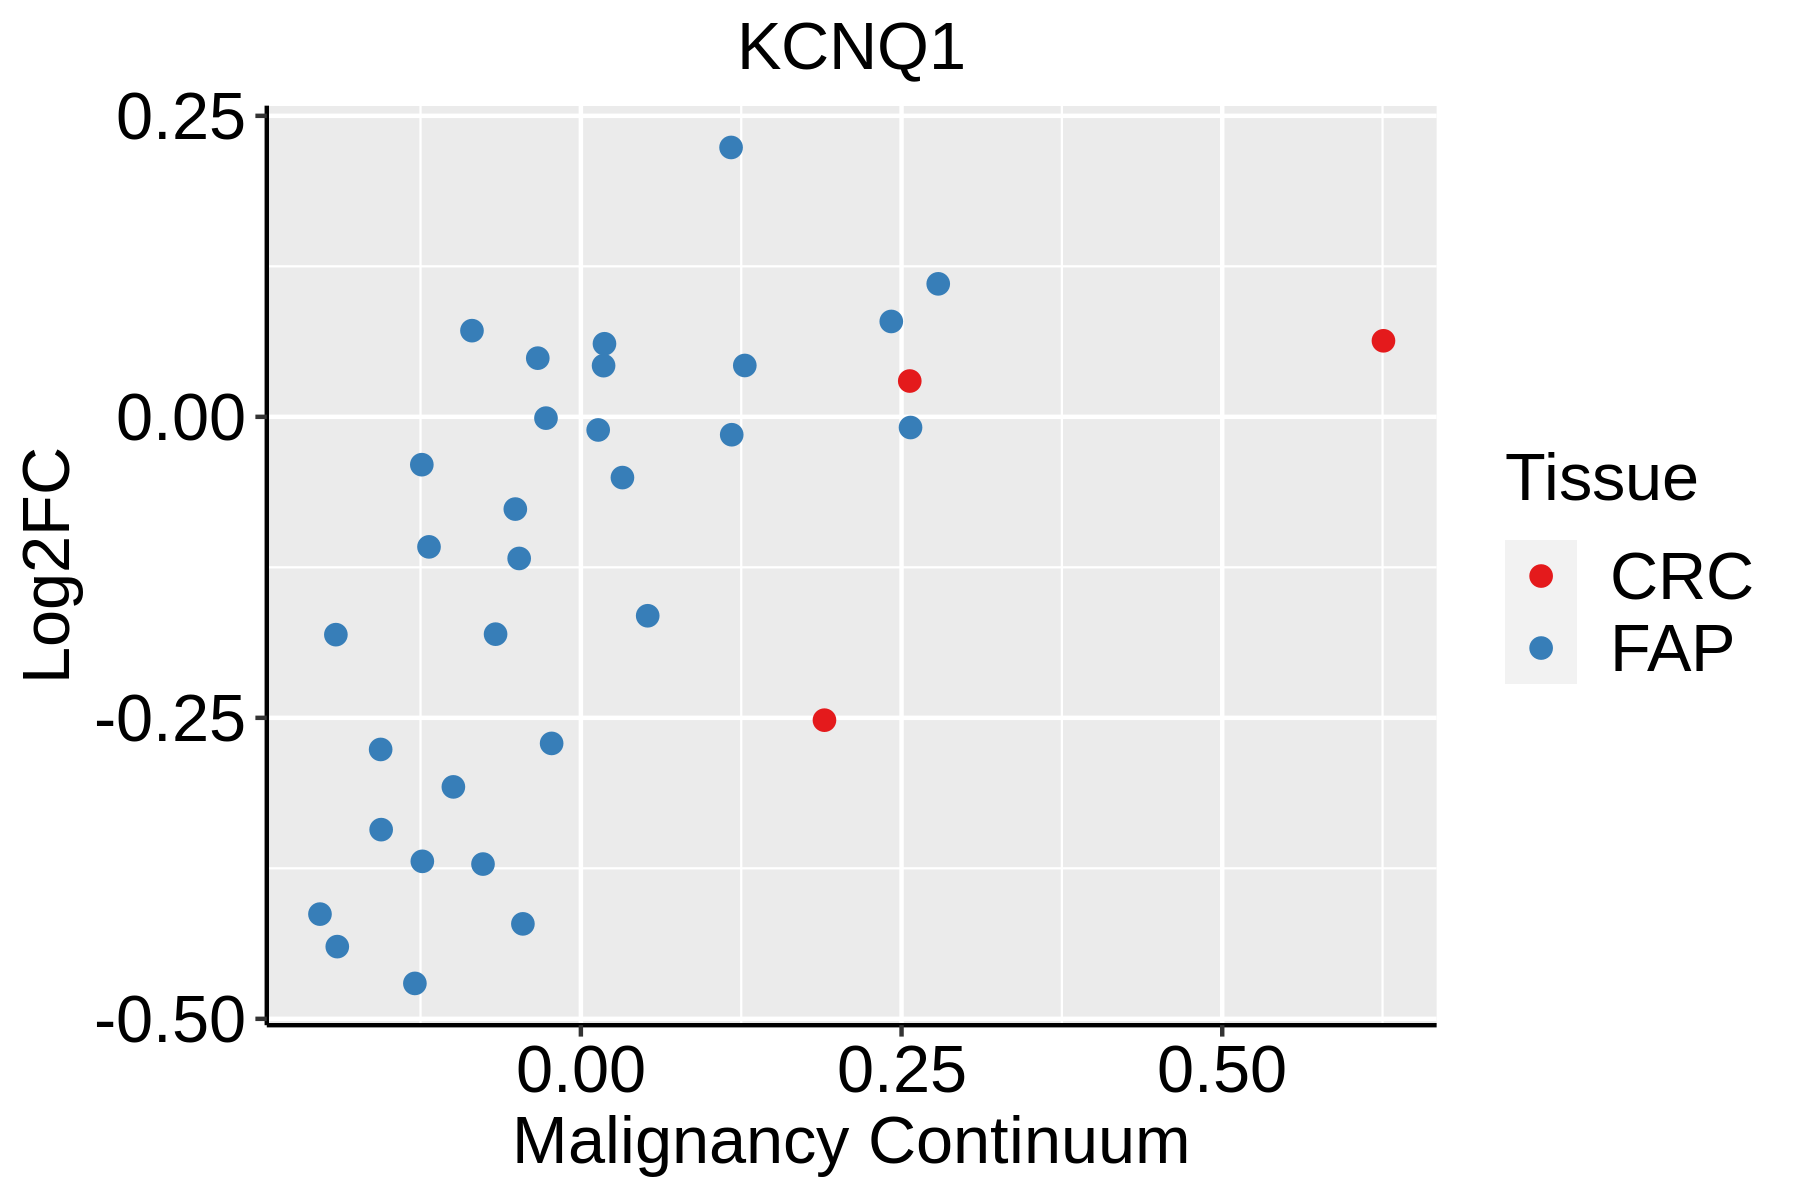 | FAP: Familial adenomatous polyposis |
| CRC: Colorectal cancer | ||
| Colorectum (HTA11) |  | AD: Adenomas |
| SER: Sessile serrated lesions | ||
| MSI-H: Microsatellite-high colorectal cancer | ||
| MSS: Microsatellite stable colorectal cancer | ||
| Lung |  | AAH: Atypical adenomatous hyperplasia |
| AIS: Adenocarcinoma in situ | ||
| IAC: Invasive lung adenocarcinoma | ||
| MIA: Minimally invasive adenocarcinoma | ||
| Thyroid | 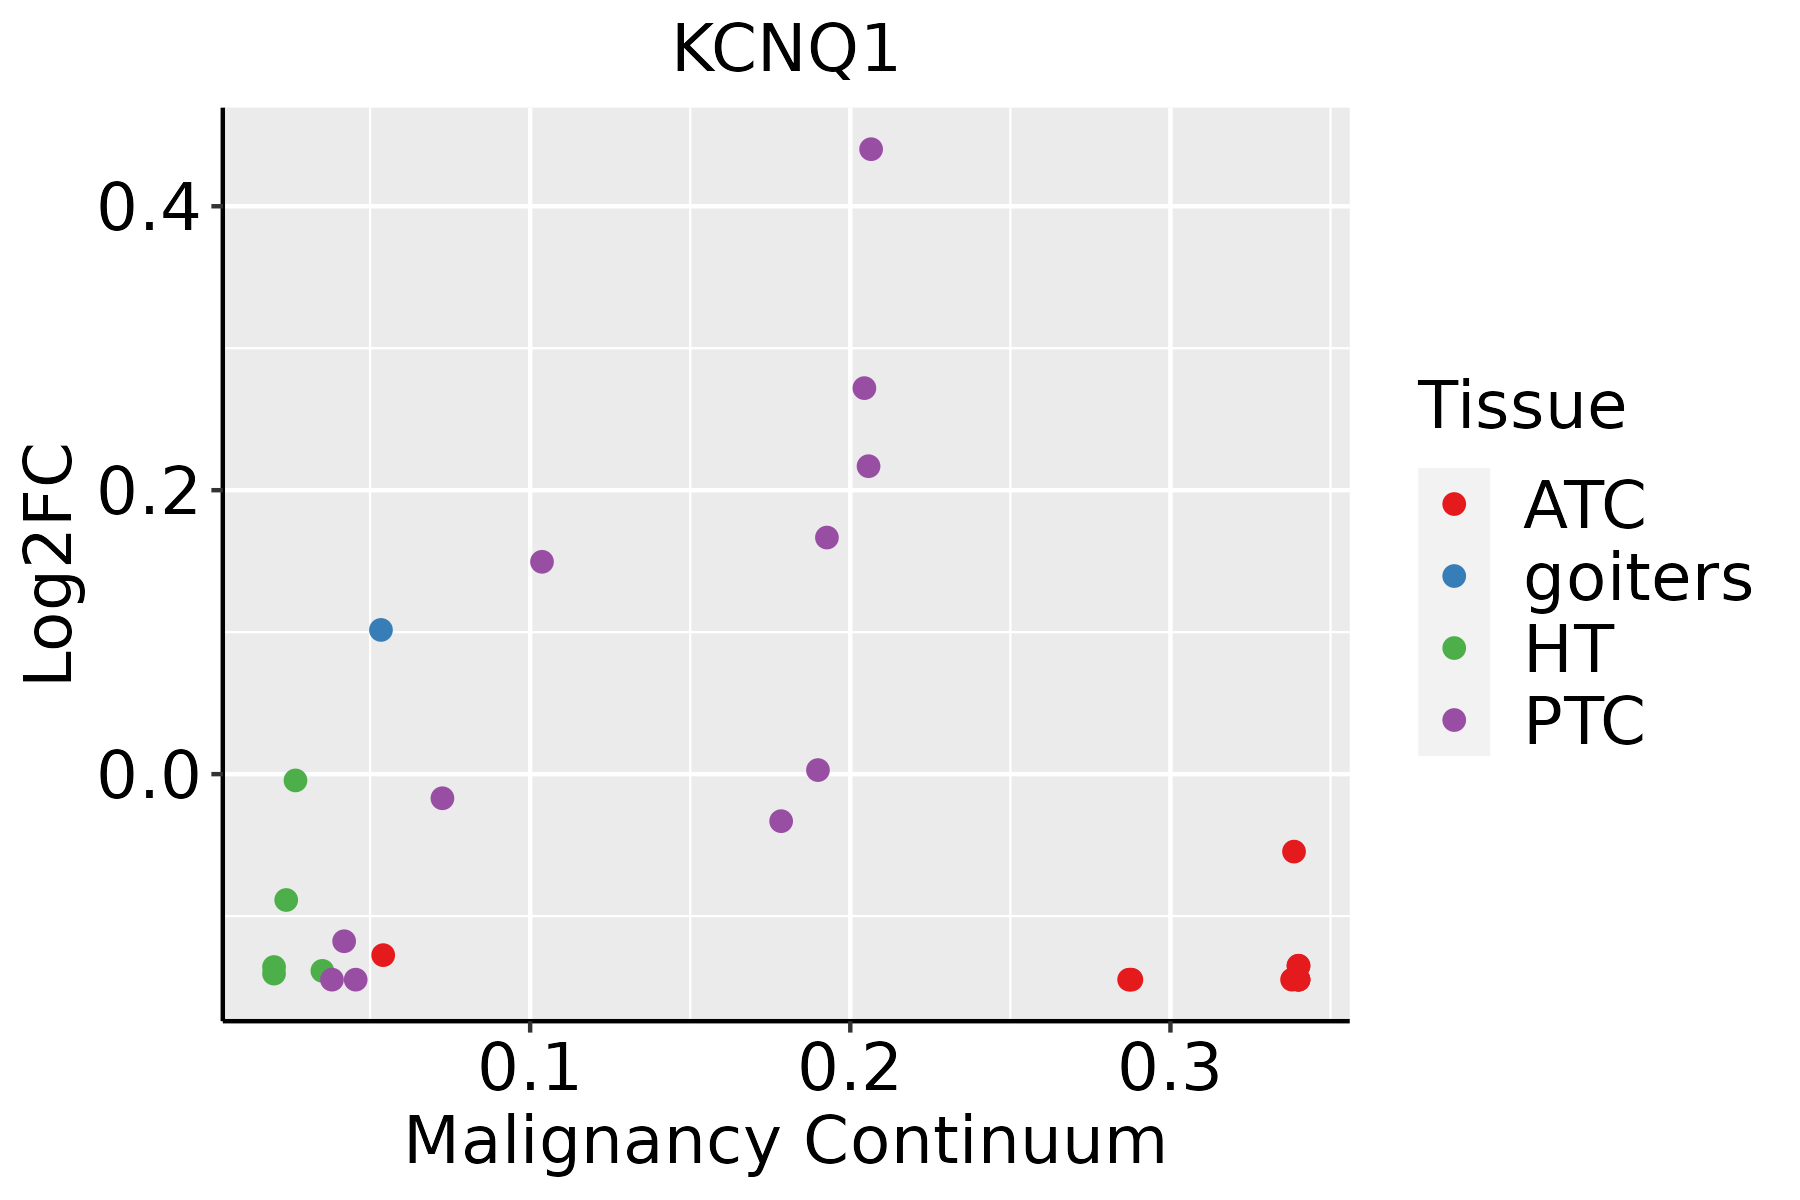 | ATC: Anaplastic thyroid cancer |
| HT: Hashimoto's thyroiditis | ||
| PTC: Papillary thyroid cancer |
| ∗log2FC in expression of this searched gene in stem-like cells from each diseased tissue sample relative to stem-like cells in normal samples in each tissue plotted against the malignancy continuum. Samples are colored based on if they are from different disease stage. |
Top |
Malignant transformation related pathway analysis |
| Find out the enriched GO biological processes and KEGG pathways involved in transition from healthy to precancer to cancer |
| Tissue | Disease Stage | Enriched GO biological Processes |
| Colorectum | AD |  |
| Colorectum | SER |  |
| Colorectum | MSS |  |
| Colorectum | MSI-H |  |
| Colorectum | FAP |  |
| ∗Top 15 enriched GO BP terms are showed in the bar plot of each disease state in each tissue. Each row represents a significant GO biological process which is colored according to the -log10(p.adjust). |
| Page: 1 2 3 4 5 6 7 8 9 |
| GO ID | Tissue | Disease Stage | Description | Gene Ratio | Bg Ratio | pvalue | p.adjust | Count |
| GO:00064018 | Breast | Precancer | RNA catabolic process | 34/1080 | 278/18723 | 2.88e-05 | 6.39e-04 | 34 |
| GO:00346558 | Breast | Precancer | nucleobase-containing compound catabolic process | 42/1080 | 407/18723 | 1.91e-04 | 3.06e-03 | 42 |
| GO:00098969 | Breast | Precancer | positive regulation of catabolic process | 48/1080 | 492/18723 | 2.62e-04 | 3.84e-03 | 48 |
| GO:00313319 | Breast | Precancer | positive regulation of cellular catabolic process | 43/1080 | 427/18723 | 2.75e-04 | 4.00e-03 | 43 |
| GO:00467007 | Breast | Precancer | heterocycle catabolic process | 44/1080 | 445/18723 | 3.49e-04 | 4.88e-03 | 44 |
| GO:00442708 | Breast | Precancer | cellular nitrogen compound catabolic process | 44/1080 | 451/18723 | 4.64e-04 | 6.12e-03 | 44 |
| GO:00194397 | Breast | Precancer | aromatic compound catabolic process | 44/1080 | 467/18723 | 9.55e-04 | 1.07e-02 | 44 |
| GO:00346604 | Breast | Precancer | ncRNA metabolic process | 45/1080 | 485/18723 | 1.15e-03 | 1.26e-02 | 45 |
| GO:19013617 | Breast | Precancer | organic cyclic compound catabolic process | 45/1080 | 495/18723 | 1.73e-03 | 1.74e-02 | 45 |
| GO:000989614 | Breast | IDC | positive regulation of catabolic process | 62/1434 | 492/18723 | 7.06e-05 | 1.42e-03 | 62 |
| GO:003133114 | Breast | IDC | positive regulation of cellular catabolic process | 54/1434 | 427/18723 | 1.85e-04 | 3.07e-03 | 54 |
| GO:000640113 | Breast | IDC | RNA catabolic process | 38/1434 | 278/18723 | 3.54e-04 | 5.16e-03 | 38 |
| GO:190136112 | Breast | IDC | organic cyclic compound catabolic process | 56/1434 | 495/18723 | 2.12e-03 | 1.99e-02 | 56 |
| GO:004670012 | Breast | IDC | heterocycle catabolic process | 51/1434 | 445/18723 | 2.51e-03 | 2.25e-02 | 51 |
| GO:003465513 | Breast | IDC | nucleobase-containing compound catabolic process | 47/1434 | 407/18723 | 3.12e-03 | 2.63e-02 | 47 |
| GO:004427012 | Breast | IDC | cellular nitrogen compound catabolic process | 50/1434 | 451/18723 | 5.29e-03 | 3.93e-02 | 50 |
| GO:001943912 | Breast | IDC | aromatic compound catabolic process | 51/1434 | 467/18723 | 6.54e-03 | 4.59e-02 | 51 |
| GO:000989624 | Breast | DCIS | positive regulation of catabolic process | 61/1390 | 492/18723 | 5.32e-05 | 1.09e-03 | 61 |
| GO:003133124 | Breast | DCIS | positive regulation of cellular catabolic process | 54/1390 | 427/18723 | 8.34e-05 | 1.58e-03 | 54 |
| GO:000640123 | Breast | DCIS | RNA catabolic process | 38/1390 | 278/18723 | 1.91e-04 | 3.08e-03 | 38 |
| Page: 1 2 3 4 5 6 7 8 9 10 11 12 13 14 15 16 17 18 19 20 21 22 23 24 |
| Pathway ID | Tissue | Disease Stage | Description | Gene Ratio | Bg Ratio | pvalue | p.adjust | qvalue | Count |
| hsa05110 | Colorectum | AD | Vibrio cholerae infection | 29/2092 | 50/8465 | 5.10e-07 | 7.12e-06 | 4.54e-06 | 29 |
| hsa04971 | Colorectum | AD | Gastric acid secretion | 29/2092 | 76/8465 | 6.25e-03 | 2.68e-02 | 1.71e-02 | 29 |
| hsa04972 | Colorectum | AD | Pancreatic secretion | 36/2092 | 102/8465 | 1.06e-02 | 3.98e-02 | 2.54e-02 | 36 |
| hsa051101 | Colorectum | AD | Vibrio cholerae infection | 29/2092 | 50/8465 | 5.10e-07 | 7.12e-06 | 4.54e-06 | 29 |
| hsa049711 | Colorectum | AD | Gastric acid secretion | 29/2092 | 76/8465 | 6.25e-03 | 2.68e-02 | 1.71e-02 | 29 |
| hsa049721 | Colorectum | AD | Pancreatic secretion | 36/2092 | 102/8465 | 1.06e-02 | 3.98e-02 | 2.54e-02 | 36 |
| hsa051102 | Colorectum | SER | Vibrio cholerae infection | 24/1580 | 50/8465 | 2.17e-06 | 3.13e-05 | 2.28e-05 | 24 |
| hsa049712 | Colorectum | SER | Gastric acid secretion | 27/1580 | 76/8465 | 3.65e-04 | 3.27e-03 | 2.38e-03 | 27 |
| hsa049722 | Colorectum | SER | Pancreatic secretion | 30/1580 | 102/8465 | 5.41e-03 | 3.28e-02 | 2.38e-02 | 30 |
| hsa051103 | Colorectum | SER | Vibrio cholerae infection | 24/1580 | 50/8465 | 2.17e-06 | 3.13e-05 | 2.28e-05 | 24 |
| hsa049713 | Colorectum | SER | Gastric acid secretion | 27/1580 | 76/8465 | 3.65e-04 | 3.27e-03 | 2.38e-03 | 27 |
| hsa049723 | Colorectum | SER | Pancreatic secretion | 30/1580 | 102/8465 | 5.41e-03 | 3.28e-02 | 2.38e-02 | 30 |
| hsa051104 | Colorectum | MSS | Vibrio cholerae infection | 27/1875 | 50/8465 | 8.58e-07 | 1.20e-05 | 7.34e-06 | 27 |
| hsa049714 | Colorectum | MSS | Gastric acid secretion | 27/1875 | 76/8465 | 5.20e-03 | 2.18e-02 | 1.34e-02 | 27 |
| hsa04725 | Colorectum | MSS | Cholinergic synapse | 36/1875 | 113/8465 | 1.05e-02 | 3.69e-02 | 2.26e-02 | 36 |
| hsa049724 | Colorectum | MSS | Pancreatic secretion | 33/1875 | 102/8465 | 1.09e-02 | 3.75e-02 | 2.30e-02 | 33 |
| hsa051105 | Colorectum | MSS | Vibrio cholerae infection | 27/1875 | 50/8465 | 8.58e-07 | 1.20e-05 | 7.34e-06 | 27 |
| hsa049715 | Colorectum | MSS | Gastric acid secretion | 27/1875 | 76/8465 | 5.20e-03 | 2.18e-02 | 1.34e-02 | 27 |
| hsa047251 | Colorectum | MSS | Cholinergic synapse | 36/1875 | 113/8465 | 1.05e-02 | 3.69e-02 | 2.26e-02 | 36 |
| hsa049725 | Colorectum | MSS | Pancreatic secretion | 33/1875 | 102/8465 | 1.09e-02 | 3.75e-02 | 2.30e-02 | 33 |
| Page: 1 2 3 |
Top |
Cell-cell communication analysis |
| Identification of potential cell-cell interactions between two cell types and their ligand-receptor pairs for different disease states |
| Ligand | Receptor | LRpair | Pathway | Tissue | Disease Stage |
| Page: 1 |
Top |
Single-cell gene regulatory network inference analysis |
| Find out the significant the regulons (TFs) and the target genes of each regulon across cell types for different disease states |
| TF | Cell Type | Tissue | Disease Stage | Target Gene | RSS | Regulon Activity |
| ∗The dot plots of a searched regulon are shown for all cell subpopulations in each disease state of each tissue based on the regulon specific score inferred using pySCENIC and by calculating the average expression. |
| Page: 1 |
Top |
Somatic mutation of malignant transformation related genes |
| Annotation of somatic variants for genes involved in malignant transformation |
| Hugo Symbol | Variant Class | Variant Classification | dbSNP RS | HGVSc | HGVSp | HGVSp Short | SWISSPROT | BIOTYPE | SIFT | PolyPhen | Tumor Sample Barcode | Tissue | Histology | Sex | Age | Stage | Therapy Types | Drugs | Outcome |
| KCNQ1 | SNV | Missense_Mutation | rs199472704 | c.626C>T | p.Ser209Phe | p.S209F | P51787 | protein_coding | deleterious(0) | probably_damaging(0.932) | TCGA-3C-AALI-01 | Breast | breast invasive carcinoma | Female | <65 | I/II | Unspecific | Poly E | Complete Response |
| KCNQ1 | SNV | Missense_Mutation | c.653N>T | p.Lys218Met | p.K218M | P51787 | protein_coding | deleterious(0) | probably_damaging(0.92) | TCGA-A2-A04P-01 | Breast | breast invasive carcinoma | Female | <65 | III/IV | Chemotherapy | taxol | PD | |
| KCNQ1 | SNV | Missense_Mutation | rs749351255 | c.553G>A | p.Val185Met | p.V185M | P51787 | protein_coding | tolerated(0.13) | possibly_damaging(0.539) | TCGA-A7-A26H-01 | Breast | breast invasive carcinoma | Female | >=65 | I/II | Hormone Therapy | anastrozole | PD |
| KCNQ1 | SNV | Missense_Mutation | c.1440N>A | p.Met480Ile | p.M480I | P51787 | protein_coding | tolerated(0.38) | benign(0) | TCGA-D8-A1XJ-01 | Breast | breast invasive carcinoma | Female | >=65 | III/IV | Hormone Therapy | tamoxiphen | SD | |
| KCNQ1 | insertion | In_Frame_Ins | novel | c.1461_1462insATTTTA | p.Glu487_Asp488insIleLeu | p.E487_D488insIL | P51787 | protein_coding | TCGA-A2-A0CQ-01 | Breast | breast invasive carcinoma | Female | <65 | I/II | Chemotherapy | adriamycin | SD | ||
| KCNQ1 | insertion | Frame_Shift_Ins | novel | c.1462_1463insATTTTTTTTCAGTAAGTTTGTATGTAGT | p.Leu489PhefsTer36 | p.L489Ffs*36 | P51787 | protein_coding | TCGA-A2-A0CQ-01 | Breast | breast invasive carcinoma | Female | <65 | I/II | Chemotherapy | adriamycin | SD | ||
| KCNQ1 | deletion | Frame_Shift_Del | rs776103376 | c.1258delN | p.Lys422SerfsTer10 | p.K422Sfs*10 | P51787 | protein_coding | TCGA-EW-A1IZ-01 | Breast | breast invasive carcinoma | Female | <65 | III/IV | Chemotherapy | taxotere | SD | ||
| KCNQ1 | SNV | Missense_Mutation | rs199472692 | c.484N>A | p.Val162Met | p.V162M | P51787 | protein_coding | deleterious(0) | probably_damaging(0.976) | TCGA-2W-A8YY-01 | Cervix | cervical & endocervical cancer | Female | <65 | I/II | Chemotherapy | cisplatin | CR |
| KCNQ1 | SNV | Missense_Mutation | c.1278N>G | p.Asp426Glu | p.D426E | P51787 | protein_coding | tolerated(0.52) | benign(0.005) | TCGA-JX-A3PZ-01 | Cervix | cervical & endocervical cancer | Female | <65 | I/II | Unknown | Unknown | PD | |
| KCNQ1 | SNV | Missense_Mutation | c.1895N>A | p.Arg632Lys | p.R632K | P51787 | protein_coding | tolerated(0.62) | benign(0.036) | TCGA-Q1-A73O-01 | Cervix | cervical & endocervical cancer | Female | <65 | I/II | Chemotherapy | cisplatin | CR |
| Page: 1 2 3 4 5 6 |
Top |
Related drugs of malignant transformation related genes |
| Identification of chemicals and drugs interact with genes involved in malignant transfromation |
| (DGIdb 4.0) |
| Entrez ID | Symbol | Category | Interaction Types | Drug Claim Name | Drug Name | PMIDs |
| 3784 | KCNQ1 | DRUGGABLE GENOME, ION CHANNEL, CELL SURFACE | INDAPAMIDE | INDAPAMIDE | ||
| 3784 | KCNQ1 | DRUGGABLE GENOME, ION CHANNEL, CELL SURFACE | blocker | 135650484 | ||
| 3784 | KCNQ1 | DRUGGABLE GENOME, ION CHANNEL, CELL SURFACE | activator | 135650906 | ||
| 3784 | KCNQ1 | DRUGGABLE GENOME, ION CHANNEL, CELL SURFACE | Indapamide | INDAPAMIDE | ||
| 3784 | KCNQ1 | DRUGGABLE GENOME, ION CHANNEL, CELL SURFACE | blocker | 252166811 | ||
| 3784 | KCNQ1 | DRUGGABLE GENOME, ION CHANNEL, CELL SURFACE | INSULIN | INSULIN | 17182020 | |
| 3784 | KCNQ1 | DRUGGABLE GENOME, ION CHANNEL, CELL SURFACE | blocker | 53801037 | ||
| 3784 | KCNQ1 | DRUGGABLE GENOME, ION CHANNEL, CELL SURFACE | BEPRIDIL | BEPRIDIL | ||
| 3784 | KCNQ1 | DRUGGABLE GENOME, ION CHANNEL, CELL SURFACE | ICA-105665 | |||
| 3784 | KCNQ1 | DRUGGABLE GENOME, ION CHANNEL, CELL SURFACE | blocker | 135650352 | CHEMBL298475 |
| Page: 1 2 3 |

Copyright 2023-Present -The University of Texas Health Science Center at Houston |