
|
|||||
|
 | |
| |
| |
| |
| |
| |
|
Gene: KCNN4 |
Gene summary for KCNN4 |
| Gene information | Species | Human | Gene symbol | KCNN4 | Gene ID | 3783 |
| Gene name | potassium calcium-activated channel subfamily N member 4 | |
| Gene Alias | DHS2 | |
| Cytomap | 19q13.31 | |
| Gene Type | protein-coding | GO ID | GO:0002253 | UniProtAcc | O15554 |
Top |
Malignant transformation analysis |
| Identification of the aberrant gene expression in precancerous and cancerous lesions by comparing the gene expression of stem-like cells in diseased tissues with normal stem cells |
| Entrez ID | Symbol | Replicates | Species | Organ | Tissue | Adj P-value | Log2FC | Malignancy |
| 3783 | KCNN4 | HTA11_1938_2000001011 | Human | Colorectum | AD | 4.88e-06 | 5.26e-01 | -0.0811 |
| 3783 | KCNN4 | HTA11_1391_2000001011 | Human | Colorectum | AD | 4.32e-04 | 4.65e-01 | -0.059 |
| 3783 | KCNN4 | HTA11_8622_2000001021 | Human | Colorectum | SER | 5.38e-05 | 7.30e-01 | 0.0528 |
| 3783 | KCNN4 | HTA11_10711_2000001011 | Human | Colorectum | AD | 1.16e-03 | 4.81e-01 | 0.0338 |
| 3783 | KCNN4 | HTA11_7696_3000711011 | Human | Colorectum | AD | 9.00e-40 | 1.14e+00 | 0.0674 |
| 3783 | KCNN4 | HTA11_6818_2000001021 | Human | Colorectum | AD | 4.69e-14 | 8.29e-01 | 0.0588 |
| 3783 | KCNN4 | HTA11_99999970781_79442 | Human | Colorectum | MSS | 1.35e-30 | 8.95e-01 | 0.294 |
| 3783 | KCNN4 | HTA11_99999971662_82457 | Human | Colorectum | MSS | 1.20e-23 | 8.64e-01 | 0.3859 |
| 3783 | KCNN4 | A015-C-203 | Human | Colorectum | FAP | 4.79e-02 | -6.02e-02 | -0.1294 |
| 3783 | KCNN4 | A002-C-205 | Human | Colorectum | FAP | 2.29e-06 | -1.75e-01 | -0.1236 |
| 3783 | KCNN4 | A002-C-114 | Human | Colorectum | FAP | 1.24e-02 | -1.06e-02 | -0.1561 |
| 3783 | KCNN4 | A015-C-104 | Human | Colorectum | FAP | 3.72e-02 | -3.72e-02 | -0.1899 |
| 3783 | KCNN4 | A002-C-016 | Human | Colorectum | FAP | 9.20e-03 | -1.55e-01 | 0.0521 |
| 3783 | KCNN4 | A002-C-116 | Human | Colorectum | FAP | 2.59e-06 | -2.04e-01 | -0.0452 |
| 3783 | KCNN4 | A014-C-008 | Human | Colorectum | FAP | 8.51e-03 | -1.53e-01 | -0.191 |
| 3783 | KCNN4 | A018-E-020 | Human | Colorectum | FAP | 2.20e-03 | -8.21e-02 | -0.2034 |
| 3783 | KCNN4 | F034 | Human | Colorectum | FAP | 4.94e-04 | -2.06e-01 | -0.0665 |
| 3783 | KCNN4 | CRC-1-8810 | Human | Colorectum | CRC | 1.77e-02 | -1.50e-01 | 0.6257 |
| 3783 | KCNN4 | CRC-3-11773 | Human | Colorectum | CRC | 4.36e-06 | 4.30e-01 | 0.2564 |
| 3783 | KCNN4 | LZE24T | Human | Esophagus | ESCC | 2.75e-02 | -1.76e-01 | 0.0596 |
| Page: 1 2 3 |
| Tissue | Expression Dynamics | Abbreviation |
| Colorectum (GSE201348) | 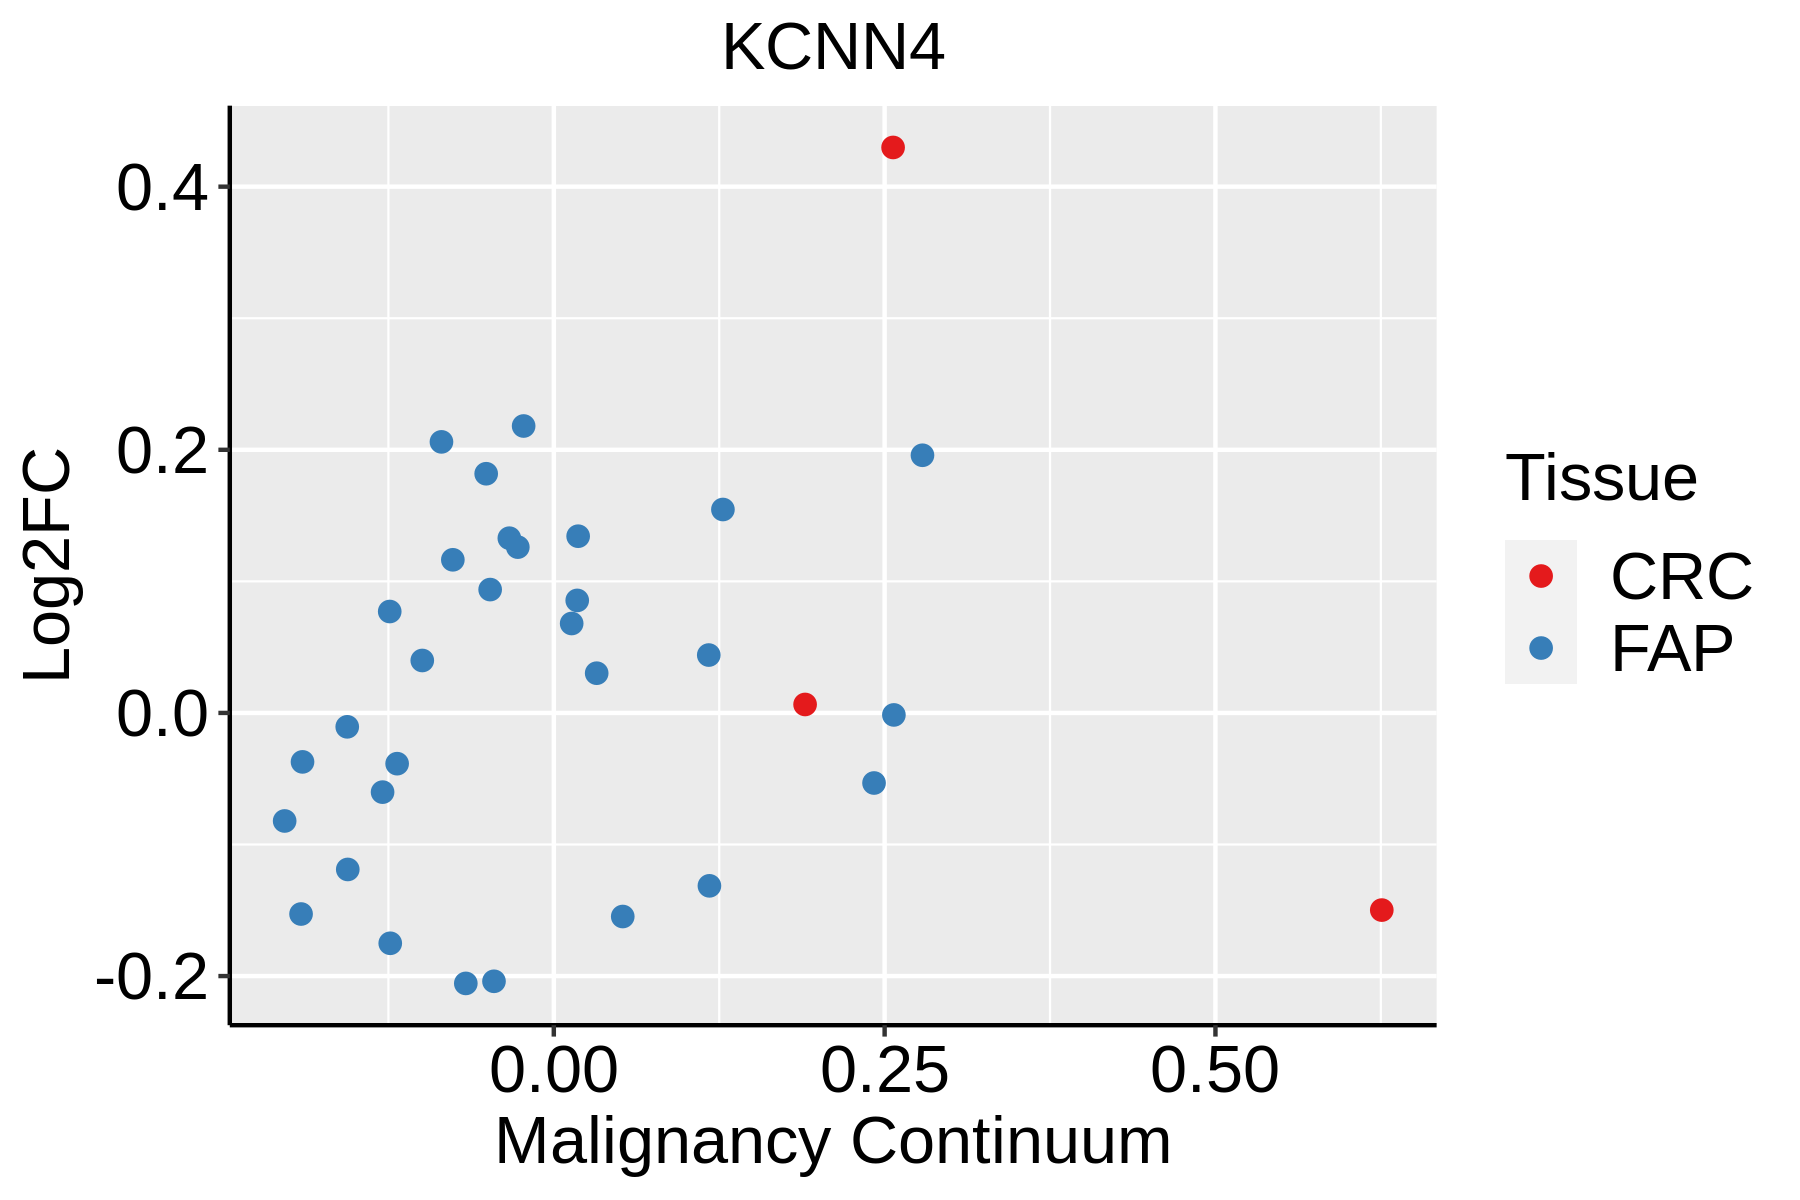 | FAP: Familial adenomatous polyposis |
| CRC: Colorectal cancer | ||
| Colorectum (HTA11) |  | AD: Adenomas |
| SER: Sessile serrated lesions | ||
| MSI-H: Microsatellite-high colorectal cancer | ||
| MSS: Microsatellite stable colorectal cancer | ||
| Esophagus | 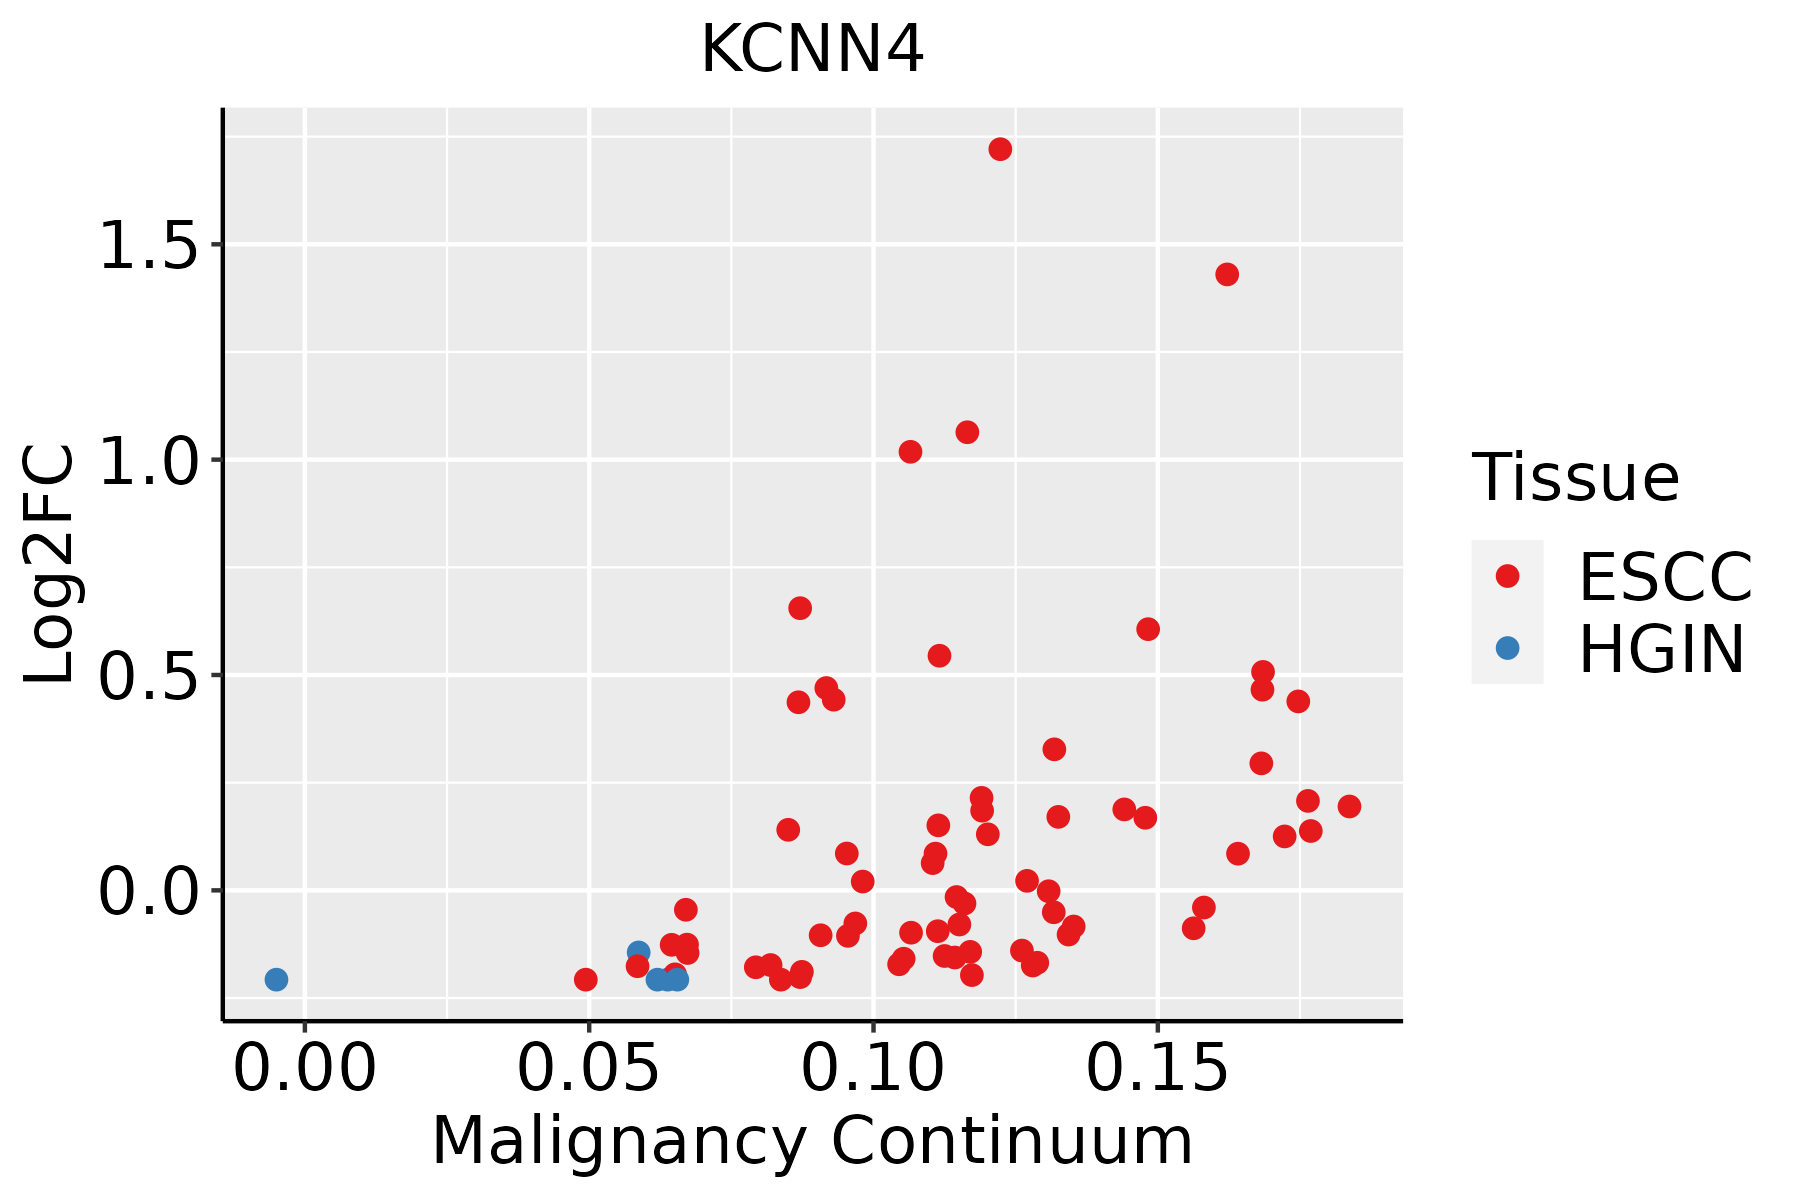 | ESCC: Esophageal squamous cell carcinoma |
| HGIN: High-grade intraepithelial neoplasias | ||
| LGIN: Low-grade intraepithelial neoplasias | ||
| Thyroid | 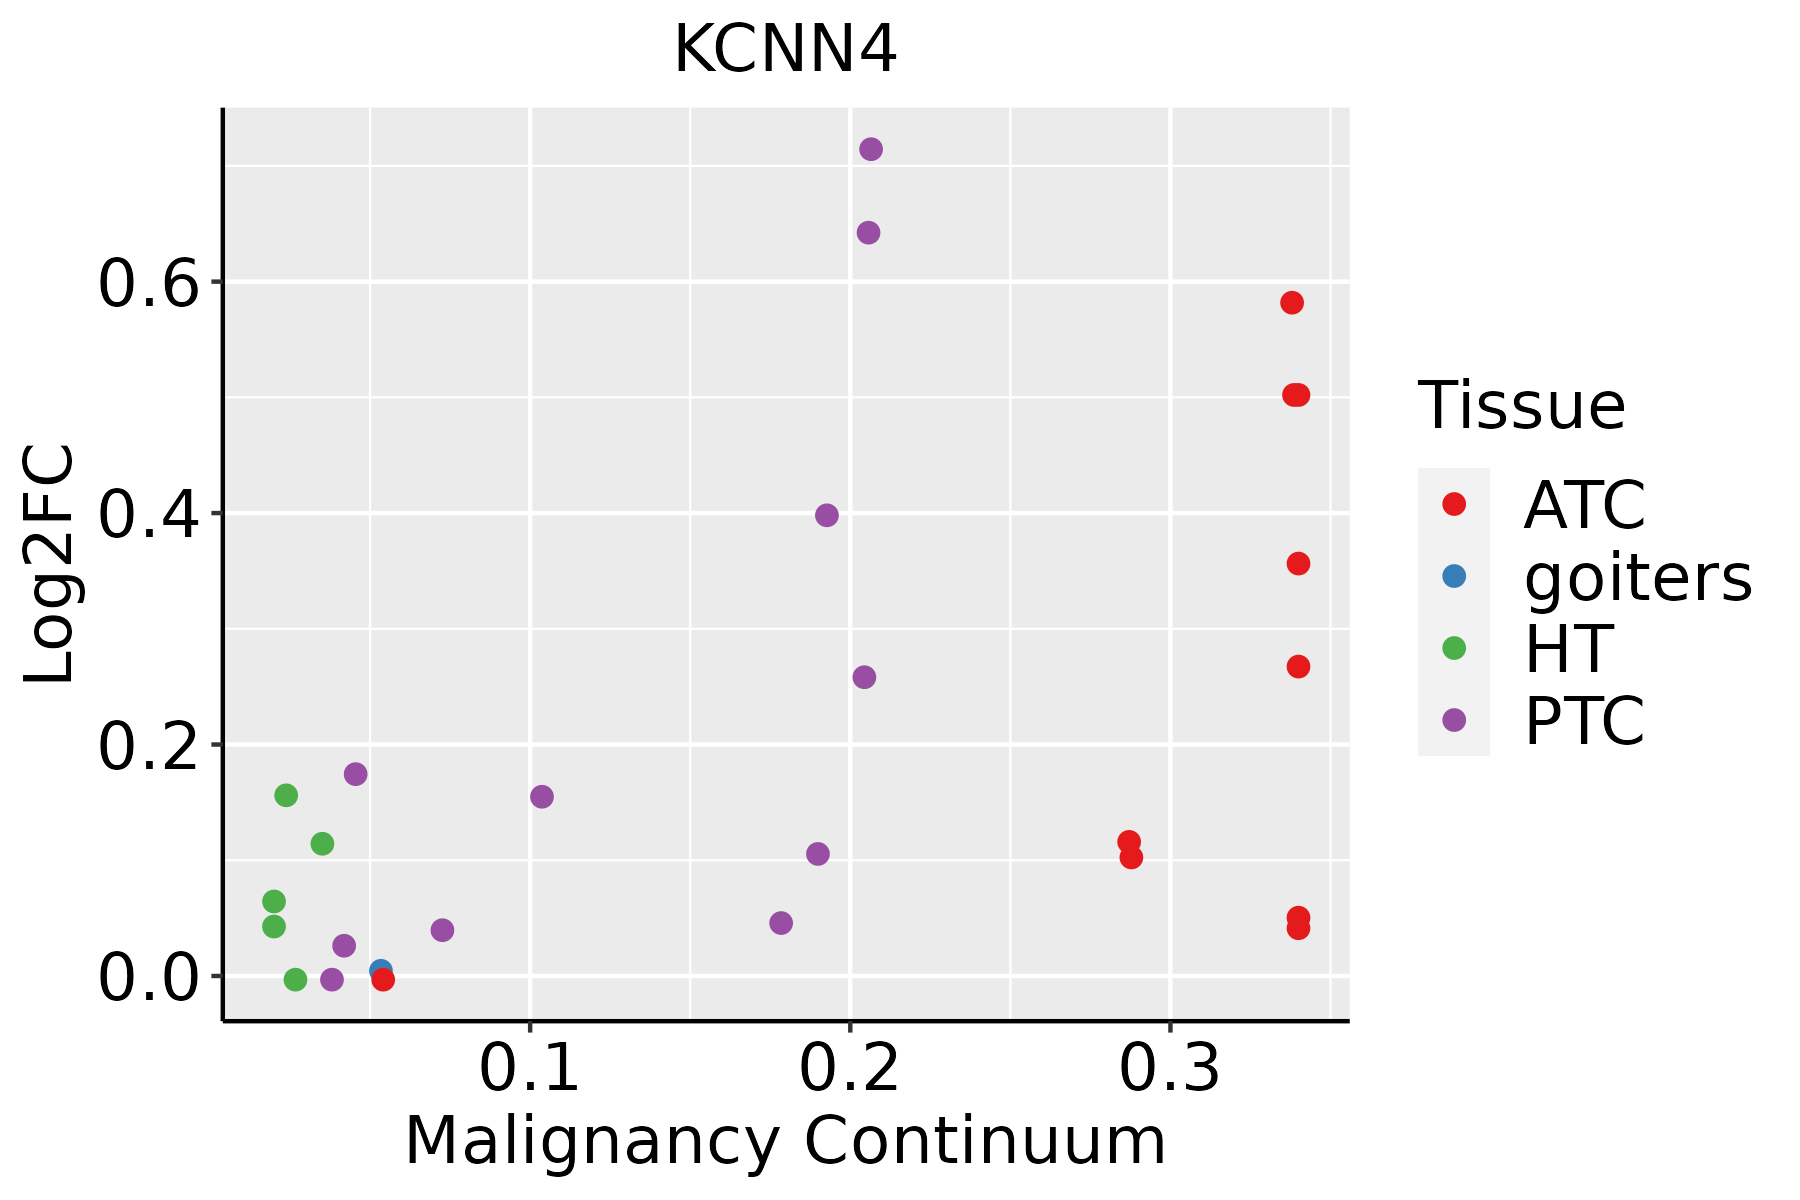 | ATC: Anaplastic thyroid cancer |
| HT: Hashimoto's thyroiditis | ||
| PTC: Papillary thyroid cancer |
| ∗log2FC in expression of this searched gene in stem-like cells from each diseased tissue sample relative to stem-like cells in normal samples in each tissue plotted against the malignancy continuum. Samples are colored based on if they are from different disease stage. |
Top |
Malignant transformation related pathway analysis |
| Find out the enriched GO biological processes and KEGG pathways involved in transition from healthy to precancer to cancer |
| Tissue | Disease Stage | Enriched GO biological Processes |
| Colorectum | AD |  |
| Colorectum | SER |  |
| Colorectum | MSS |  |
| Colorectum | MSI-H |  |
| Colorectum | FAP |  |
| ∗Top 15 enriched GO BP terms are showed in the bar plot of each disease state in each tissue. Each row represents a significant GO biological process which is colored according to the -log10(p.adjust). |
| Page: 1 2 3 4 5 6 7 8 9 |
| GO ID | Tissue | Disease Stage | Description | Gene Ratio | Bg Ratio | pvalue | p.adjust | Count |
| GO:0032535 | Colorectum | AD | regulation of cellular component size | 142/3918 | 383/18723 | 1.74e-13 | 3.41e-11 | 142 |
| GO:1904951 | Colorectum | AD | positive regulation of establishment of protein localization | 112/3918 | 319/18723 | 2.55e-09 | 1.80e-07 | 112 |
| GO:0051222 | Colorectum | AD | positive regulation of protein transport | 106/3918 | 303/18723 | 8.45e-09 | 5.08e-07 | 106 |
| GO:0050708 | Colorectum | AD | regulation of protein secretion | 83/3918 | 268/18723 | 6.59e-05 | 1.07e-03 | 83 |
| GO:0009306 | Colorectum | AD | protein secretion | 105/3918 | 359/18723 | 1.05e-04 | 1.57e-03 | 105 |
| GO:0035592 | Colorectum | AD | establishment of protein localization to extracellular region | 105/3918 | 360/18723 | 1.18e-04 | 1.73e-03 | 105 |
| GO:0071692 | Colorectum | AD | protein localization to extracellular region | 106/3918 | 368/18723 | 1.86e-04 | 2.49e-03 | 106 |
| GO:0050878 | Colorectum | AD | regulation of body fluid levels | 108/3918 | 379/18723 | 2.54e-04 | 3.20e-03 | 108 |
| GO:0051047 | Colorectum | AD | positive regulation of secretion | 90/3918 | 310/18723 | 4.11e-04 | 4.66e-03 | 90 |
| GO:1903532 | Colorectum | AD | positive regulation of secretion by cell | 82/3918 | 282/18723 | 6.85e-04 | 7.00e-03 | 82 |
| GO:0007589 | Colorectum | AD | body fluid secretion | 33/3918 | 93/18723 | 8.26e-04 | 8.13e-03 | 33 |
| GO:0008361 | Colorectum | AD | regulation of cell size | 56/3918 | 181/18723 | 9.61e-04 | 9.07e-03 | 56 |
| GO:0010876 | Colorectum | AD | lipid localization | 120/3918 | 448/18723 | 1.59e-03 | 1.33e-02 | 120 |
| GO:0006869 | Colorectum | AD | lipid transport | 108/3918 | 398/18723 | 1.67e-03 | 1.39e-02 | 108 |
| GO:0050714 | Colorectum | AD | positive regulation of protein secretion | 42/3918 | 137/18723 | 4.64e-03 | 3.16e-02 | 42 |
| GO:0015748 | Colorectum | AD | organophosphate ester transport | 42/3918 | 140/18723 | 7.04e-03 | 4.31e-02 | 42 |
| GO:00325351 | Colorectum | SER | regulation of cellular component size | 115/2897 | 383/18723 | 3.04e-13 | 1.10e-10 | 115 |
| GO:19049511 | Colorectum | SER | positive regulation of establishment of protein localization | 91/2897 | 319/18723 | 1.69e-09 | 1.68e-07 | 91 |
| GO:00512221 | Colorectum | SER | positive regulation of protein transport | 85/2897 | 303/18723 | 1.36e-08 | 1.05e-06 | 85 |
| GO:00507081 | Colorectum | SER | regulation of protein secretion | 63/2897 | 268/18723 | 3.42e-04 | 5.39e-03 | 63 |
| Page: 1 2 3 4 5 6 |
| Pathway ID | Tissue | Disease Stage | Description | Gene Ratio | Bg Ratio | pvalue | p.adjust | qvalue | Count |
| hsa04911 | Colorectum | FAP | Insulin secretion | 23/1404 | 86/8465 | 1.12e-02 | 3.92e-02 | 2.38e-02 | 23 |
| hsa04970 | Colorectum | FAP | Salivary secretion | 24/1404 | 93/8465 | 1.52e-02 | 4.99e-02 | 3.03e-02 | 24 |
| hsa049111 | Colorectum | FAP | Insulin secretion | 23/1404 | 86/8465 | 1.12e-02 | 3.92e-02 | 2.38e-02 | 23 |
| hsa049701 | Colorectum | FAP | Salivary secretion | 24/1404 | 93/8465 | 1.52e-02 | 4.99e-02 | 3.03e-02 | 24 |
| hsa049702 | Colorectum | CRC | Salivary secretion | 22/1091 | 93/8465 | 3.03e-03 | 1.91e-02 | 1.29e-02 | 22 |
| hsa049112 | Colorectum | CRC | Insulin secretion | 20/1091 | 86/8465 | 5.61e-03 | 2.88e-02 | 1.95e-02 | 20 |
| hsa049703 | Colorectum | CRC | Salivary secretion | 22/1091 | 93/8465 | 3.03e-03 | 1.91e-02 | 1.29e-02 | 22 |
| hsa049113 | Colorectum | CRC | Insulin secretion | 20/1091 | 86/8465 | 5.61e-03 | 2.88e-02 | 1.95e-02 | 20 |
| Page: 1 |
Top |
Cell-cell communication analysis |
| Identification of potential cell-cell interactions between two cell types and their ligand-receptor pairs for different disease states |
| Ligand | Receptor | LRpair | Pathway | Tissue | Disease Stage |
| Page: 1 |
Top |
Single-cell gene regulatory network inference analysis |
| Find out the significant the regulons (TFs) and the target genes of each regulon across cell types for different disease states |
| TF | Cell Type | Tissue | Disease Stage | Target Gene | RSS | Regulon Activity |
| ∗The dot plots of a searched regulon are shown for all cell subpopulations in each disease state of each tissue based on the regulon specific score inferred using pySCENIC and by calculating the average expression. |
| Page: 1 |
Top |
Somatic mutation of malignant transformation related genes |
| Annotation of somatic variants for genes involved in malignant transformation |
| Hugo Symbol | Variant Class | Variant Classification | dbSNP RS | HGVSc | HGVSp | HGVSp Short | SWISSPROT | BIOTYPE | SIFT | PolyPhen | Tumor Sample Barcode | Tissue | Histology | Sex | Age | Stage | Therapy Types | Drugs | Outcome |
| KCNN4 | insertion | In_Frame_Ins | novel | c.935_936insCCTGGGTACCTGGGTTTCTACTGGGGATGGGGGCTCGTG | p.Lys312delinsAsnLeuGlyThrTrpValSerThrGlyAspGlyGlySerTrp | p.K312delinsNLGTWVSTGDGGSW | O15554 | protein_coding | TCGA-A2-A0EO-01 | Breast | breast invasive carcinoma | Female | <65 | I/II | Hormone Therapy | tamoxiphen | SD | ||
| KCNN4 | insertion | Frame_Shift_Ins | rs763726942 | c.153dupG | p.Cys52ValfsTer11 | p.C52Vfs*11 | O15554 | protein_coding | TCGA-AR-A0TY-01 | Breast | breast invasive carcinoma | Female | <65 | I/II | Unspecific | Paclitaxel | PD | ||
| KCNN4 | SNV | Missense_Mutation | novel | c.1179N>T | p.Glu393Asp | p.E393D | O15554 | protein_coding | tolerated(0.07) | possibly_damaging(0.875) | TCGA-FU-A3HZ-01 | Cervix | cervical & endocervical cancer | Female | <65 | I/II | Chemotherapy | cisplatin | CR |
| KCNN4 | SNV | Missense_Mutation | novel | c.458C>T | p.Ser153Phe | p.S153F | O15554 | protein_coding | deleterious(0) | probably_damaging(0.998) | TCGA-UC-A7PG-06 | Cervix | cervical & endocervical cancer | Female | <65 | III/IV | Chemotherapy | cisplatin | PD |
| KCNN4 | SNV | Missense_Mutation | rs748681028 | c.499N>A | p.Val167Met | p.V167M | O15554 | protein_coding | tolerated(1) | benign(0.026) | TCGA-CK-4951-01 | Colorectum | colon adenocarcinoma | Female | >=65 | I/II | Unknown | Unknown | PD |
| KCNN4 | SNV | Missense_Mutation | rs201019335 | c.41N>A | p.Arg14His | p.R14H | O15554 | protein_coding | tolerated(0.62) | benign(0.011) | TCGA-G4-6304-01 | Colorectum | colon adenocarcinoma | Female | >=65 | I/II | Chemotherapy | fluorouracil | PD |
| KCNN4 | insertion | Frame_Shift_Ins | novel | c.478_479insAGGGAAGCGCTGCTGTCCCTGGCCATGCTGCTGCGTC | p.Leu160GlnfsTer85 | p.L160Qfs*85 | O15554 | protein_coding | TCGA-EI-6884-01 | Colorectum | rectum adenocarcinoma | Male | >=65 | III/IV | Chemotherapy | 5 | SD | ||
| KCNN4 | SNV | Missense_Mutation | novel | c.113G>A | p.Gly38Glu | p.G38E | O15554 | protein_coding | deleterious(0) | possibly_damaging(0.815) | TCGA-A5-A0G1-01 | Endometrium | uterine corpus endometrioid carcinoma | Female | >=65 | I/II | Unknown | Unknown | SD |
| KCNN4 | SNV | Missense_Mutation | c.1166A>G | p.His389Arg | p.H389R | O15554 | protein_coding | tolerated(0.18) | possibly_damaging(0.715) | TCGA-A5-A0VP-01 | Endometrium | uterine corpus endometrioid carcinoma | Female | >=65 | I/II | Unknown | Unknown | SD | |
| KCNN4 | SNV | Missense_Mutation | novel | c.592C>T | p.Leu198Phe | p.L198F | O15554 | protein_coding | deleterious(0) | possibly_damaging(0.737) | TCGA-A5-A2K5-01 | Endometrium | uterine corpus endometrioid carcinoma | Female | >=65 | I/II | Unknown | Unknown | SD |
| Page: 1 2 3 4 5 |
Top |
Related drugs of malignant transformation related genes |
| Identification of chemicals and drugs interact with genes involved in malignant transfromation |
| (DGIdb 4.0) |
| Entrez ID | Symbol | Category | Interaction Types | Drug Claim Name | Drug Name | PMIDs |
| 3783 | KCNN4 | ION CHANNEL, DRUGGABLE GENOME | blocker | CHEMBL405821 | SENICAPOC | |
| 3783 | KCNN4 | ION CHANNEL, DRUGGABLE GENOME | CHEMBL1371 | CHLORZOXAZONE | ||
| 3783 | KCNN4 | ION CHANNEL, DRUGGABLE GENOME | activator | 135650900 | RILUZOLE | |
| 3783 | KCNN4 | ION CHANNEL, DRUGGABLE GENOME | blocker | 135650723 | NITRENDIPINE | |
| 3783 | KCNN4 | ION CHANNEL, DRUGGABLE GENOME | activator | 252166700 | ||
| 3783 | KCNN4 | ION CHANNEL, DRUGGABLE GENOME | blocker | 318164837 | ||
| 3783 | KCNN4 | ION CHANNEL, DRUGGABLE GENOME | ICA-17043 | SENICAPOC | ||
| 3783 | KCNN4 | ION CHANNEL, DRUGGABLE GENOME | blocker | 135650114 | CLOTRIMAZOLE | |
| 3783 | KCNN4 | ION CHANNEL, DRUGGABLE GENOME | activator | 135652731 | ||
| 3783 | KCNN4 | ION CHANNEL, DRUGGABLE GENOME | activator | 404859002 |
| Page: 1 2 3 |

Copyright 2023-Present -The University of Texas Health Science Center at Houston |