
|
|||||
|
 | |
| |
| |
| |
| |
| |
|
Gene: KCNMB4 |
Gene summary for KCNMB4 |
| Gene information | Species | Human | Gene symbol | KCNMB4 | Gene ID | 27345 |
| Gene name | potassium calcium-activated channel subfamily M regulatory beta subunit 4 | |
| Gene Alias | KCNMB4 | |
| Cytomap | 12q15 | |
| Gene Type | protein-coding | GO ID | GO:0001505 | UniProtAcc | Q86W47 |
Top |
Malignant transformation analysis |
| Identification of the aberrant gene expression in precancerous and cancerous lesions by comparing the gene expression of stem-like cells in diseased tissues with normal stem cells |
| Entrez ID | Symbol | Replicates | Species | Organ | Tissue | Adj P-value | Log2FC | Malignancy |
| 27345 | KCNMB4 | male-WTA | Human | Thyroid | PTC | 3.63e-06 | 7.44e-02 | 0.1037 |
| 27345 | KCNMB4 | PTC06 | Human | Thyroid | PTC | 4.78e-05 | 1.53e-01 | 0.2057 |
| 27345 | KCNMB4 | PTC07 | Human | Thyroid | PTC | 9.39e-03 | 4.52e-02 | 0.2044 |
| 27345 | KCNMB4 | ATC13 | Human | Thyroid | ATC | 1.32e-69 | 1.68e+00 | 0.34 |
| 27345 | KCNMB4 | ATC5 | Human | Thyroid | ATC | 1.40e-71 | 1.78e+00 | 0.34 |
| Page: 1 |
| Tissue | Expression Dynamics | Abbreviation |
| Thyroid | 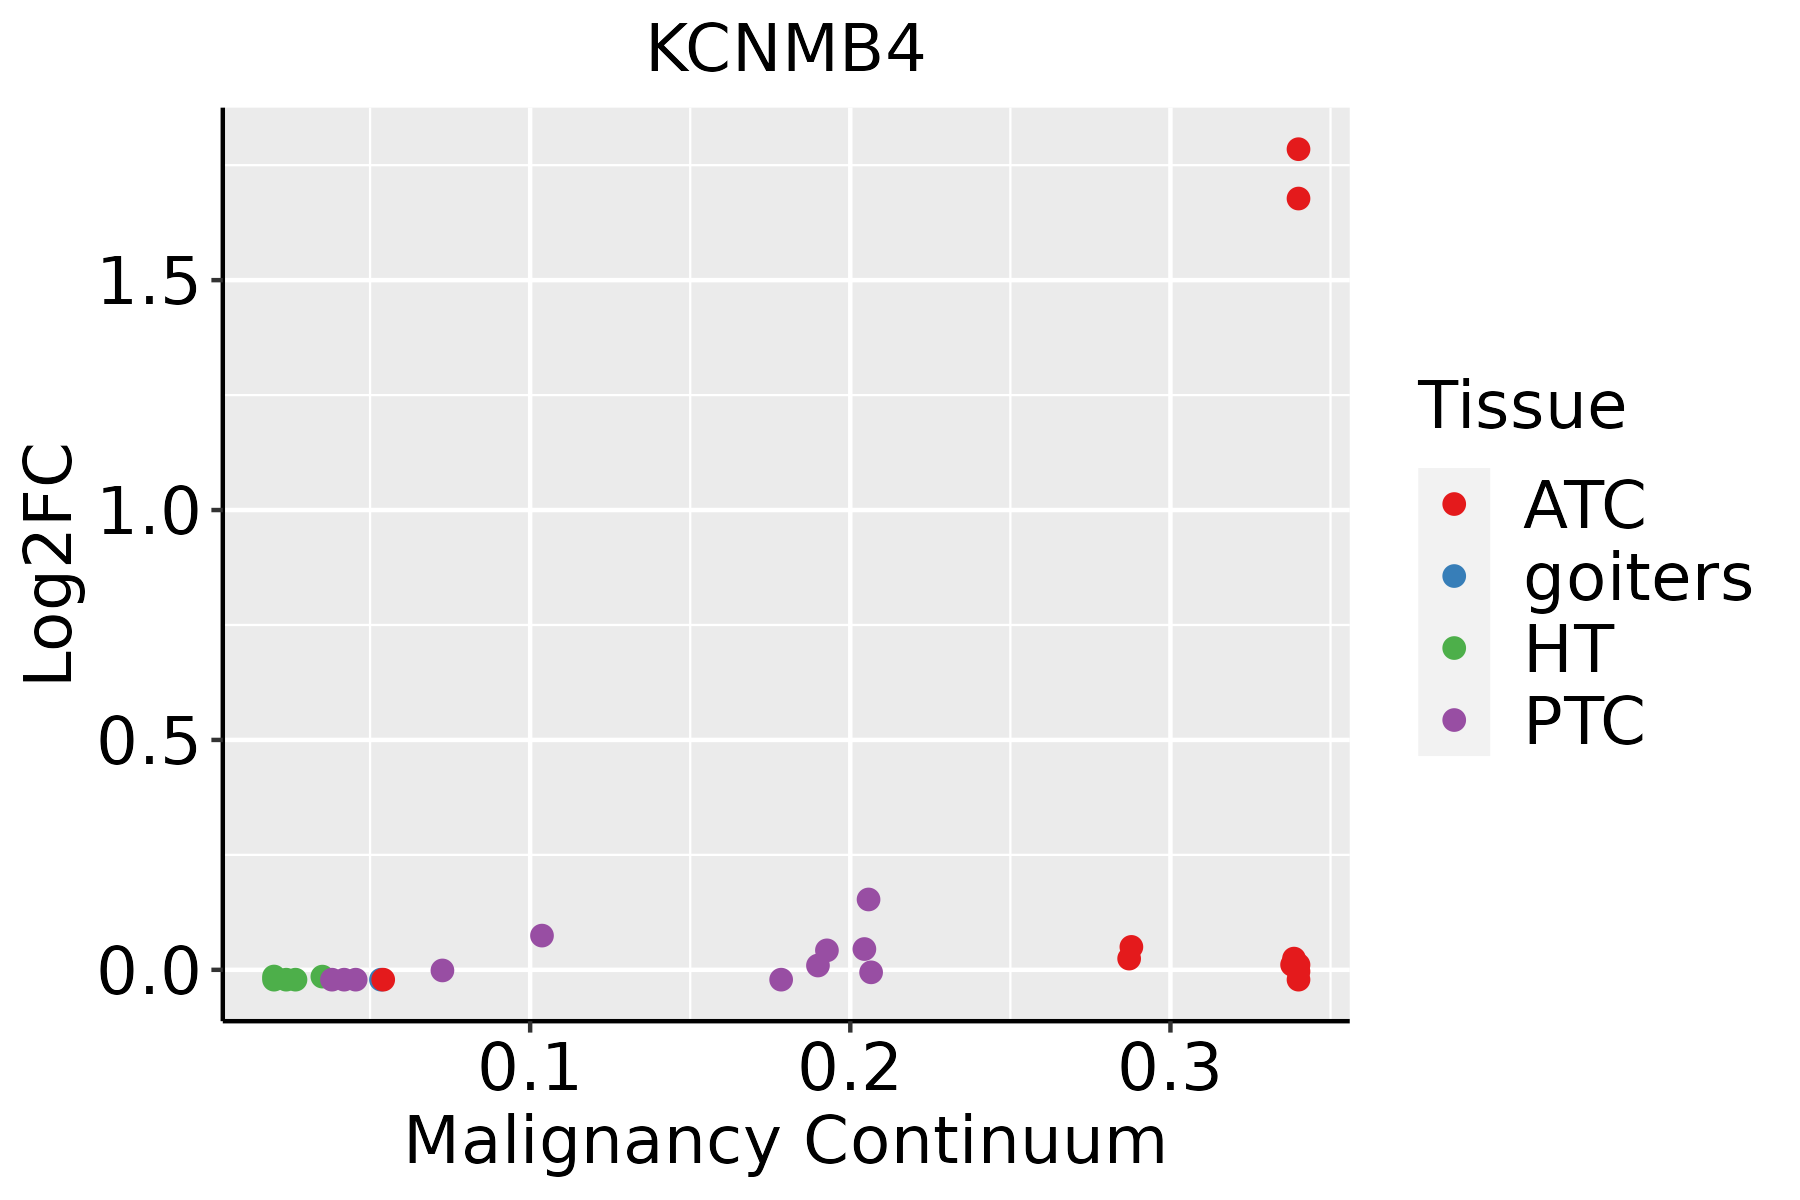 | ATC: Anaplastic thyroid cancer |
| HT: Hashimoto's thyroiditis | ||
| PTC: Papillary thyroid cancer |
| ∗log2FC in expression of this searched gene in stem-like cells from each diseased tissue sample relative to stem-like cells in normal samples in each tissue plotted against the malignancy continuum. Samples are colored based on if they are from different disease stage. |
Top |
Malignant transformation related pathway analysis |
| Find out the enriched GO biological processes and KEGG pathways involved in transition from healthy to precancer to cancer |
| Tissue | Disease Stage | Enriched GO biological Processes |
| Colorectum | AD |  |
| Colorectum | SER |  |
| Colorectum | MSS |  |
| Colorectum | MSI-H |  |
| Colorectum | FAP |  |
| ∗Top 15 enriched GO BP terms are showed in the bar plot of each disease state in each tissue. Each row represents a significant GO biological process which is colored according to the -log10(p.adjust). |
| Page: 1 2 3 4 5 6 7 8 9 |
| GO ID | Tissue | Disease Stage | Description | Gene Ratio | Bg Ratio | pvalue | p.adjust | Count |
| GO:0010038112 | Thyroid | PTC | response to metal ion | 157/5968 | 373/18723 | 1.80e-05 | 1.86e-04 | 157 |
| GO:005159219 | Thyroid | PTC | response to calcium ion | 65/5968 | 149/18723 | 1.67e-03 | 9.16e-03 | 65 |
| GO:0010038210 | Thyroid | ATC | response to metal ion | 165/6293 | 373/18723 | 1.07e-05 | 1.05e-04 | 165 |
| GO:005159225 | Thyroid | ATC | response to calcium ion | 69/6293 | 149/18723 | 8.43e-04 | 4.62e-03 | 69 |
| Page: 1 |
| Pathway ID | Tissue | Disease Stage | Description | Gene Ratio | Bg Ratio | pvalue | p.adjust | qvalue | Count |
| Page: 1 |
Top |
Cell-cell communication analysis |
| Identification of potential cell-cell interactions between two cell types and their ligand-receptor pairs for different disease states |
| Ligand | Receptor | LRpair | Pathway | Tissue | Disease Stage |
| Page: 1 |
Top |
Single-cell gene regulatory network inference analysis |
| Find out the significant the regulons (TFs) and the target genes of each regulon across cell types for different disease states |
| TF | Cell Type | Tissue | Disease Stage | Target Gene | RSS | Regulon Activity |
| ∗The dot plots of a searched regulon are shown for all cell subpopulations in each disease state of each tissue based on the regulon specific score inferred using pySCENIC and by calculating the average expression. |
| Page: 1 |
Top |
Somatic mutation of malignant transformation related genes |
| Annotation of somatic variants for genes involved in malignant transformation |
| Hugo Symbol | Variant Class | Variant Classification | dbSNP RS | HGVSc | HGVSp | HGVSp Short | SWISSPROT | BIOTYPE | SIFT | PolyPhen | Tumor Sample Barcode | Tissue | Histology | Sex | Age | Stage | Therapy Types | Drugs | Outcome |
| KCNMB4 | SNV | Missense_Mutation | novel | c.155N>T | p.Ala52Val | p.A52V | Q86W47 | protein_coding | deleterious(0.01) | benign(0.055) | TCGA-2W-A8YY-01 | Cervix | cervical & endocervical cancer | Female | <65 | I/II | Chemotherapy | cisplatin | CR |
| KCNMB4 | SNV | Missense_Mutation | c.190N>A | p.Glu64Lys | p.E64K | Q86W47 | protein_coding | deleterious(0.03) | benign(0.058) | TCGA-IR-A3LK-01 | Cervix | cervical & endocervical cancer | Female | >=65 | I/II | Chemotherapy | cisplatin | PD | |
| KCNMB4 | SNV | Missense_Mutation | c.627N>A | p.Phe209Leu | p.F209L | Q86W47 | protein_coding | tolerated_low_confidence(0.44) | benign(0.018) | TCGA-AA-3977-01 | Colorectum | colon adenocarcinoma | Male | >=65 | I/II | Unknown | Unknown | SD | |
| KCNMB4 | SNV | Missense_Mutation | novel | c.92C>T | p.Ser31Leu | p.S31L | Q86W47 | protein_coding | tolerated(0.12) | probably_damaging(0.988) | TCGA-CK-4951-01 | Colorectum | colon adenocarcinoma | Female | >=65 | I/II | Unknown | Unknown | PD |
| KCNMB4 | SNV | Missense_Mutation | c.488N>A | p.Arg163His | p.R163H | Q86W47 | protein_coding | deleterious(0.03) | probably_damaging(0.997) | TCGA-G4-6588-01 | Colorectum | colon adenocarcinoma | Female | <65 | I/II | Unknown | Unknown | SD | |
| KCNMB4 | SNV | Missense_Mutation | c.627N>A | p.Phe209Leu | p.F209L | Q86W47 | protein_coding | tolerated_low_confidence(0.44) | benign(0.018) | TCGA-AG-A002-01 | Colorectum | rectum adenocarcinoma | Male | <65 | I/II | Unknown | Unknown | SD | |
| KCNMB4 | SNV | Missense_Mutation | novel | c.130C>A | p.Leu44Met | p.L44M | Q86W47 | protein_coding | tolerated(1) | probably_damaging(0.995) | TCGA-A5-A1OF-01 | Endometrium | uterine corpus endometrioid carcinoma | Female | <65 | I/II | Unknown | Unknown | SD |
| KCNMB4 | SNV | Missense_Mutation | c.627N>A | p.Phe209Leu | p.F209L | Q86W47 | protein_coding | tolerated_low_confidence(0.44) | benign(0.018) | TCGA-A5-A2K5-01 | Endometrium | uterine corpus endometrioid carcinoma | Female | >=65 | I/II | Unknown | Unknown | SD | |
| KCNMB4 | SNV | Missense_Mutation | novel | c.379N>G | p.Leu127Val | p.L127V | Q86W47 | protein_coding | tolerated(0.13) | benign(0.038) | TCGA-AJ-A3EL-01 | Endometrium | uterine corpus endometrioid carcinoma | Female | <65 | I/II | Unknown | Unknown | SD |
| KCNMB4 | SNV | Missense_Mutation | rs780176319 | c.619C>T | p.Arg207Cys | p.R207C | Q86W47 | protein_coding | deleterious(0.01) | possibly_damaging(0.893) | TCGA-AP-A056-01 | Endometrium | uterine corpus endometrioid carcinoma | Female | <65 | I/II | Unknown | Unknown | SD |
| Page: 1 2 3 |
Top |
Related drugs of malignant transformation related genes |
| Identification of chemicals and drugs interact with genes involved in malignant transfromation |
| (DGIdb 4.0) |
| Entrez ID | Symbol | Category | Interaction Types | Drug Claim Name | Drug Name | PMIDs |
| Page: 1 |

Copyright 2023-Present -The University of Texas Health Science Center at Houston |