
|
|||||
|
 | |
| |
| |
| |
| |
| |
|
Gene: KCNMA1 |
Gene summary for KCNMA1 |
| Gene information | Species | Human | Gene symbol | KCNMA1 | Gene ID | 3778 |
| Gene name | potassium calcium-activated channel subfamily M alpha 1 | |
| Gene Alias | BKTM | |
| Cytomap | 10q22.3 | |
| Gene Type | protein-coding | GO ID | GO:0001666 | UniProtAcc | Q12791 |
Top |
Malignant transformation analysis |
| Identification of the aberrant gene expression in precancerous and cancerous lesions by comparing the gene expression of stem-like cells in diseased tissues with normal stem cells |
| Entrez ID | Symbol | Replicates | Species | Organ | Tissue | Adj P-value | Log2FC | Malignancy |
| 3778 | KCNMA1 | GSM4909281 | Human | Breast | IDC | 7.79e-05 | -1.96e-01 | 0.21 |
| 3778 | KCNMA1 | GSM4909286 | Human | Breast | IDC | 3.66e-05 | -1.96e-01 | 0.1081 |
| 3778 | KCNMA1 | GSM4909293 | Human | Breast | IDC | 5.77e-11 | 3.24e-01 | 0.1581 |
| 3778 | KCNMA1 | GSM4909299 | Human | Breast | IDC | 5.91e-03 | -1.84e-01 | 0.035 |
| 3778 | KCNMA1 | GSM4909301 | Human | Breast | IDC | 1.28e-02 | -1.90e-01 | 0.1577 |
| 3778 | KCNMA1 | GSM4909302 | Human | Breast | IDC | 1.72e-02 | 2.56e-01 | 0.1545 |
| 3778 | KCNMA1 | GSM4909304 | Human | Breast | IDC | 5.16e-09 | 3.05e-01 | 0.1636 |
| 3778 | KCNMA1 | GSM4909319 | Human | Breast | IDC | 1.71e-04 | -1.13e-01 | 0.1563 |
| 3778 | KCNMA1 | brca10 | Human | Breast | Precancer | 9.68e-28 | 9.52e-01 | -0.0029 |
| 3778 | KCNMA1 | P1 | Human | Breast | IDC | 8.42e-03 | -1.96e-01 | 0.1527 |
| 3778 | KCNMA1 | DCIS2 | Human | Breast | DCIS | 4.69e-04 | -1.86e-01 | 0.0085 |
| 3778 | KCNMA1 | HTA11_78_2000001011 | Human | Colorectum | AD | 3.58e-09 | 1.14e+00 | -0.1088 |
| 3778 | KCNMA1 | HTA11_2112_2000001011 | Human | Colorectum | SER | 1.33e-03 | 1.30e+00 | -0.2196 |
| 3778 | KCNMA1 | HTA11_3361_2000001011 | Human | Colorectum | AD | 1.98e-06 | 7.27e-01 | -0.1207 |
| 3778 | KCNMA1 | HTA11_696_2000001011 | Human | Colorectum | AD | 2.61e-17 | 8.77e-01 | -0.1464 |
| 3778 | KCNMA1 | HTA11_866_2000001011 | Human | Colorectum | AD | 1.46e-13 | 9.77e-01 | -0.1001 |
| 3778 | KCNMA1 | A002-C-021 | Human | Colorectum | FAP | 2.31e-03 | 2.44e-01 | 0.1171 |
| 3778 | KCNMA1 | AEH-subject5 | Human | Endometrium | AEH | 1.78e-25 | 7.88e-01 | -0.2953 |
| 3778 | KCNMA1 | GSM5276935 | Human | Endometrium | EEC | 5.01e-04 | 2.00e-01 | -0.123 |
| 3778 | KCNMA1 | GSM5276937 | Human | Endometrium | EEC | 1.07e-11 | 3.62e-01 | -0.0897 |
| Page: 1 2 3 4 |
| Tissue | Expression Dynamics | Abbreviation |
| Breast | 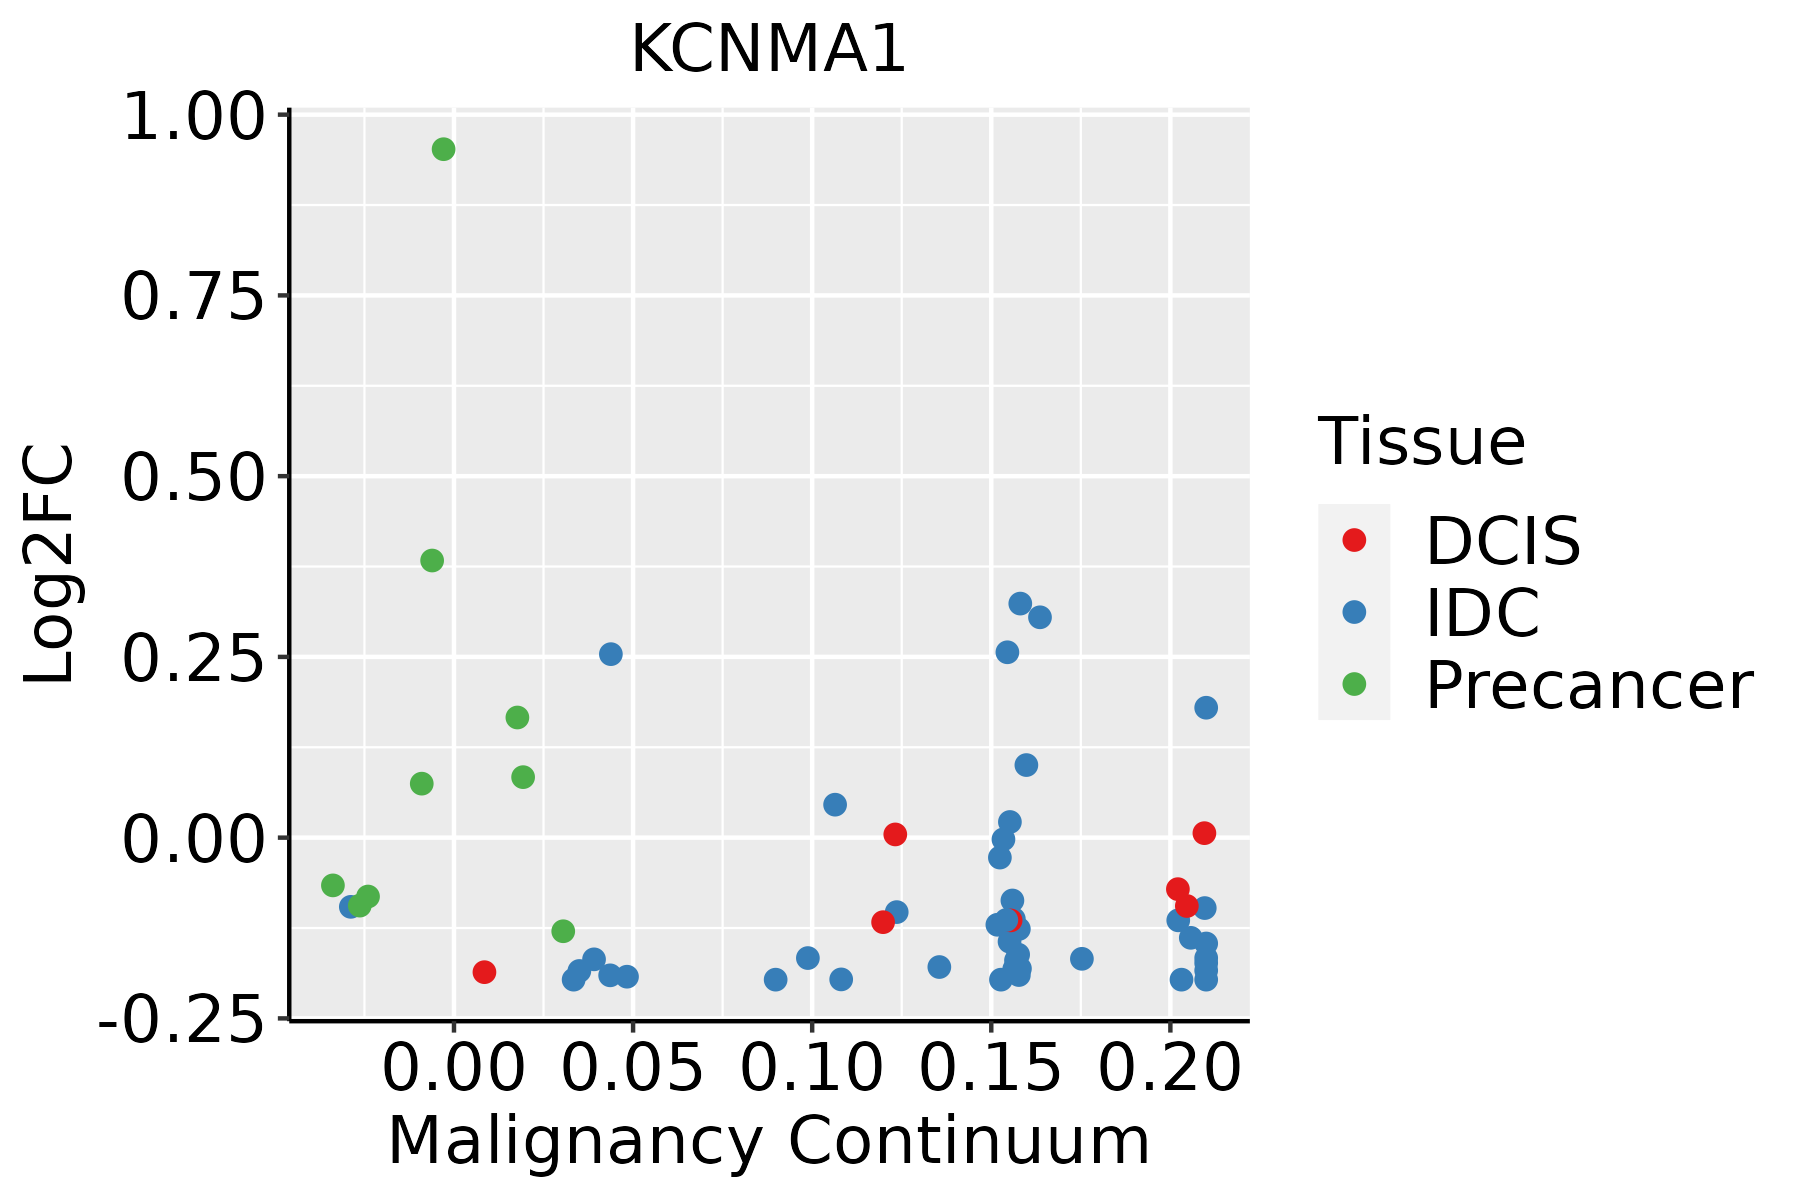 | IDC: Invasive ductal carcinoma |
| DCIS: Ductal carcinoma in situ | ||
| Precancer(BRCA1-mut): Precancerous lesion from BRCA1 mutation carriers | ||
| Colorectum (GSE201348) |  | FAP: Familial adenomatous polyposis |
| CRC: Colorectal cancer | ||
| Colorectum (HTA11) |  | AD: Adenomas |
| SER: Sessile serrated lesions | ||
| MSI-H: Microsatellite-high colorectal cancer | ||
| MSS: Microsatellite stable colorectal cancer | ||
| Endometrium |  | AEH: Atypical endometrial hyperplasia |
| EEC: Endometrioid Cancer | ||
| Esophagus | 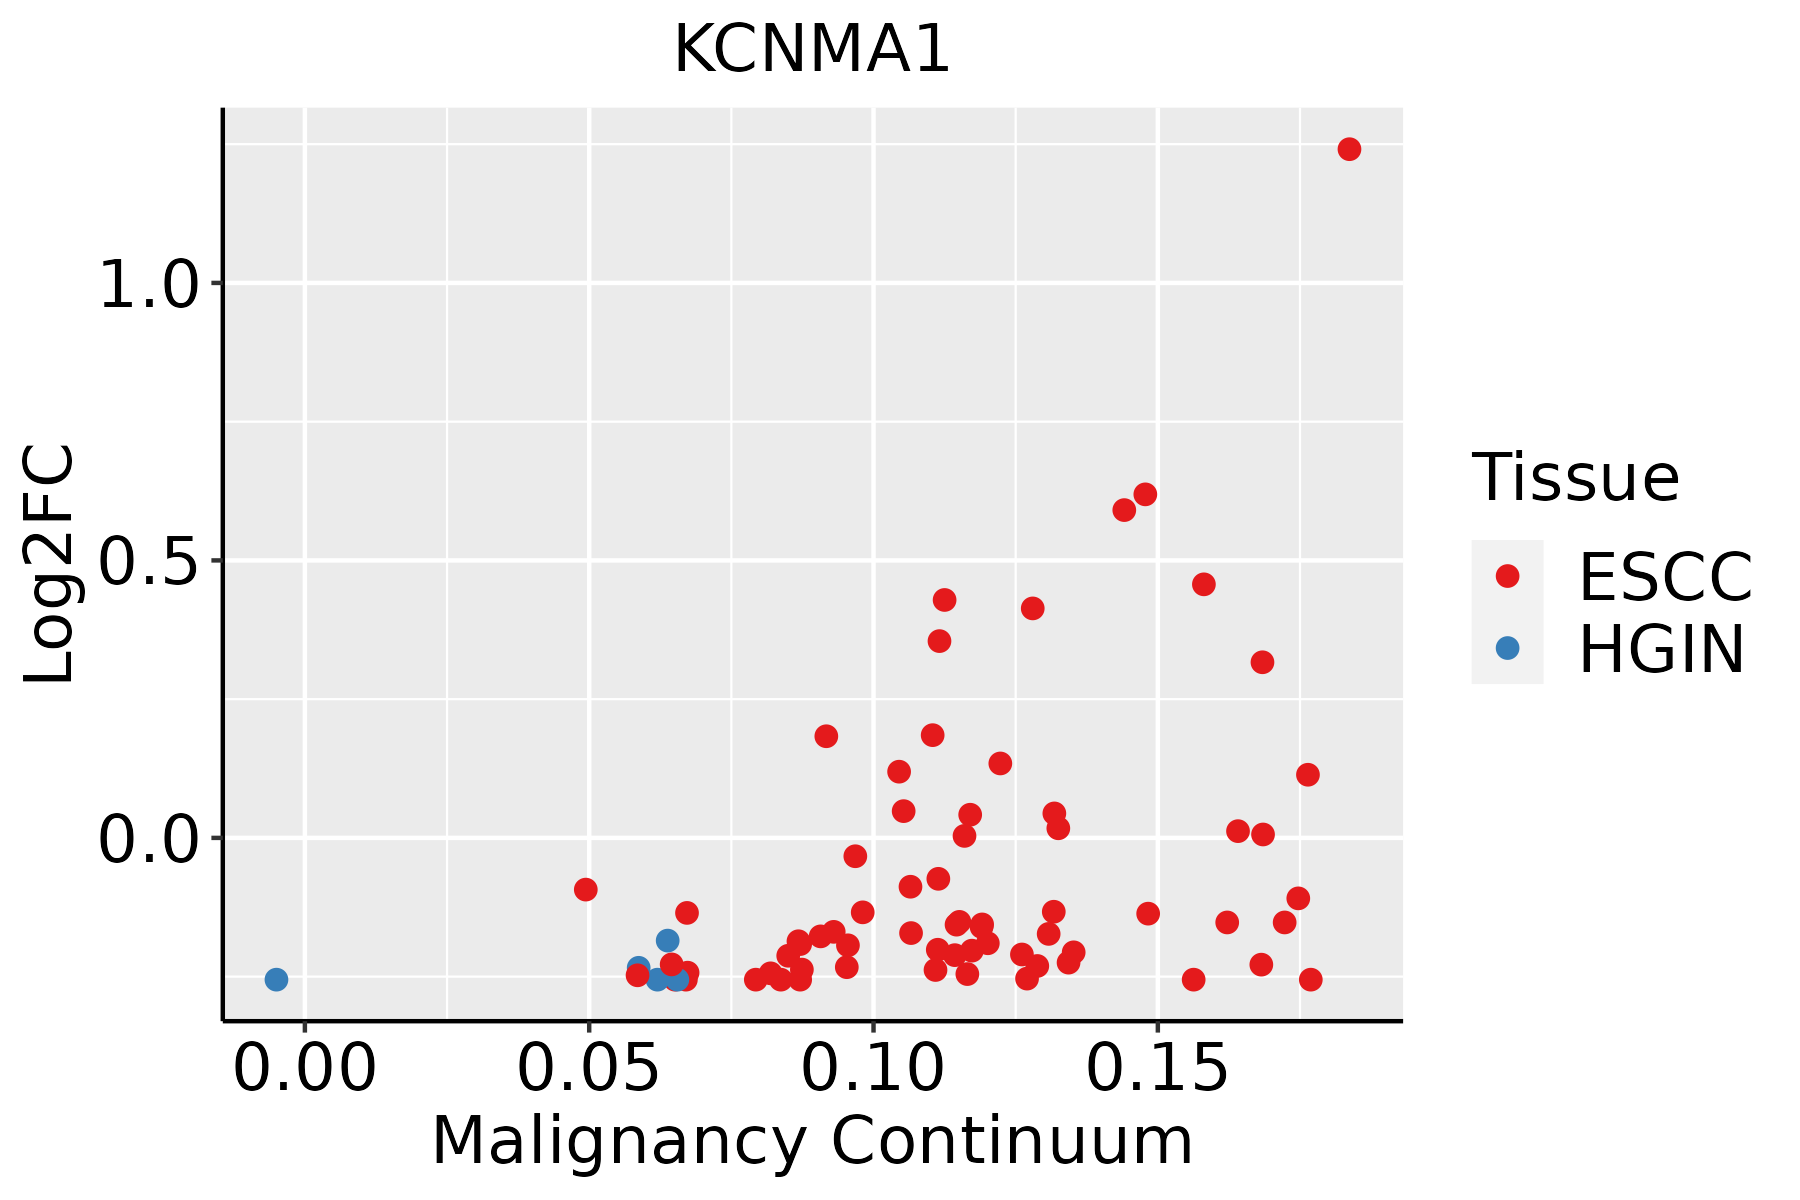 | ESCC: Esophageal squamous cell carcinoma |
| HGIN: High-grade intraepithelial neoplasias | ||
| LGIN: Low-grade intraepithelial neoplasias | ||
| Oral Cavity | 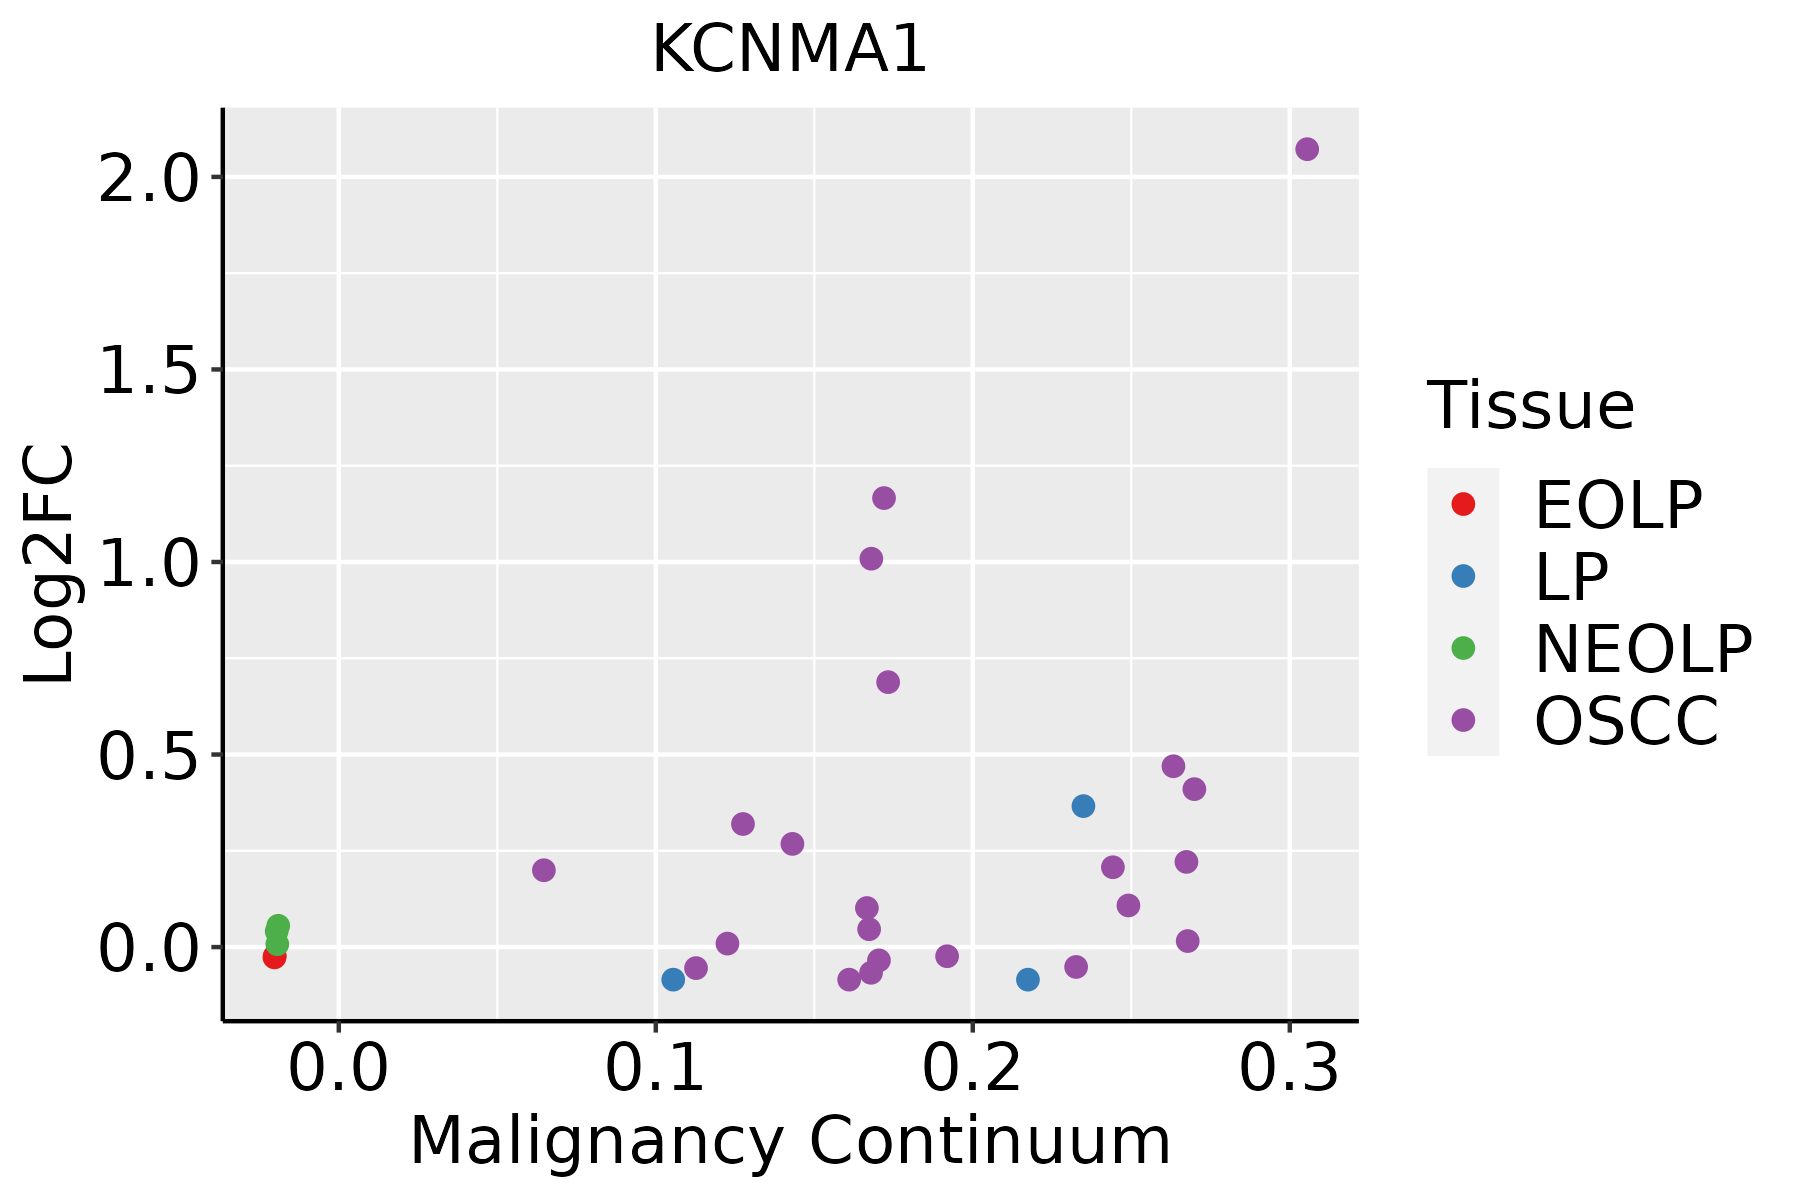 | EOLP: Erosive Oral lichen planus |
| LP: leukoplakia | ||
| NEOLP: Non-erosive oral lichen planus | ||
| OSCC: Oral squamous cell carcinoma | ||
| Skin |  | AK: Actinic keratosis |
| cSCC: Cutaneous squamous cell carcinoma | ||
| SCCIS:squamous cell carcinoma in situ | ||
| Thyroid | 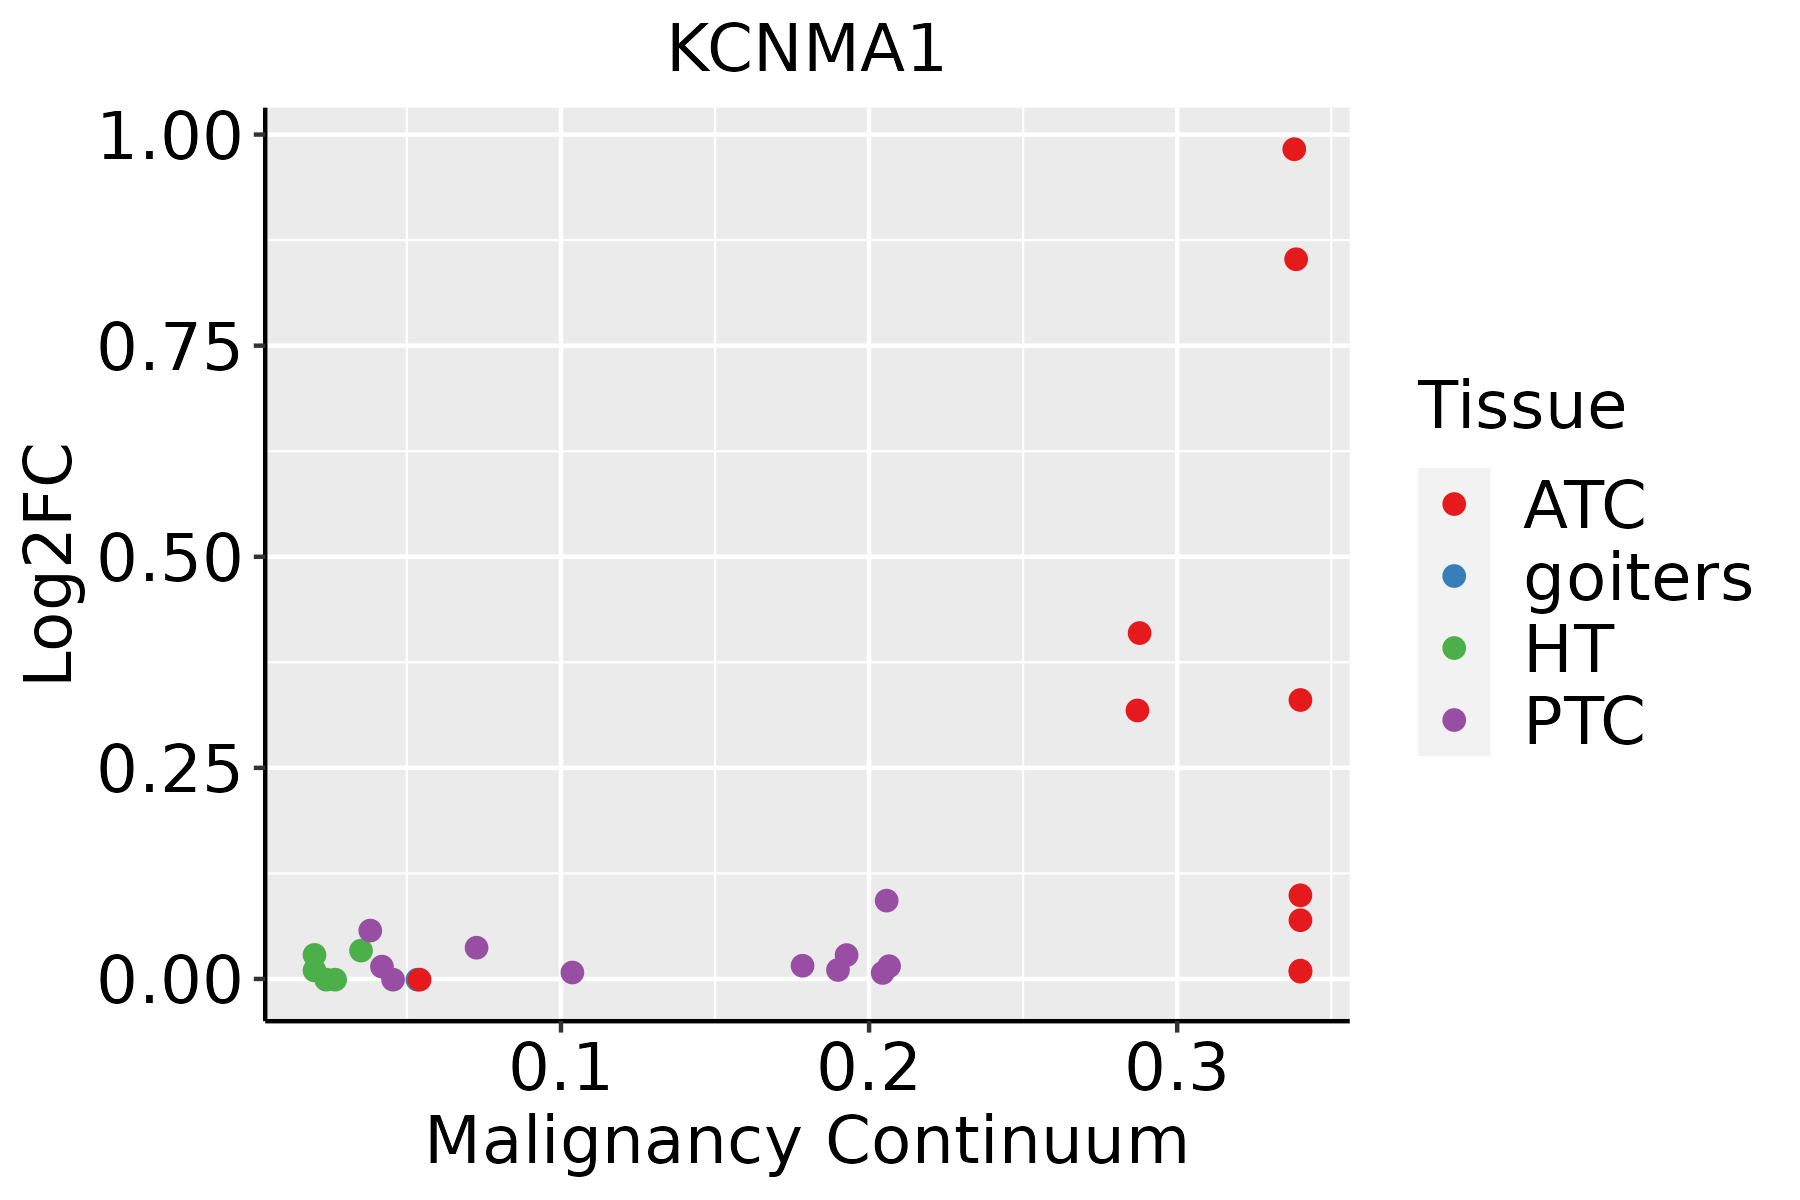 | ATC: Anaplastic thyroid cancer |
| HT: Hashimoto's thyroiditis | ||
| PTC: Papillary thyroid cancer |
| ∗log2FC in expression of this searched gene in stem-like cells from each diseased tissue sample relative to stem-like cells in normal samples in each tissue plotted against the malignancy continuum. Samples are colored based on if they are from different disease stage. |
Top |
Malignant transformation related pathway analysis |
| Find out the enriched GO biological processes and KEGG pathways involved in transition from healthy to precancer to cancer |
| Tissue | Disease Stage | Enriched GO biological Processes |
| Colorectum | AD |  |
| Colorectum | SER |  |
| Colorectum | MSS |  |
| Colorectum | MSI-H |  |
| Colorectum | FAP |  |
| ∗Top 15 enriched GO BP terms are showed in the bar plot of each disease state in each tissue. Each row represents a significant GO biological process which is colored according to the -log10(p.adjust). |
| Page: 1 2 3 4 5 6 7 8 9 |
| GO ID | Tissue | Disease Stage | Description | Gene Ratio | Bg Ratio | pvalue | p.adjust | Count |
| GO:00362939 | Breast | Precancer | response to decreased oxygen levels | 53/1080 | 322/18723 | 4.09e-12 | 6.84e-10 | 53 |
| GO:00016669 | Breast | Precancer | response to hypoxia | 51/1080 | 307/18723 | 7.33e-12 | 1.11e-09 | 51 |
| GO:00704829 | Breast | Precancer | response to oxygen levels | 55/1080 | 347/18723 | 7.47e-12 | 1.11e-09 | 55 |
| GO:00100389 | Breast | Precancer | response to metal ion | 47/1080 | 373/18723 | 3.88e-07 | 1.79e-05 | 47 |
| GO:0030007 | Breast | Precancer | cellular potassium ion homeostasis | 5/1080 | 14/18723 | 8.17e-04 | 9.55e-03 | 5 |
| GO:00515925 | Breast | Precancer | response to calcium ion | 18/1080 | 149/18723 | 2.37e-03 | 2.19e-02 | 18 |
| GO:00300046 | Breast | Precancer | cellular monovalent inorganic cation homeostasis | 13/1080 | 103/18723 | 6.26e-03 | 4.40e-02 | 13 |
| GO:007048214 | Breast | IDC | response to oxygen levels | 64/1434 | 347/18723 | 3.45e-11 | 5.57e-09 | 64 |
| GO:003629314 | Breast | IDC | response to decreased oxygen levels | 60/1434 | 322/18723 | 9.26e-11 | 1.25e-08 | 60 |
| GO:000166614 | Breast | IDC | response to hypoxia | 58/1434 | 307/18723 | 1.09e-10 | 1.38e-08 | 58 |
| GO:001003814 | Breast | IDC | response to metal ion | 65/1434 | 373/18723 | 2.95e-10 | 3.42e-08 | 65 |
| GO:00325358 | Breast | IDC | regulation of cellular component size | 45/1434 | 383/18723 | 2.72e-03 | 2.41e-02 | 45 |
| GO:00300071 | Breast | IDC | cellular potassium ion homeostasis | 5/1434 | 14/18723 | 2.92e-03 | 2.53e-02 | 5 |
| GO:00423912 | Breast | IDC | regulation of membrane potential | 49/1434 | 434/18723 | 4.04e-03 | 3.25e-02 | 49 |
| GO:005159213 | Breast | IDC | response to calcium ion | 21/1434 | 149/18723 | 4.79e-03 | 3.67e-02 | 21 |
| GO:00030125 | Breast | IDC | muscle system process | 50/1434 | 452/18723 | 5.52e-03 | 4.05e-02 | 50 |
| GO:003629323 | Breast | DCIS | response to decreased oxygen levels | 60/1390 | 322/18723 | 2.64e-11 | 4.56e-09 | 60 |
| GO:007048223 | Breast | DCIS | response to oxygen levels | 63/1390 | 347/18723 | 2.66e-11 | 4.56e-09 | 63 |
| GO:000166623 | Breast | DCIS | response to hypoxia | 58/1390 | 307/18723 | 3.19e-11 | 5.16e-09 | 58 |
| GO:001003824 | Breast | DCIS | response to metal ion | 65/1390 | 373/18723 | 8.03e-11 | 9.88e-09 | 65 |
| Page: 1 2 3 4 5 6 |
| Pathway ID | Tissue | Disease Stage | Description | Gene Ratio | Bg Ratio | pvalue | p.adjust | qvalue | Count |
| hsa049704 | Breast | IDC | Salivary secretion | 18/867 | 93/8465 | 5.69e-03 | 3.13e-02 | 2.34e-02 | 18 |
| hsa0497011 | Breast | IDC | Salivary secretion | 18/867 | 93/8465 | 5.69e-03 | 3.13e-02 | 2.34e-02 | 18 |
| hsa04972 | Colorectum | AD | Pancreatic secretion | 36/2092 | 102/8465 | 1.06e-02 | 3.98e-02 | 2.54e-02 | 36 |
| hsa049721 | Colorectum | AD | Pancreatic secretion | 36/2092 | 102/8465 | 1.06e-02 | 3.98e-02 | 2.54e-02 | 36 |
| hsa049722 | Colorectum | SER | Pancreatic secretion | 30/1580 | 102/8465 | 5.41e-03 | 3.28e-02 | 2.38e-02 | 30 |
| hsa049723 | Colorectum | SER | Pancreatic secretion | 30/1580 | 102/8465 | 5.41e-03 | 3.28e-02 | 2.38e-02 | 30 |
| hsa040222 | Colorectum | FAP | cGMP-PKG signaling pathway | 42/1404 | 167/8465 | 2.84e-03 | 1.27e-02 | 7.70e-03 | 42 |
| hsa04270 | Colorectum | FAP | Vascular smooth muscle contraction | 33/1404 | 134/8465 | 1.05e-02 | 3.74e-02 | 2.28e-02 | 33 |
| hsa04911 | Colorectum | FAP | Insulin secretion | 23/1404 | 86/8465 | 1.12e-02 | 3.92e-02 | 2.38e-02 | 23 |
| hsa040223 | Colorectum | FAP | cGMP-PKG signaling pathway | 42/1404 | 167/8465 | 2.84e-03 | 1.27e-02 | 7.70e-03 | 42 |
| hsa042701 | Colorectum | FAP | Vascular smooth muscle contraction | 33/1404 | 134/8465 | 1.05e-02 | 3.74e-02 | 2.28e-02 | 33 |
| hsa049111 | Colorectum | FAP | Insulin secretion | 23/1404 | 86/8465 | 1.12e-02 | 3.92e-02 | 2.38e-02 | 23 |
| Page: 1 |
Top |
Cell-cell communication analysis |
| Identification of potential cell-cell interactions between two cell types and their ligand-receptor pairs for different disease states |
| Ligand | Receptor | LRpair | Pathway | Tissue | Disease Stage |
| Page: 1 |
Top |
Single-cell gene regulatory network inference analysis |
| Find out the significant the regulons (TFs) and the target genes of each regulon across cell types for different disease states |
| TF | Cell Type | Tissue | Disease Stage | Target Gene | RSS | Regulon Activity |
| ∗The dot plots of a searched regulon are shown for all cell subpopulations in each disease state of each tissue based on the regulon specific score inferred using pySCENIC and by calculating the average expression. |
| Page: 1 |
Top |
Somatic mutation of malignant transformation related genes |
| Annotation of somatic variants for genes involved in malignant transformation |
| Hugo Symbol | Variant Class | Variant Classification | dbSNP RS | HGVSc | HGVSp | HGVSp Short | SWISSPROT | BIOTYPE | SIFT | PolyPhen | Tumor Sample Barcode | Tissue | Histology | Sex | Age | Stage | Therapy Types | Drugs | Outcome |
| KCNMA1 | SNV | Missense_Mutation | c.3332C>T | p.Ala1111Val | p.A1111V | Q12791 | protein_coding | deleterious(0.04) | possibly_damaging(0.877) | TCGA-AC-A23H-01 | Breast | breast invasive carcinoma | Female | >=65 | I/II | Unknown | Unknown | PD | |
| KCNMA1 | SNV | Missense_Mutation | novel | c.793N>C | p.Asn265His | p.N265H | Q12791 | protein_coding | tolerated(0.12) | benign(0.014) | TCGA-AN-A046-01 | Breast | breast invasive carcinoma | Female | >=65 | I/II | Unknown | Unknown | SD |
| KCNMA1 | SNV | Missense_Mutation | c.1585N>T | p.His529Tyr | p.H529Y | Q12791 | protein_coding | deleterious(0.01) | probably_damaging(0.999) | TCGA-BH-A0H5-01 | Breast | breast invasive carcinoma | Female | <65 | I/II | Chemotherapy | cytoxan | CR | |
| KCNMA1 | SNV | Missense_Mutation | novel | c.3481N>T | p.Ile1161Phe | p.I1161F | protein_coding | deleterious_low_confidence(0.02) | probably_damaging(0.958) | TCGA-C8-A27A-01 | Breast | breast invasive carcinoma | Female | <65 | I/II | Chemotherapy | 5-fluorouracil | CR | |
| KCNMA1 | SNV | Missense_Mutation | novel | c.3335A>G | p.Asp1112Gly | p.D1112G | Q12791 | protein_coding | tolerated(0.21) | benign(0) | TCGA-D8-A1XK-01 | Breast | breast invasive carcinoma | Female | <65 | I/II | Chemotherapy | doxorubicine+cyclophosphamide | SD |
| KCNMA1 | SNV | Missense_Mutation | c.2832C>G | p.Ile944Met | p.I944M | Q12791 | protein_coding | deleterious(0) | probably_damaging(0.933) | TCGA-D8-A1XK-01 | Breast | breast invasive carcinoma | Female | <65 | I/II | Chemotherapy | doxorubicine+cyclophosphamide | SD | |
| KCNMA1 | SNV | Missense_Mutation | c.1613N>G | p.Pro538Arg | p.P538R | Q12791 | protein_coding | deleterious(0) | probably_damaging(1) | TCGA-E2-A14R-01 | Breast | breast invasive carcinoma | Female | <65 | I/II | Chemotherapy | doxorubicin | PD | |
| KCNMA1 | SNV | Missense_Mutation | c.2714N>A | p.Thr905Lys | p.T905K | Q12791 | protein_coding | deleterious(0) | possibly_damaging(0.545) | TCGA-EW-A3U0-01 | Breast | breast invasive carcinoma | Female | <65 | III/IV | Chemotherapy | cisplatin | CR | |
| KCNMA1 | SNV | Missense_Mutation | novel | c.2186N>A | p.Arg729His | p.R729H | Q12791 | protein_coding | tolerated(0.37) | benign(0) | TCGA-LL-A5YL-01 | Breast | breast invasive carcinoma | Female | <65 | I/II | Chemotherapy | adriamycin | SD |
| KCNMA1 | SNV | Missense_Mutation | novel | c.2059N>G | p.Pro687Ala | p.P687A | Q12791 | protein_coding | tolerated(0.13) | benign(0.242) | TCGA-LL-A6FP-01 | Breast | breast invasive carcinoma | Female | >=65 | I/II | Hormone Therapy | arimidex | SD |
| Page: 1 2 3 4 5 6 7 8 9 10 11 12 13 14 15 16 17 18 19 |
Top |
Related drugs of malignant transformation related genes |
| Identification of chemicals and drugs interact with genes involved in malignant transfromation |
| (DGIdb 4.0) |
| Entrez ID | Symbol | Category | Interaction Types | Drug Claim Name | Drug Name | PMIDs |
| 3778 | KCNMA1 | DRUGGABLE GENOME, ION CHANNEL | activator | CHEMBL119549 | ANDOLAST | |
| 3778 | KCNMA1 | DRUGGABLE GENOME, ION CHANNEL | blocker | 178101035 | ||
| 3778 | KCNMA1 | DRUGGABLE GENOME, ION CHANNEL | activator | 178101089 | CHEMBL1290115 | |
| 3778 | KCNMA1 | DRUGGABLE GENOME, ION CHANNEL | activator | 135651381 | ||
| 3778 | KCNMA1 | DRUGGABLE GENOME, ION CHANNEL | CHLORZOXAZONE | CHLORZOXAZONE | ||
| 3778 | KCNMA1 | DRUGGABLE GENOME, ION CHANNEL | activator | 178101088 | ||
| 3778 | KCNMA1 | DRUGGABLE GENOME, ION CHANNEL | activator | 135650743 | ||
| 3778 | KCNMA1 | DRUGGABLE GENOME, ION CHANNEL | TRICHLORMETHIAZIDE | TRICHLORMETHIAZIDE | ||
| 3778 | KCNMA1 | DRUGGABLE GENOME, ION CHANNEL | ENFLURANE | ENFLURANE | ||
| 3778 | KCNMA1 | DRUGGABLE GENOME, ION CHANNEL | blocker | 135651249 |
| Page: 1 2 3 |

Copyright 2023-Present -The University of Texas Health Science Center at Houston |