
|
|||||
|
 | |
| |
| |
| |
| |
| |
|
Gene: KCNK6 |
Gene summary for KCNK6 |
| Gene information | Species | Human | Gene symbol | KCNK6 | Gene ID | 9424 |
| Gene name | potassium two pore domain channel subfamily K member 6 | |
| Gene Alias | K2p6.1 | |
| Cytomap | 19q13.2 | |
| Gene Type | protein-coding | GO ID | GO:0003008 | UniProtAcc | B2RDS2 |
Top |
Malignant transformation analysis |
| Identification of the aberrant gene expression in precancerous and cancerous lesions by comparing the gene expression of stem-like cells in diseased tissues with normal stem cells |
| Entrez ID | Symbol | Replicates | Species | Organ | Tissue | Adj P-value | Log2FC | Malignancy |
| 9424 | KCNK6 | GSM4909286 | Human | Breast | IDC | 1.57e-03 | -1.41e-01 | 0.1081 |
| 9424 | KCNK6 | GSM4909298 | Human | Breast | IDC | 3.38e-06 | 2.54e-01 | 0.1551 |
| 9424 | KCNK6 | GSM4909301 | Human | Breast | IDC | 3.59e-28 | 7.97e-01 | 0.1577 |
| 9424 | KCNK6 | GSM4909304 | Human | Breast | IDC | 7.42e-04 | 2.82e-01 | 0.1636 |
| 9424 | KCNK6 | GSM4909306 | Human | Breast | IDC | 3.39e-03 | 2.84e-01 | 0.1564 |
| 9424 | KCNK6 | GSM4909308 | Human | Breast | IDC | 2.06e-11 | 3.41e-01 | 0.158 |
| 9424 | KCNK6 | GSM4909311 | Human | Breast | IDC | 2.15e-05 | 2.26e-01 | 0.1534 |
| 9424 | KCNK6 | GSM4909312 | Human | Breast | IDC | 1.65e-21 | 6.83e-01 | 0.1552 |
| 9424 | KCNK6 | GSM4909317 | Human | Breast | IDC | 5.36e-05 | 1.69e-01 | 0.1355 |
| 9424 | KCNK6 | GSM4909319 | Human | Breast | IDC | 1.07e-06 | 1.09e-01 | 0.1563 |
| 9424 | KCNK6 | M1 | Human | Breast | IDC | 1.33e-08 | 2.97e-01 | 0.1577 |
| 9424 | KCNK6 | DCIS2 | Human | Breast | DCIS | 5.20e-12 | -2.38e-02 | 0.0085 |
| 9424 | KCNK6 | HTA11_2487_2000001011 | Human | Colorectum | SER | 2.93e-10 | 5.16e-01 | -0.1808 |
| 9424 | KCNK6 | HTA11_1938_2000001011 | Human | Colorectum | AD | 1.04e-08 | 3.96e-01 | -0.0811 |
| 9424 | KCNK6 | HTA11_78_2000001011 | Human | Colorectum | AD | 9.01e-07 | 3.55e-01 | -0.1088 |
| 9424 | KCNK6 | HTA11_347_2000001011 | Human | Colorectum | AD | 1.78e-08 | 3.48e-01 | -0.1954 |
| 9424 | KCNK6 | HTA11_411_2000001011 | Human | Colorectum | SER | 3.96e-02 | 7.15e-01 | -0.2602 |
| 9424 | KCNK6 | HTA11_2112_2000001011 | Human | Colorectum | SER | 9.14e-04 | 8.88e-01 | -0.2196 |
| 9424 | KCNK6 | HTA11_696_2000001011 | Human | Colorectum | AD | 1.51e-21 | 5.32e-01 | -0.1464 |
| 9424 | KCNK6 | HTA11_866_2000001011 | Human | Colorectum | AD | 5.49e-06 | 2.43e-01 | -0.1001 |
| Page: 1 2 3 4 5 6 |
| Tissue | Expression Dynamics | Abbreviation |
| Breast | 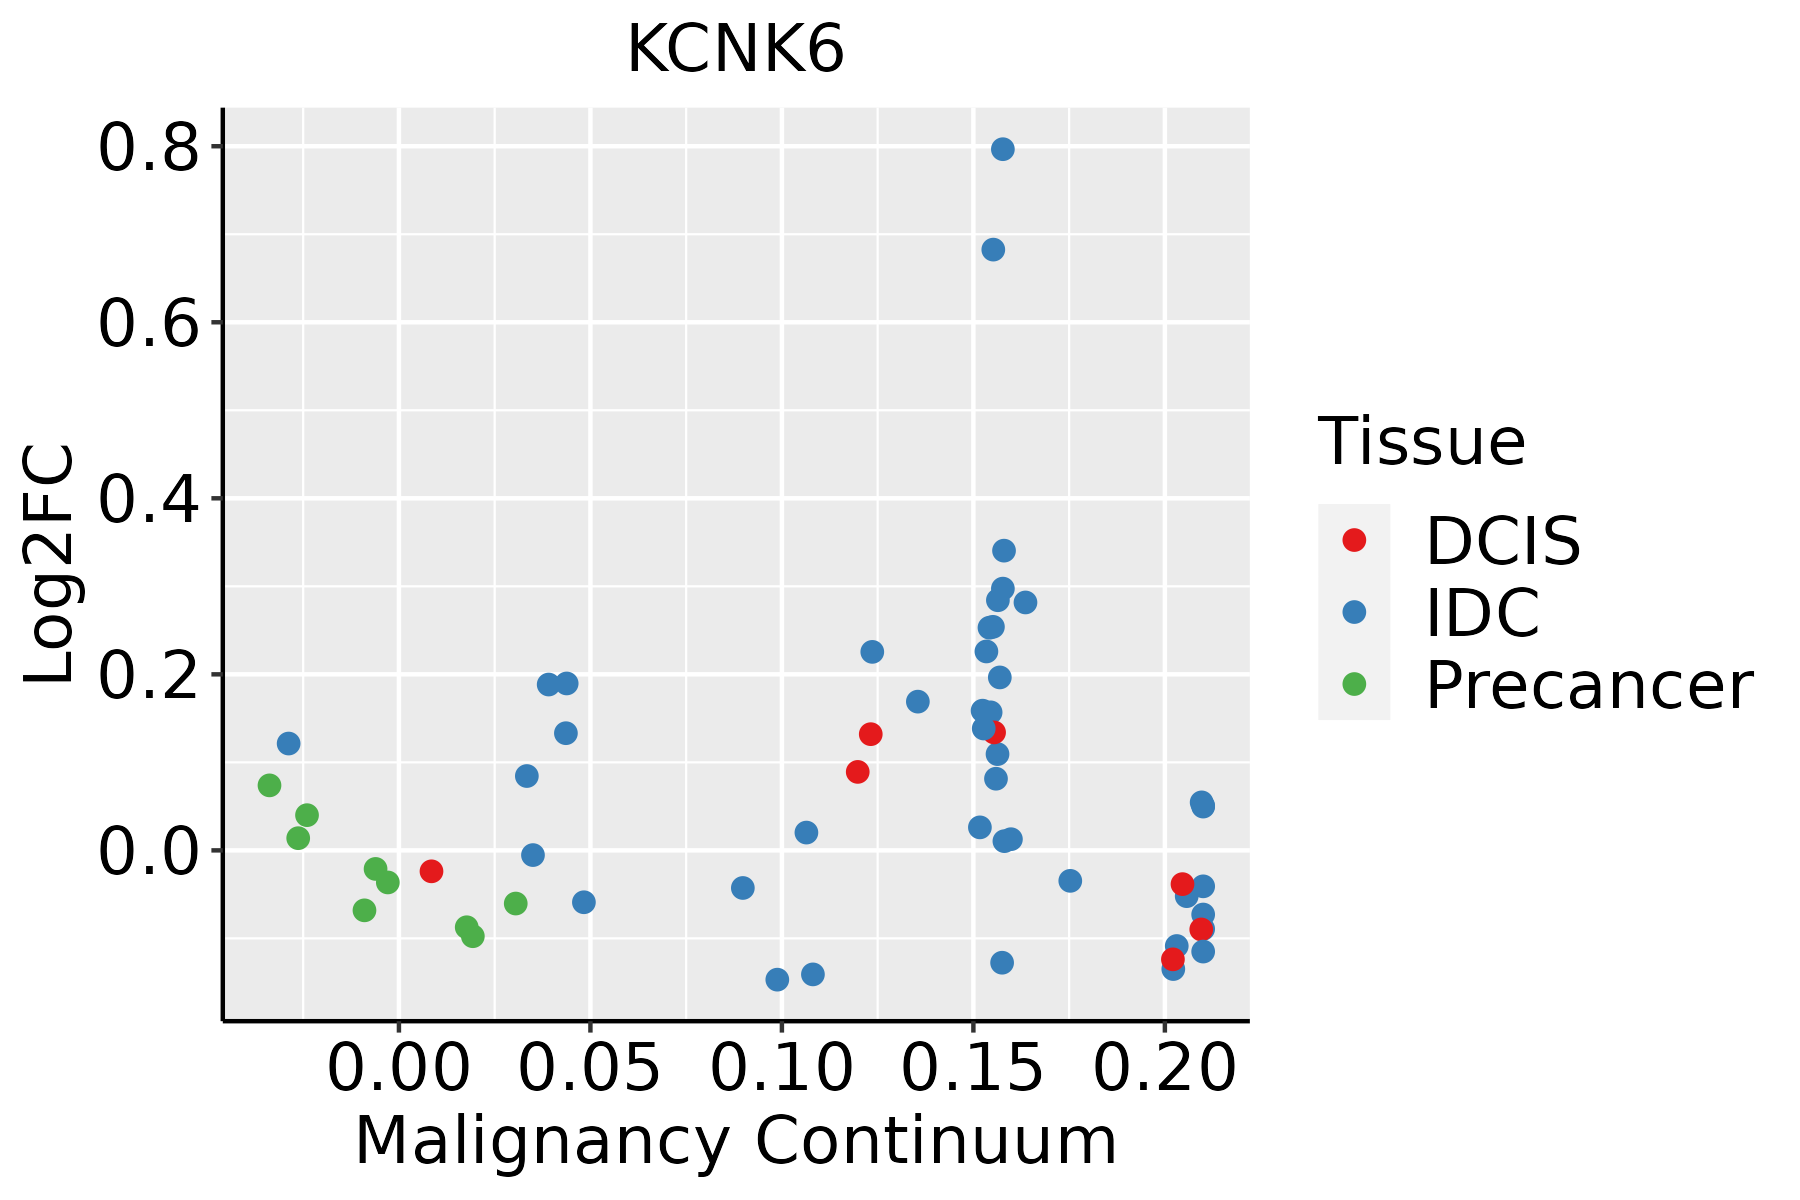 | IDC: Invasive ductal carcinoma |
| DCIS: Ductal carcinoma in situ | ||
| Precancer(BRCA1-mut): Precancerous lesion from BRCA1 mutation carriers | ||
| Colorectum (GSE201348) |  | FAP: Familial adenomatous polyposis |
| CRC: Colorectal cancer | ||
| Colorectum (HTA11) |  | AD: Adenomas |
| SER: Sessile serrated lesions | ||
| MSI-H: Microsatellite-high colorectal cancer | ||
| MSS: Microsatellite stable colorectal cancer | ||
| Esophagus | 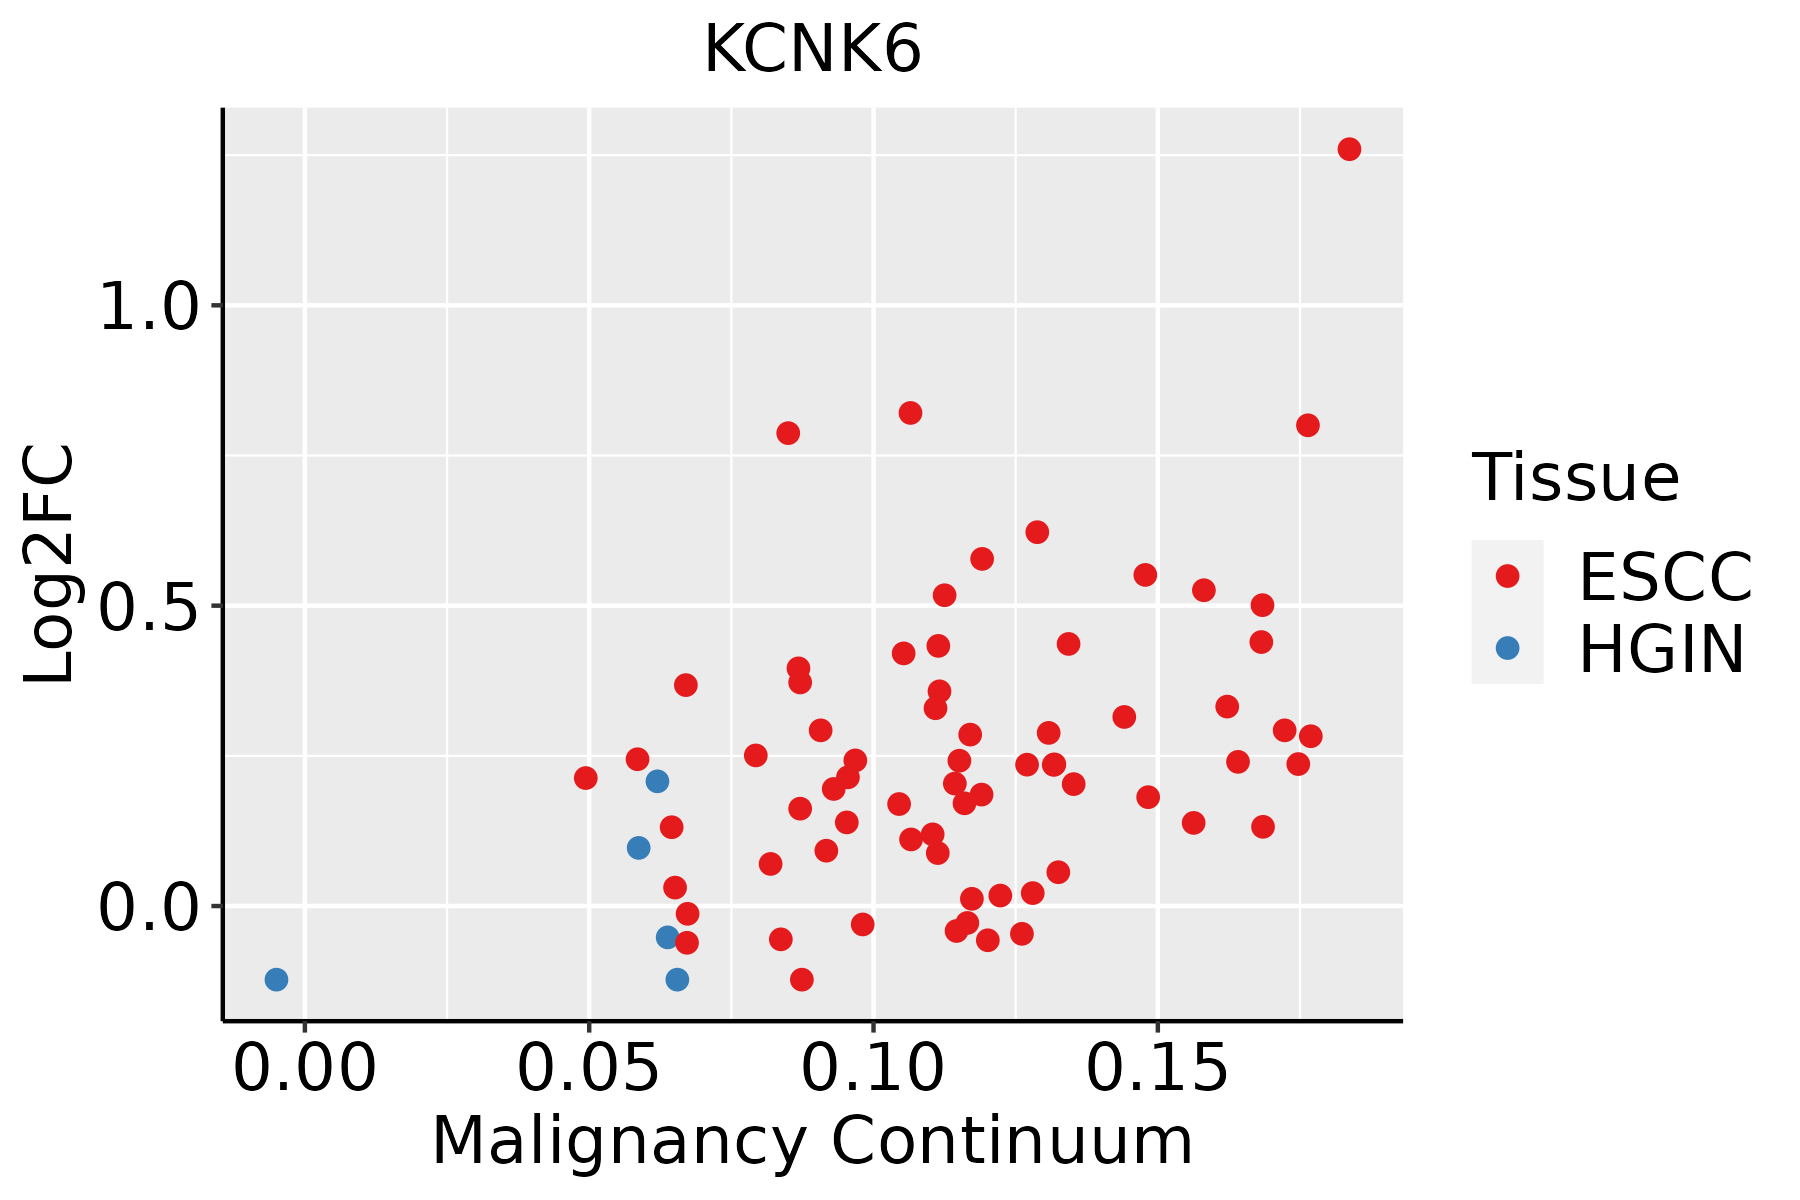 | ESCC: Esophageal squamous cell carcinoma |
| HGIN: High-grade intraepithelial neoplasias | ||
| LGIN: Low-grade intraepithelial neoplasias | ||
| Oral Cavity |  | EOLP: Erosive Oral lichen planus |
| LP: leukoplakia | ||
| NEOLP: Non-erosive oral lichen planus | ||
| OSCC: Oral squamous cell carcinoma | ||
| Skin | 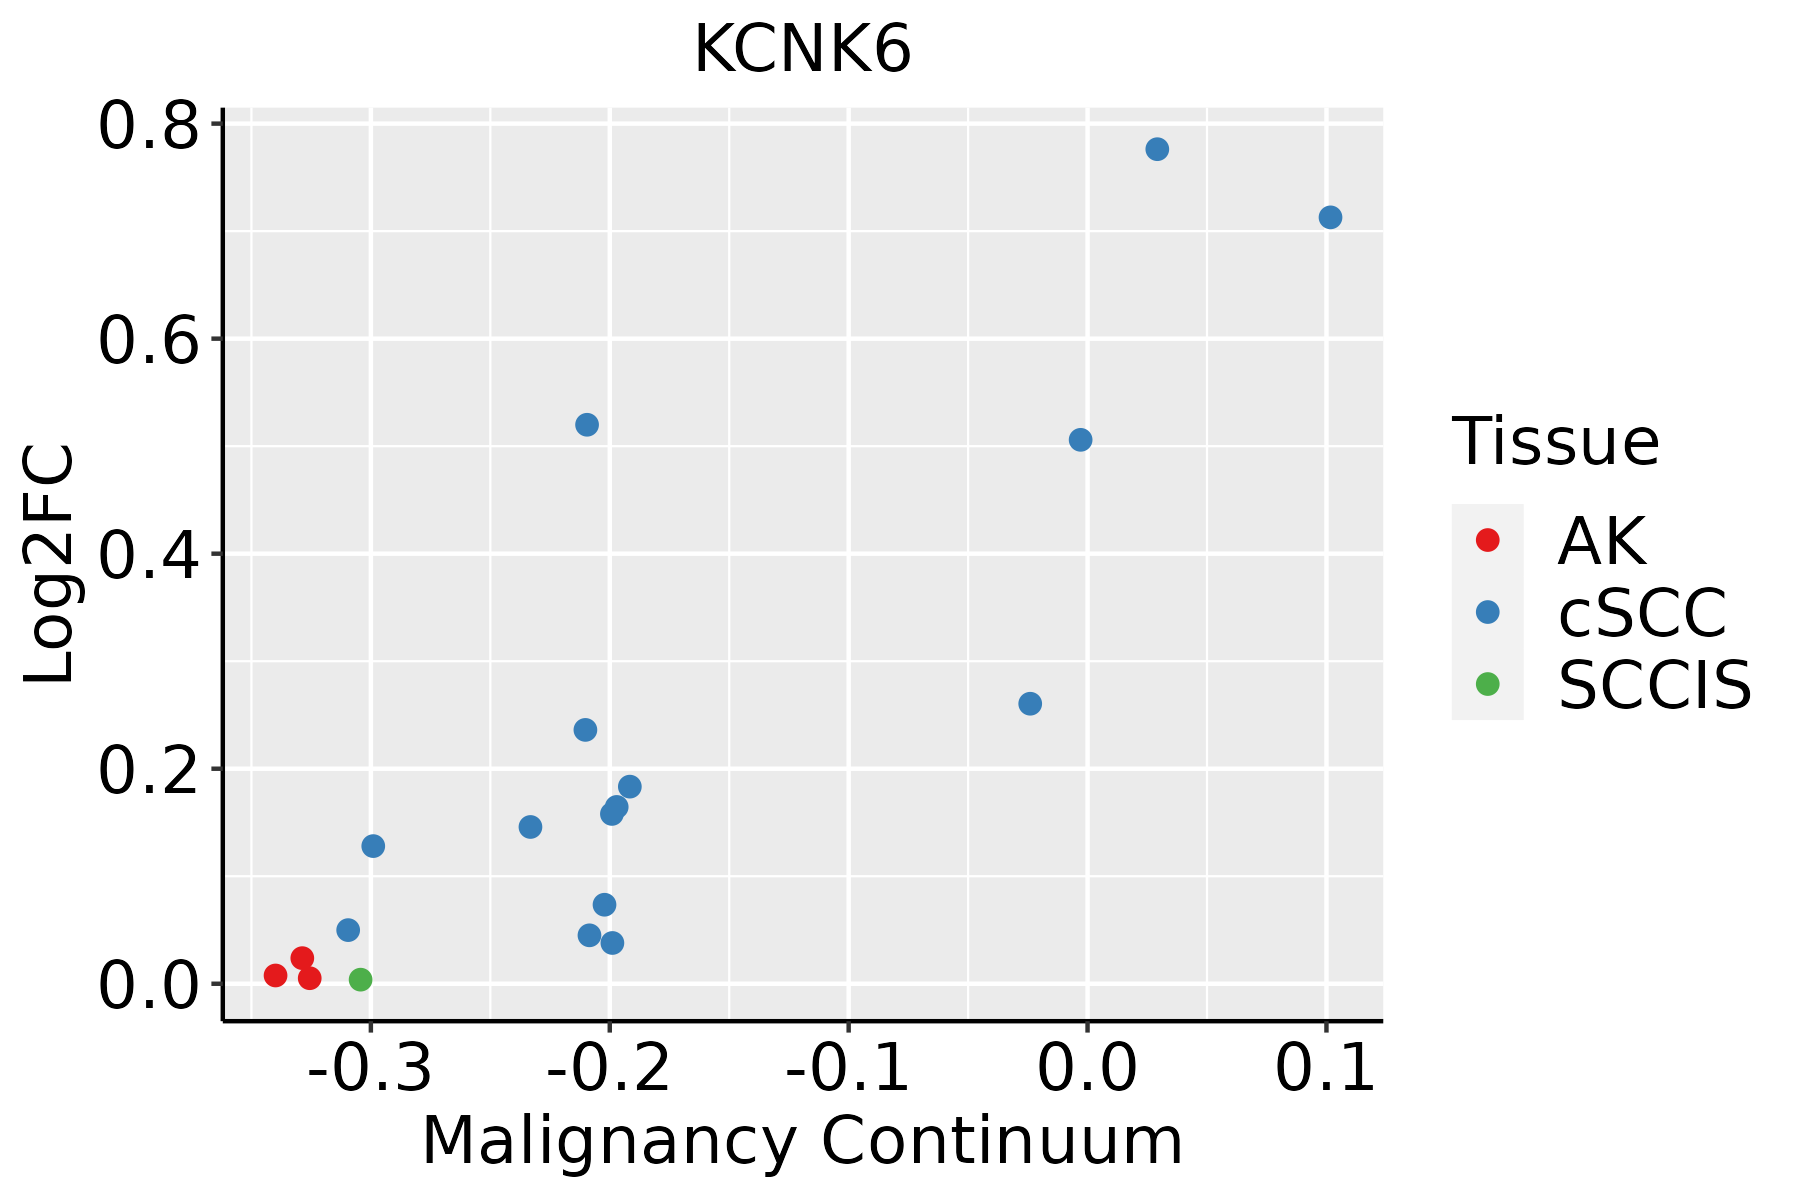 | AK: Actinic keratosis |
| cSCC: Cutaneous squamous cell carcinoma | ||
| SCCIS:squamous cell carcinoma in situ | ||
| Thyroid | 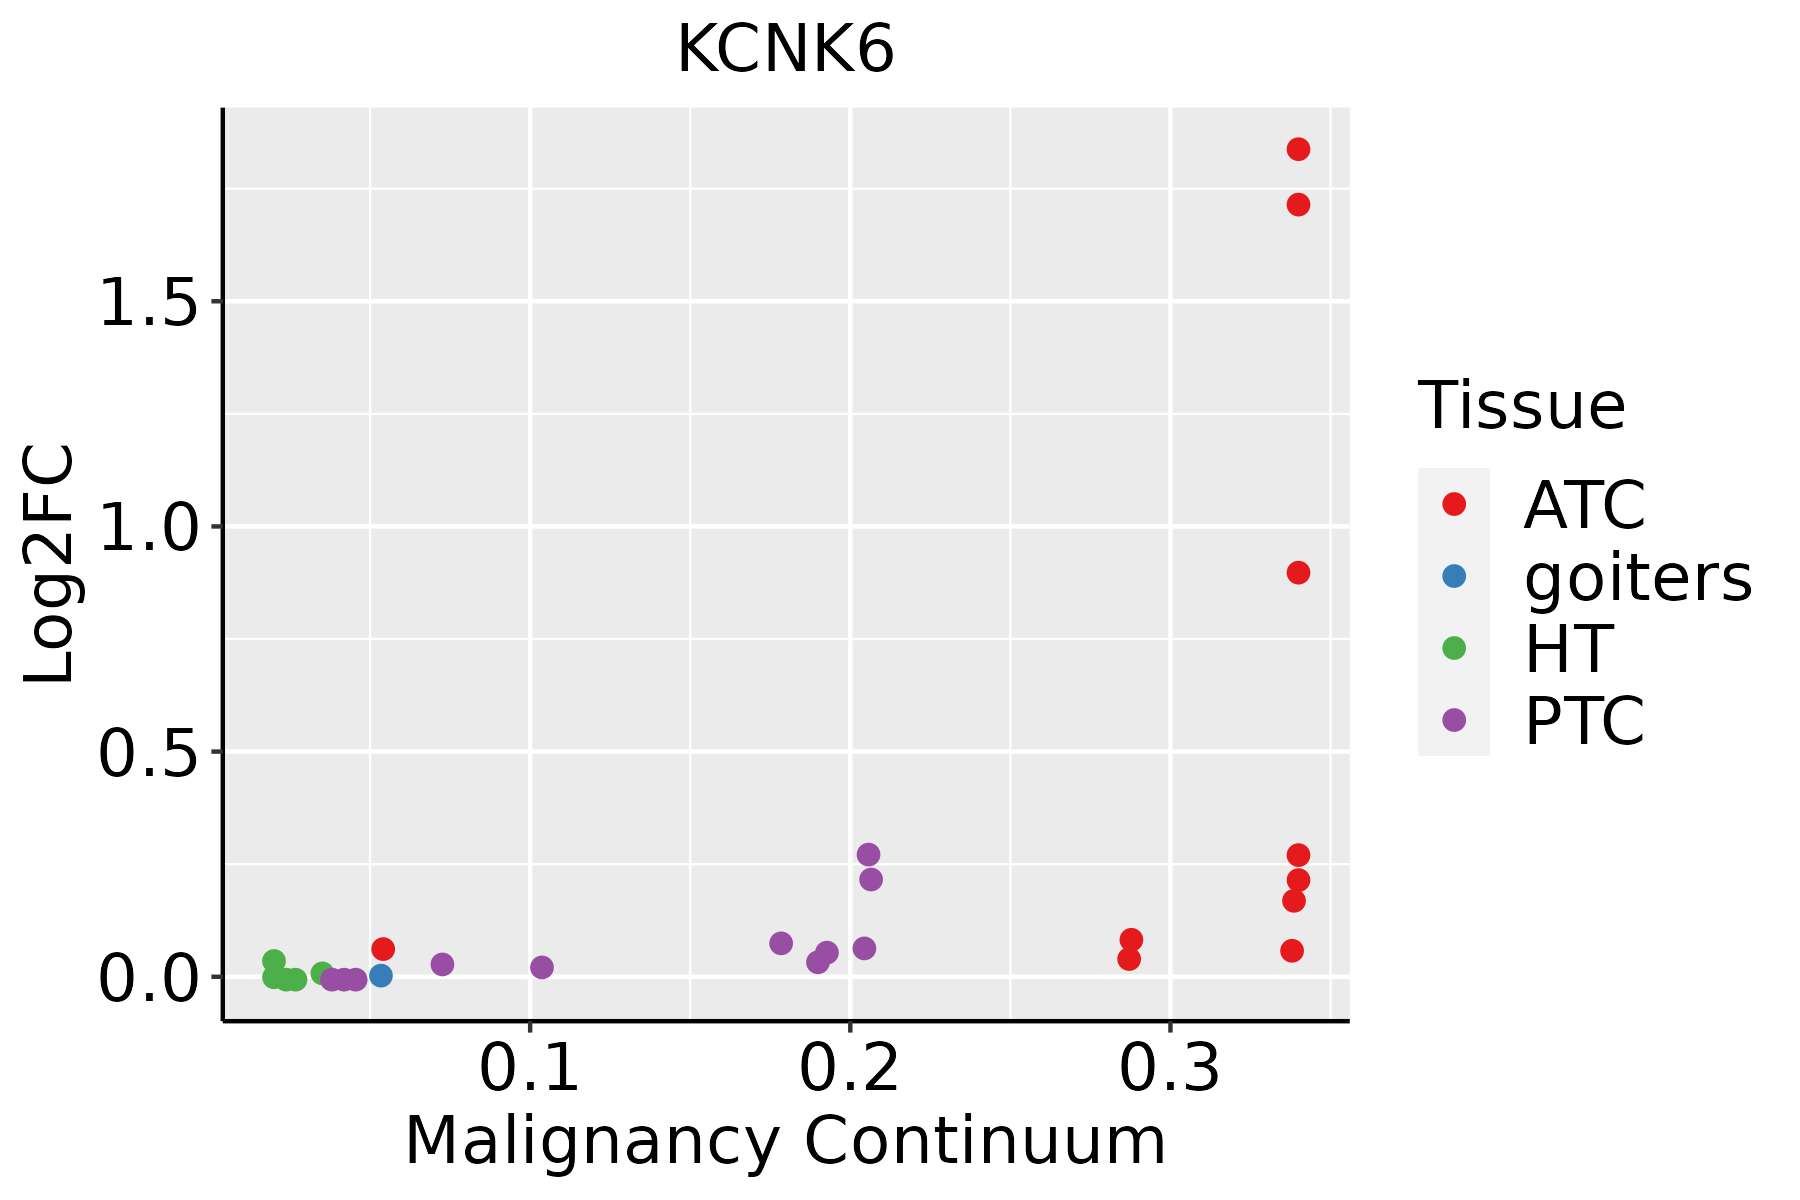 | ATC: Anaplastic thyroid cancer |
| HT: Hashimoto's thyroiditis | ||
| PTC: Papillary thyroid cancer |
| ∗log2FC in expression of this searched gene in stem-like cells from each diseased tissue sample relative to stem-like cells in normal samples in each tissue plotted against the malignancy continuum. Samples are colored based on if they are from different disease stage. |
Top |
Malignant transformation related pathway analysis |
| Find out the enriched GO biological processes and KEGG pathways involved in transition from healthy to precancer to cancer |
| Tissue | Disease Stage | Enriched GO biological Processes |
| Colorectum | AD |  |
| Colorectum | SER |  |
| Colorectum | MSS |  |
| Colorectum | MSI-H |  |
| Colorectum | FAP |  |
| ∗Top 15 enriched GO BP terms are showed in the bar plot of each disease state in each tissue. Each row represents a significant GO biological process which is colored according to the -log10(p.adjust). |
| Page: 1 2 3 4 5 6 7 8 9 |
| GO ID | Tissue | Disease Stage | Description | Gene Ratio | Bg Ratio | pvalue | p.adjust | Count |
| GO:00423912 | Breast | IDC | regulation of membrane potential | 49/1434 | 434/18723 | 4.04e-03 | 3.25e-02 | 49 |
| GO:00423911 | Breast | DCIS | regulation of membrane potential | 47/1390 | 434/18723 | 5.87e-03 | 4.20e-02 | 47 |
| Page: 1 |
| Pathway ID | Tissue | Disease Stage | Description | Gene Ratio | Bg Ratio | pvalue | p.adjust | qvalue | Count |
| Page: 1 |
Top |
Cell-cell communication analysis |
| Identification of potential cell-cell interactions between two cell types and their ligand-receptor pairs for different disease states |
| Ligand | Receptor | LRpair | Pathway | Tissue | Disease Stage |
| Page: 1 |
Top |
Single-cell gene regulatory network inference analysis |
| Find out the significant the regulons (TFs) and the target genes of each regulon across cell types for different disease states |
| TF | Cell Type | Tissue | Disease Stage | Target Gene | RSS | Regulon Activity |
| ∗The dot plots of a searched regulon are shown for all cell subpopulations in each disease state of each tissue based on the regulon specific score inferred using pySCENIC and by calculating the average expression. |
| Page: 1 |
Top |
Somatic mutation of malignant transformation related genes |
| Annotation of somatic variants for genes involved in malignant transformation |
| Hugo Symbol | Variant Class | Variant Classification | dbSNP RS | HGVSc | HGVSp | HGVSp Short | SWISSPROT | BIOTYPE | SIFT | PolyPhen | Tumor Sample Barcode | Tissue | Histology | Sex | Age | Stage | Therapy Types | Drugs | Outcome |
| KCNK6 | SNV | Missense_Mutation | c.701N>G | p.Tyr234Cys | p.Y234C | Q9Y257 | protein_coding | deleterious(0) | probably_damaging(0.999) | TCGA-AC-A2QI-01 | Breast | breast invasive carcinoma | Female | >=65 | III/IV | Chemotherapy | cytoxan | CR | |
| KCNK6 | insertion | Frame_Shift_Ins | novel | c.478_479insTCTTT | p.Arg160LeufsTer23 | p.R160Lfs*23 | Q9Y257 | protein_coding | TCGA-A2-A0CQ-01 | Breast | breast invasive carcinoma | Female | <65 | I/II | Chemotherapy | adriamycin | SD | ||
| KCNK6 | deletion | Frame_Shift_Del | novel | c.545delN | p.Val183SerfsTer8 | p.V183Sfs*8 | Q9Y257 | protein_coding | TCGA-D8-A27V-01 | Breast | breast invasive carcinoma | Female | <65 | I/II | Hormone Therapy | tamoxiphen | SD | ||
| KCNK6 | SNV | Missense_Mutation | c.929C>T | p.Ser310Phe | p.S310F | Q9Y257 | protein_coding | deleterious(0) | possibly_damaging(0.825) | TCGA-DG-A2KH-01 | Cervix | cervical & endocervical cancer | Female | <65 | I/II | Unknown | Unknown | SD | |
| KCNK6 | SNV | Missense_Mutation | novel | c.556N>G | p.Leu186Val | p.L186V | Q9Y257 | protein_coding | tolerated(0.19) | possibly_damaging(0.773) | TCGA-VS-A9V1-01 | Cervix | cervical & endocervical cancer | Female | <65 | I/II | Chemotherapy | cisplatin | PD |
| KCNK6 | SNV | Missense_Mutation | rs759005709 | c.506N>T | p.Ala169Val | p.A169V | Q9Y257 | protein_coding | deleterious(0) | possibly_damaging(0.54) | TCGA-AA-3710-01 | Colorectum | colon adenocarcinoma | Female | >=65 | I/II | Unknown | Unknown | SD |
| KCNK6 | SNV | Missense_Mutation | rs567646784 | c.539T>C | p.Val180Ala | p.V180A | Q9Y257 | protein_coding | tolerated(0.15) | benign(0.259) | TCGA-AA-3864-01 | Colorectum | colon adenocarcinoma | Male | >=65 | I/II | Unknown | Unknown | SD |
| KCNK6 | SNV | Missense_Mutation | novel | c.785N>C | p.Leu262Pro | p.L262P | Q9Y257 | protein_coding | deleterious(0) | probably_damaging(0.993) | TCGA-CM-4743-01 | Colorectum | colon adenocarcinoma | Male | >=65 | I/II | Chemotherapy | capecitabine | SD |
| KCNK6 | SNV | Missense_Mutation | rs762305005 | c.769C>T | p.Arg257Cys | p.R257C | Q9Y257 | protein_coding | tolerated(0.1) | benign(0.009) | TCGA-A5-A0G2-01 | Endometrium | uterine corpus endometrioid carcinoma | Female | <65 | III/IV | Unknown | Unknown | SD |
| KCNK6 | SNV | Missense_Mutation | novel | c.624C>G | p.Cys208Trp | p.C208W | Q9Y257 | protein_coding | deleterious(0) | probably_damaging(1) | TCGA-AJ-A2QM-01 | Endometrium | uterine corpus endometrioid carcinoma | Female | >=65 | I/II | Chemotherapy | carboplatin | CR |
| Page: 1 2 3 |
Top |
Related drugs of malignant transformation related genes |
| Identification of chemicals and drugs interact with genes involved in malignant transfromation |
| (DGIdb 4.0) |
| Entrez ID | Symbol | Category | Interaction Types | Drug Claim Name | Drug Name | PMIDs |
| Page: 1 |

Copyright 2023-Present -The University of Texas Health Science Center at Houston |