
|
|||||
|
 | |
| |
| |
| |
| |
| |
|
Gene: KCNK15 |
Gene summary for KCNK15 |
| Gene information | Species | Human | Gene symbol | KCNK15 | Gene ID | 60598 |
| Gene name | potassium two pore domain channel subfamily K member 15 | |
| Gene Alias | K2p15.1 | |
| Cytomap | 20q13.12 | |
| Gene Type | protein-coding | GO ID | GO:0006810 | UniProtAcc | Q9H427 |
Top |
Malignant transformation analysis |
| Identification of the aberrant gene expression in precancerous and cancerous lesions by comparing the gene expression of stem-like cells in diseased tissues with normal stem cells |
| Entrez ID | Symbol | Replicates | Species | Organ | Tissue | Adj P-value | Log2FC | Malignancy |
| 60598 | KCNK15 | GSM4909298 | Human | Breast | IDC | 1.94e-11 | 2.45e-01 | 0.1551 |
| 60598 | KCNK15 | GSM4909301 | Human | Breast | IDC | 8.60e-04 | 1.90e-01 | 0.1577 |
| 60598 | KCNK15 | GSM4909304 | Human | Breast | IDC | 1.43e-35 | 6.14e-01 | 0.1636 |
| 60598 | KCNK15 | GSM4909307 | Human | Breast | IDC | 1.26e-04 | 2.05e-01 | 0.1569 |
| 60598 | KCNK15 | GSM4909308 | Human | Breast | IDC | 2.62e-04 | 1.49e-01 | 0.158 |
| 60598 | KCNK15 | GSM4909309 | Human | Breast | IDC | 1.84e-09 | 4.02e-01 | 0.0483 |
| 60598 | KCNK15 | GSM4909317 | Human | Breast | IDC | 2.00e-09 | 2.26e-01 | 0.1355 |
| 60598 | KCNK15 | GSM4909321 | Human | Breast | IDC | 4.27e-14 | 4.72e-01 | 0.1559 |
| 60598 | KCNK15 | P3 | Human | Breast | IDC | 4.46e-13 | 6.77e-01 | 0.1542 |
| 60598 | KCNK15 | male-WTA | Human | Thyroid | PTC | 2.61e-10 | 1.20e-01 | 0.1037 |
| 60598 | KCNK15 | PTC01 | Human | Thyroid | PTC | 7.43e-16 | 3.04e-01 | 0.1899 |
| 60598 | KCNK15 | PTC04 | Human | Thyroid | PTC | 4.11e-02 | 1.24e-01 | 0.1927 |
| 60598 | KCNK15 | PTC05 | Human | Thyroid | PTC | 1.26e-10 | 5.45e-01 | 0.2065 |
| 60598 | KCNK15 | PTC06 | Human | Thyroid | PTC | 1.39e-20 | 5.75e-01 | 0.2057 |
| 60598 | KCNK15 | PTC07 | Human | Thyroid | PTC | 1.85e-16 | 3.80e-01 | 0.2044 |
| Page: 1 |
| Tissue | Expression Dynamics | Abbreviation |
| Breast | 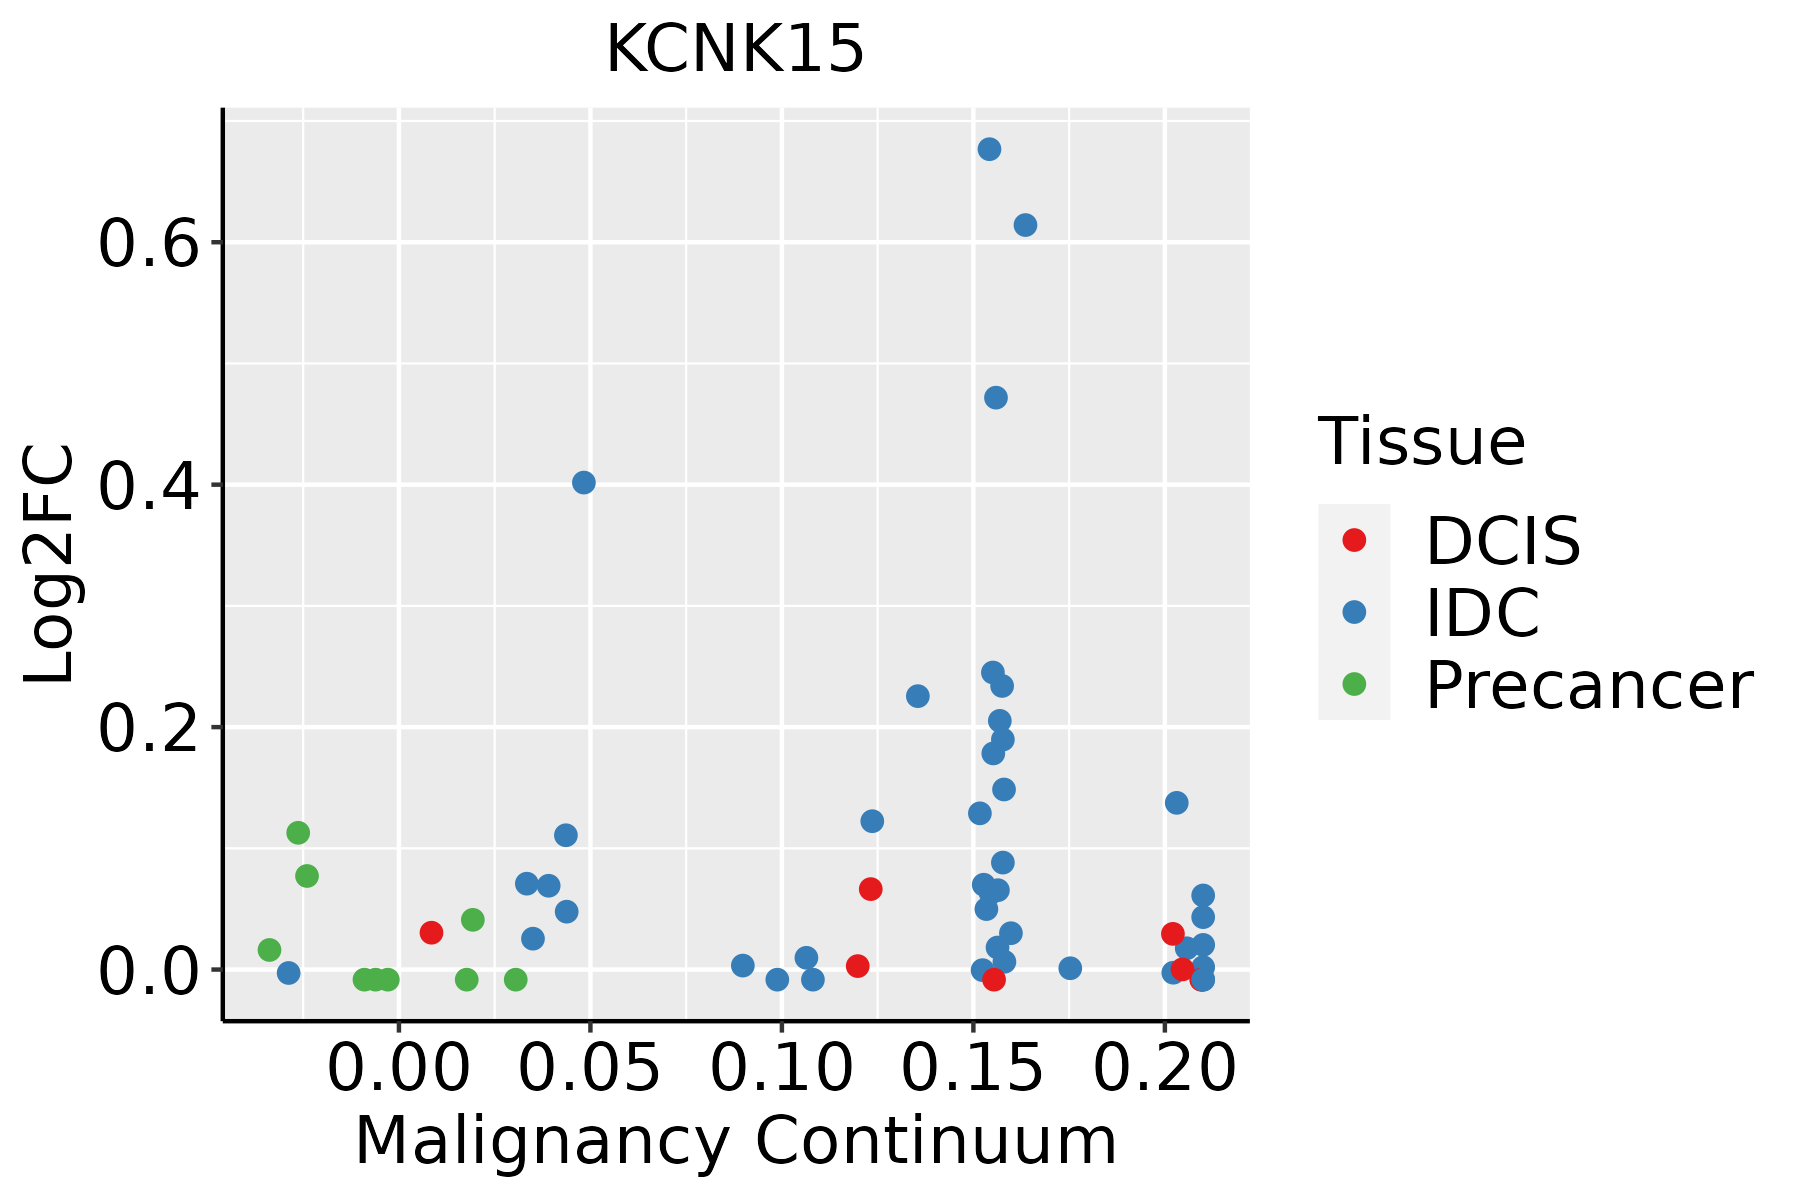 | IDC: Invasive ductal carcinoma |
| DCIS: Ductal carcinoma in situ | ||
| Precancer(BRCA1-mut): Precancerous lesion from BRCA1 mutation carriers | ||
| Thyroid |  | ATC: Anaplastic thyroid cancer |
| HT: Hashimoto's thyroiditis | ||
| PTC: Papillary thyroid cancer |
| ∗log2FC in expression of this searched gene in stem-like cells from each diseased tissue sample relative to stem-like cells in normal samples in each tissue plotted against the malignancy continuum. Samples are colored based on if they are from different disease stage. |
Top |
Malignant transformation related pathway analysis |
| Find out the enriched GO biological processes and KEGG pathways involved in transition from healthy to precancer to cancer |
| Tissue | Disease Stage | Enriched GO biological Processes |
| Colorectum | AD |  |
| Colorectum | SER |  |
| Colorectum | MSS |  |
| Colorectum | MSI-H |  |
| Colorectum | FAP |  |
| ∗Top 15 enriched GO BP terms are showed in the bar plot of each disease state in each tissue. Each row represents a significant GO biological process which is colored according to the -log10(p.adjust). |
| Page: 1 2 3 4 5 6 7 8 9 |
| GO ID | Tissue | Disease Stage | Description | Gene Ratio | Bg Ratio | pvalue | p.adjust | Count |
| GO:00423912 | Breast | IDC | regulation of membrane potential | 49/1434 | 434/18723 | 4.04e-03 | 3.25e-02 | 49 |
| Page: 1 |
| Pathway ID | Tissue | Disease Stage | Description | Gene Ratio | Bg Ratio | pvalue | p.adjust | qvalue | Count |
| Page: 1 |
Top |
Cell-cell communication analysis |
| Identification of potential cell-cell interactions between two cell types and their ligand-receptor pairs for different disease states |
| Ligand | Receptor | LRpair | Pathway | Tissue | Disease Stage |
| Page: 1 |
Top |
Single-cell gene regulatory network inference analysis |
| Find out the significant the regulons (TFs) and the target genes of each regulon across cell types for different disease states |
| TF | Cell Type | Tissue | Disease Stage | Target Gene | RSS | Regulon Activity |
| ∗The dot plots of a searched regulon are shown for all cell subpopulations in each disease state of each tissue based on the regulon specific score inferred using pySCENIC and by calculating the average expression. |
| Page: 1 |
Top |
Somatic mutation of malignant transformation related genes |
| Annotation of somatic variants for genes involved in malignant transformation |
| Hugo Symbol | Variant Class | Variant Classification | dbSNP RS | HGVSc | HGVSp | HGVSp Short | SWISSPROT | BIOTYPE | SIFT | PolyPhen | Tumor Sample Barcode | Tissue | Histology | Sex | Age | Stage | Therapy Types | Drugs | Outcome |
| KCNK15 | SNV | Missense_Mutation | novel | c.471N>T | p.Glu157Asp | p.E157D | Q9H427 | protein_coding | tolerated(0.33) | benign(0.046) | TCGA-AN-A046-01 | Breast | breast invasive carcinoma | Female | >=65 | I/II | Unknown | Unknown | SD |
| KCNK15 | SNV | Missense_Mutation | c.734G>A | p.Arg245His | p.R245H | Q9H427 | protein_coding | deleterious(0) | probably_damaging(0.992) | TCGA-AR-A0U0-01 | Breast | breast invasive carcinoma | Female | >=65 | I/II | Unknown | Unknown | SD | |
| KCNK15 | SNV | Missense_Mutation | c.362C>T | p.Thr121Met | p.T121M | Q9H427 | protein_coding | deleterious(0.01) | probably_damaging(0.992) | TCGA-S3-A6ZH-01 | Breast | breast invasive carcinoma | Female | <65 | III/IV | Chemotherapy | adriamycin | CR | |
| KCNK15 | SNV | Missense_Mutation | rs746020825 | c.529N>A | p.Ala177Thr | p.A177T | Q9H427 | protein_coding | tolerated(0.06) | benign(0.157) | TCGA-2W-A8YY-01 | Cervix | cervical & endocervical cancer | Female | <65 | I/II | Chemotherapy | cisplatin | CR |
| KCNK15 | SNV | Missense_Mutation | rs772480413 | c.920N>T | p.Ser307Leu | p.S307L | Q9H427 | protein_coding | deleterious_low_confidence(0.05) | benign(0.12) | TCGA-C5-A8XI-01 | Cervix | cervical & endocervical cancer | Female | >=65 | I/II | Chemotherapy | cisplatin | SD |
| KCNK15 | SNV | Missense_Mutation | c.695T>C | p.Leu232Pro | p.L232P | Q9H427 | protein_coding | deleterious(0) | probably_damaging(0.991) | TCGA-AA-A01P-01 | Colorectum | colon adenocarcinoma | Female | >=65 | III/IV | Unknown | Unknown | PD | |
| KCNK15 | SNV | Missense_Mutation | c.356N>T | p.Pro119Leu | p.P119L | Q9H427 | protein_coding | deleterious(0) | probably_damaging(0.931) | TCGA-AD-6548-01 | Colorectum | colon adenocarcinoma | Female | >=65 | I/II | Unknown | Unknown | SD | |
| KCNK15 | SNV | Missense_Mutation | c.295G>A | p.Ala99Thr | p.A99T | Q9H427 | protein_coding | tolerated(0.07) | benign(0.025) | TCGA-NH-A8F8-01 | Colorectum | colon adenocarcinoma | Male | >=65 | III/IV | Chemotherapy | fluorouracil | PD | |
| KCNK15 | SNV | Missense_Mutation | c.401C>T | p.Ala134Val | p.A134V | Q9H427 | protein_coding | tolerated(0.11) | benign(0.076) | TCGA-DC-6682-01 | Colorectum | rectum adenocarcinoma | Male | <65 | I/II | Unknown | Unknown | SD | |
| KCNK15 | SNV | Missense_Mutation | novel | c.47N>C | p.Leu16Pro | p.L16P | Q9H427 | protein_coding | deleterious(0) | probably_damaging(0.923) | TCGA-A5-A0G1-01 | Endometrium | uterine corpus endometrioid carcinoma | Female | >=65 | I/II | Unknown | Unknown | SD |
| Page: 1 2 3 4 5 |
Top |
Related drugs of malignant transformation related genes |
| Identification of chemicals and drugs interact with genes involved in malignant transfromation |
| (DGIdb 4.0) |
| Entrez ID | Symbol | Category | Interaction Types | Drug Claim Name | Drug Name | PMIDs |
| Page: 1 |

Copyright 2023-Present -The University of Texas Health Science Center at Houston |