
|
|||||
|
 | |
| |
| |
| |
| |
| |
|
Gene: KCNK1 |
Gene summary for KCNK1 |
| Gene information | Species | Human | Gene symbol | KCNK1 | Gene ID | 3775 |
| Gene name | potassium two pore domain channel subfamily K member 1 | |
| Gene Alias | DPK | |
| Cytomap | 1q42.2 | |
| Gene Type | protein-coding | GO ID | GO:0006810 | UniProtAcc | A0A024R3T2 |
Top |
Malignant transformation analysis |
| Identification of the aberrant gene expression in precancerous and cancerous lesions by comparing the gene expression of stem-like cells in diseased tissues with normal stem cells |
| Entrez ID | Symbol | Replicates | Species | Organ | Tissue | Adj P-value | Log2FC | Malignancy |
| 3775 | KCNK1 | CCI_1 | Human | Cervix | CC | 1.18e-18 | 1.38e+00 | 0.528 |
| 3775 | KCNK1 | CCI_2 | Human | Cervix | CC | 1.01e-02 | 5.29e-01 | 0.5249 |
| 3775 | KCNK1 | CCI_3 | Human | Cervix | CC | 2.02e-17 | 9.44e-01 | 0.516 |
| 3775 | KCNK1 | Tumor | Human | Cervix | CC | 1.01e-12 | 3.39e-01 | 0.1241 |
| 3775 | KCNK1 | sample3 | Human | Cervix | CC | 3.71e-36 | 5.57e-01 | 0.1387 |
| 3775 | KCNK1 | H2 | Human | Cervix | HSIL_HPV | 3.80e-08 | 2.87e-01 | 0.0632 |
| 3775 | KCNK1 | T3 | Human | Cervix | CC | 1.55e-32 | 5.48e-01 | 0.1389 |
| 3775 | KCNK1 | AEH-subject1 | Human | Endometrium | AEH | 4.21e-13 | 4.32e-01 | -0.3059 |
| 3775 | KCNK1 | AEH-subject3 | Human | Endometrium | AEH | 7.12e-05 | 2.99e-01 | -0.2576 |
| 3775 | KCNK1 | AEH-subject5 | Human | Endometrium | AEH | 5.51e-28 | 6.67e-01 | -0.2953 |
| 3775 | KCNK1 | EEC-subject1 | Human | Endometrium | EEC | 7.62e-27 | 6.65e-01 | -0.2682 |
| 3775 | KCNK1 | EEC-subject2 | Human | Endometrium | EEC | 1.34e-06 | 3.37e-01 | -0.2607 |
| 3775 | KCNK1 | EEC-subject3 | Human | Endometrium | EEC | 4.88e-27 | 7.02e-01 | -0.2525 |
| 3775 | KCNK1 | EEC-subject4 | Human | Endometrium | EEC | 7.55e-09 | 3.20e-01 | -0.2571 |
| 3775 | KCNK1 | EEC-subject5 | Human | Endometrium | EEC | 7.33e-14 | 4.12e-01 | -0.249 |
| 3775 | KCNK1 | GSM5276934 | Human | Endometrium | EEC | 7.72e-10 | 3.52e-01 | -0.0913 |
| 3775 | KCNK1 | GSM5276937 | Human | Endometrium | EEC | 2.31e-11 | 5.09e-01 | -0.0897 |
| 3775 | KCNK1 | GSM6177620_NYU_UCEC1_lib1_lib1 | Human | Endometrium | EEC | 1.72e-02 | 3.92e-02 | -0.1869 |
| 3775 | KCNK1 | GSM6177620_NYU_UCEC1_lib2_lib2 | Human | Endometrium | EEC | 1.12e-04 | 4.12e-02 | -0.1875 |
| 3775 | KCNK1 | GSM6177620_NYU_UCEC1_lib3_lib3 | Human | Endometrium | EEC | 9.67e-06 | 1.53e-02 | -0.1883 |
| Page: 1 2 3 4 5 6 7 8 |
| Tissue | Expression Dynamics | Abbreviation |
| Cervix | 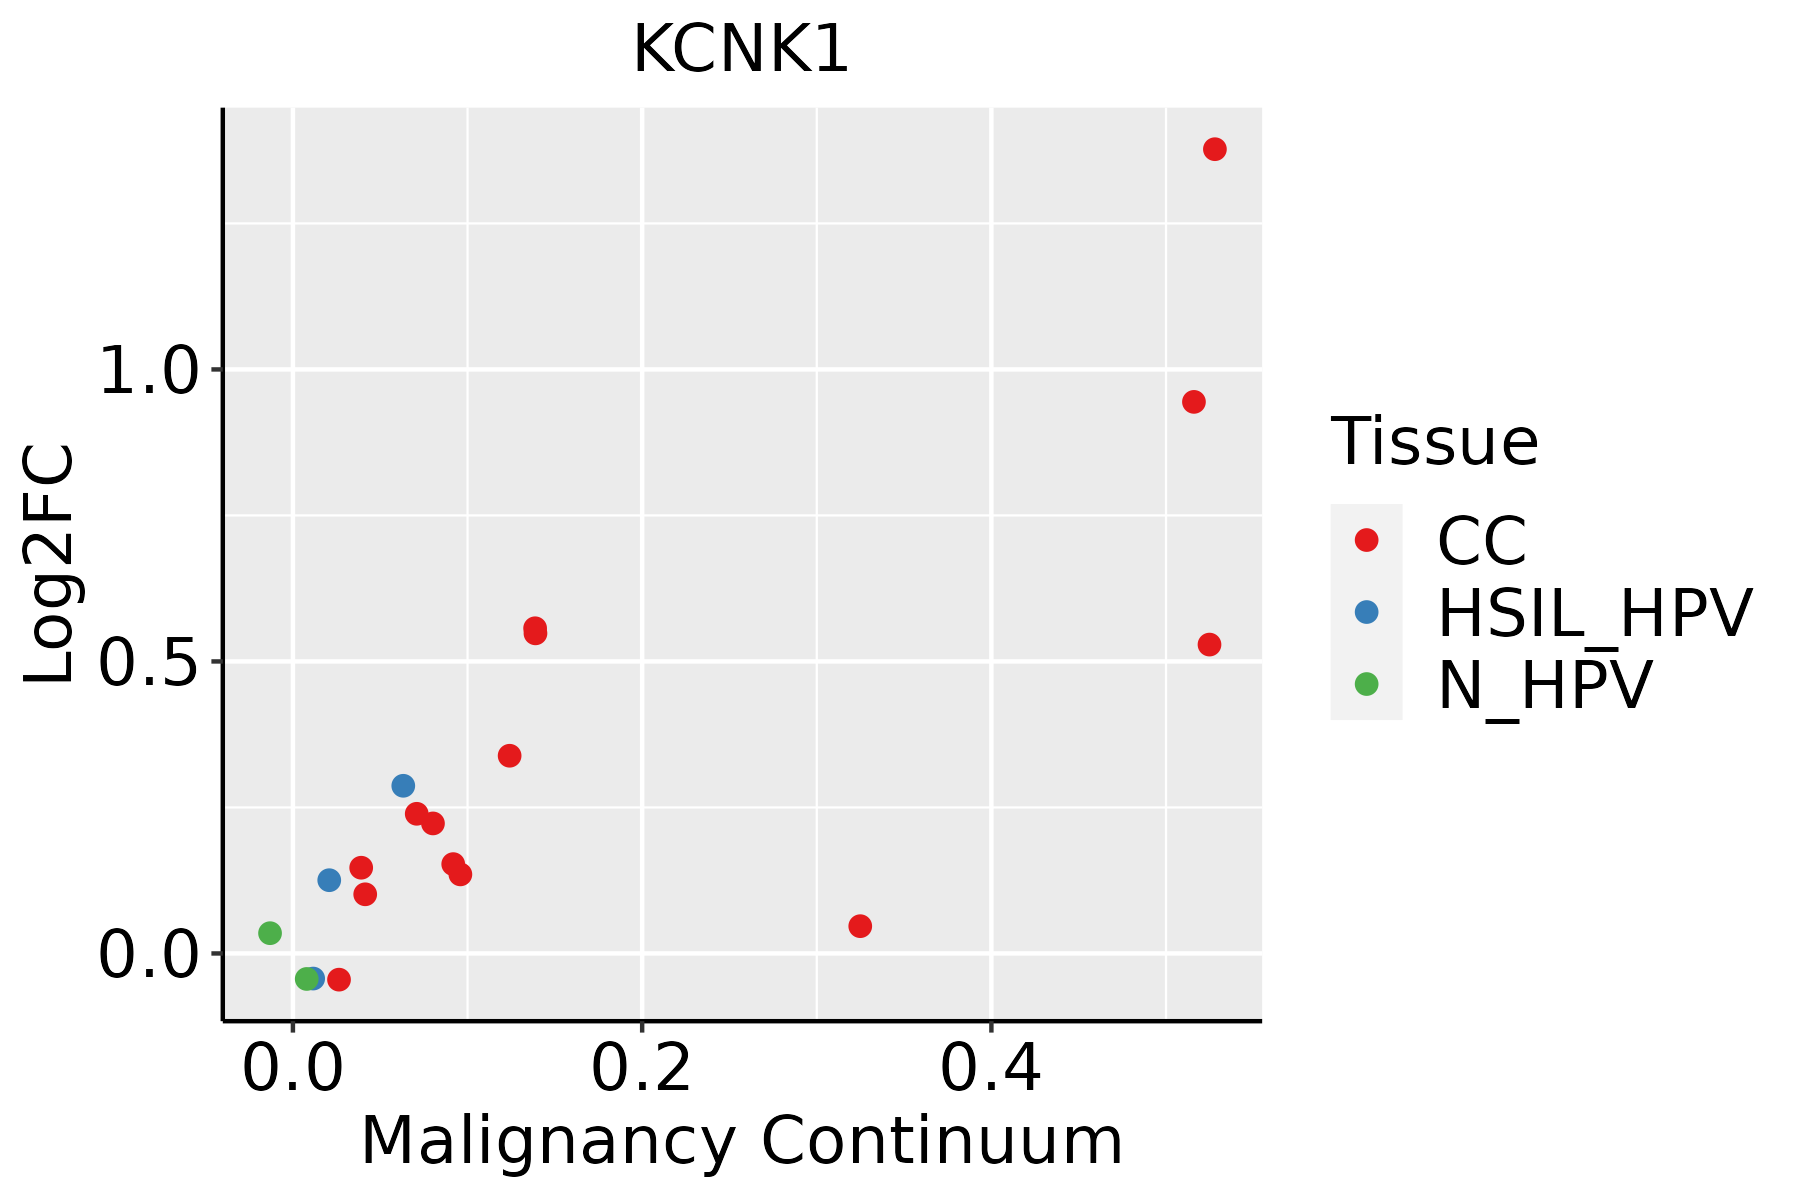 | CC: Cervix cancer |
| HSIL_HPV: HPV-infected high-grade squamous intraepithelial lesions | ||
| N_HPV: HPV-infected normal cervix | ||
| Endometrium | 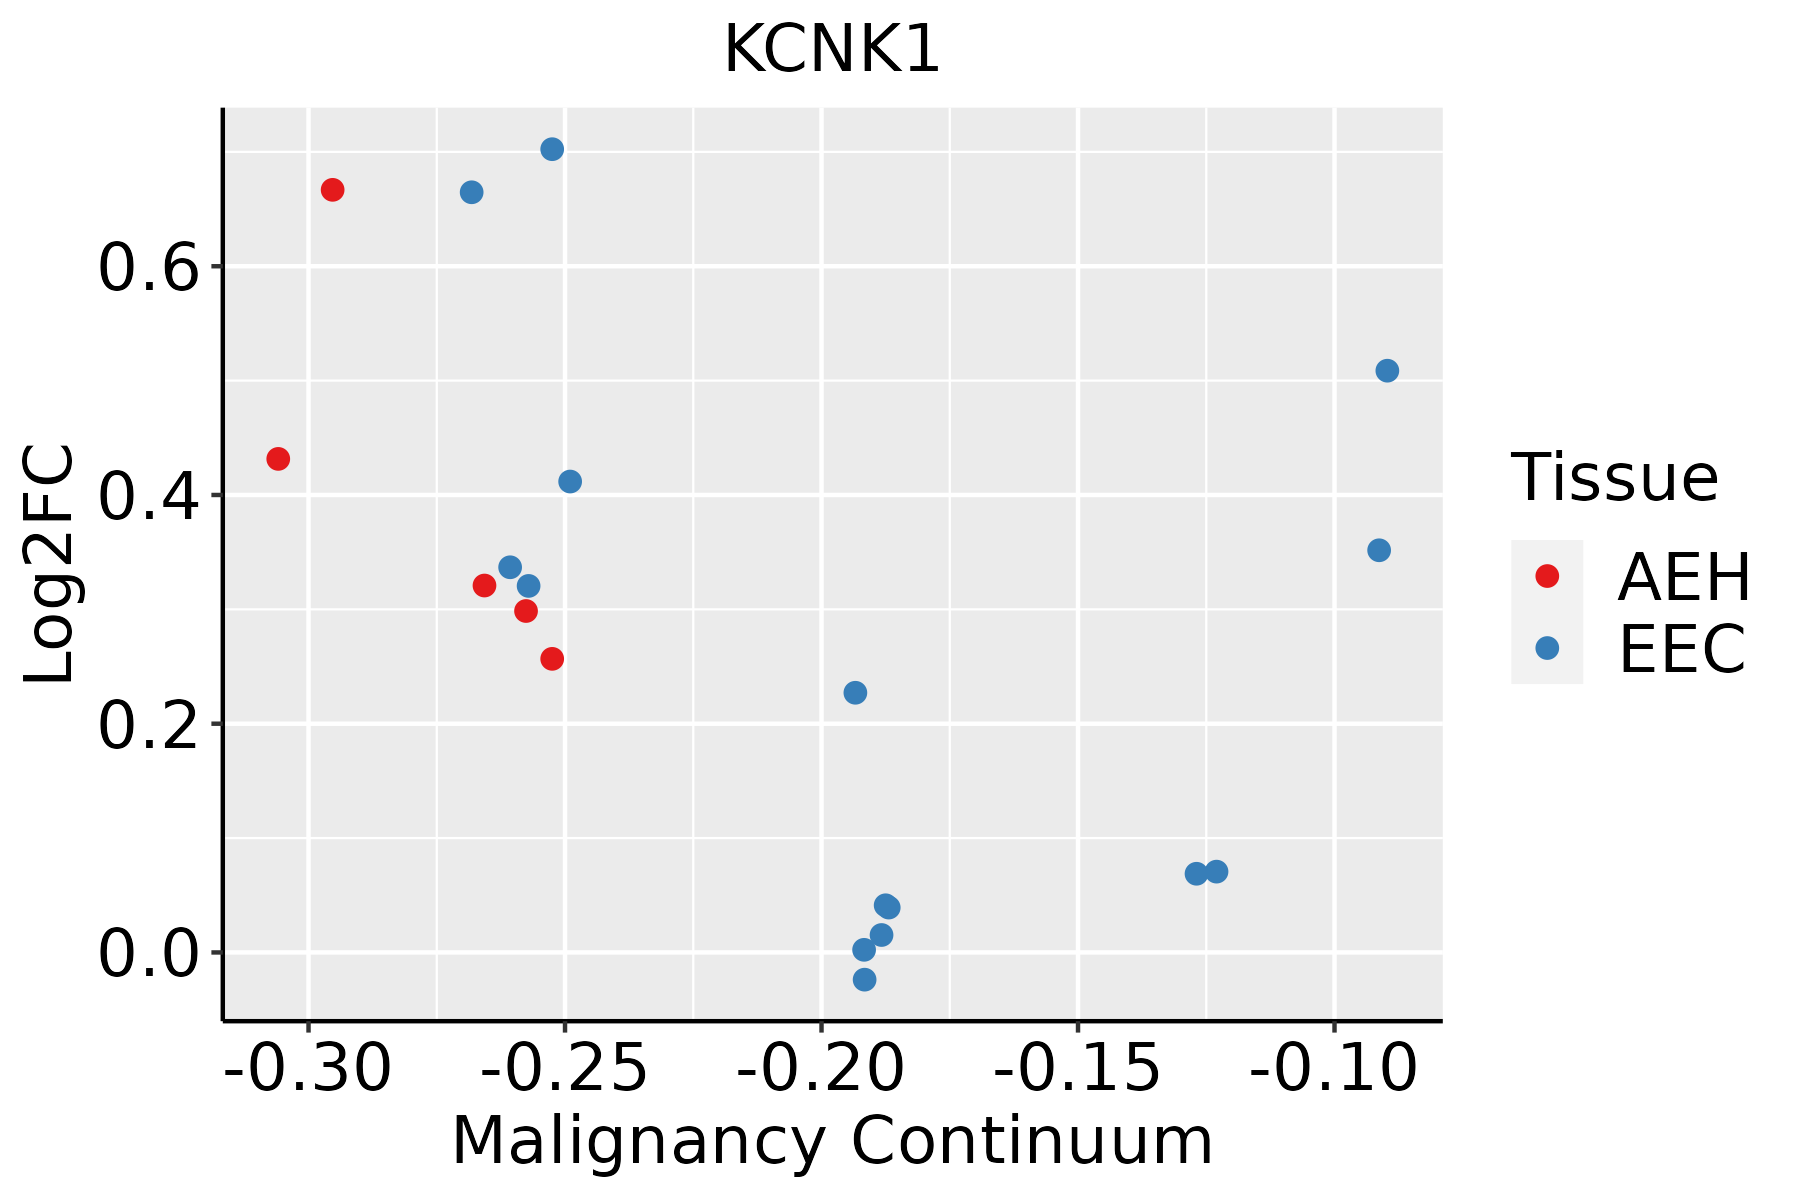 | AEH: Atypical endometrial hyperplasia |
| EEC: Endometrioid Cancer | ||
| Esophagus | 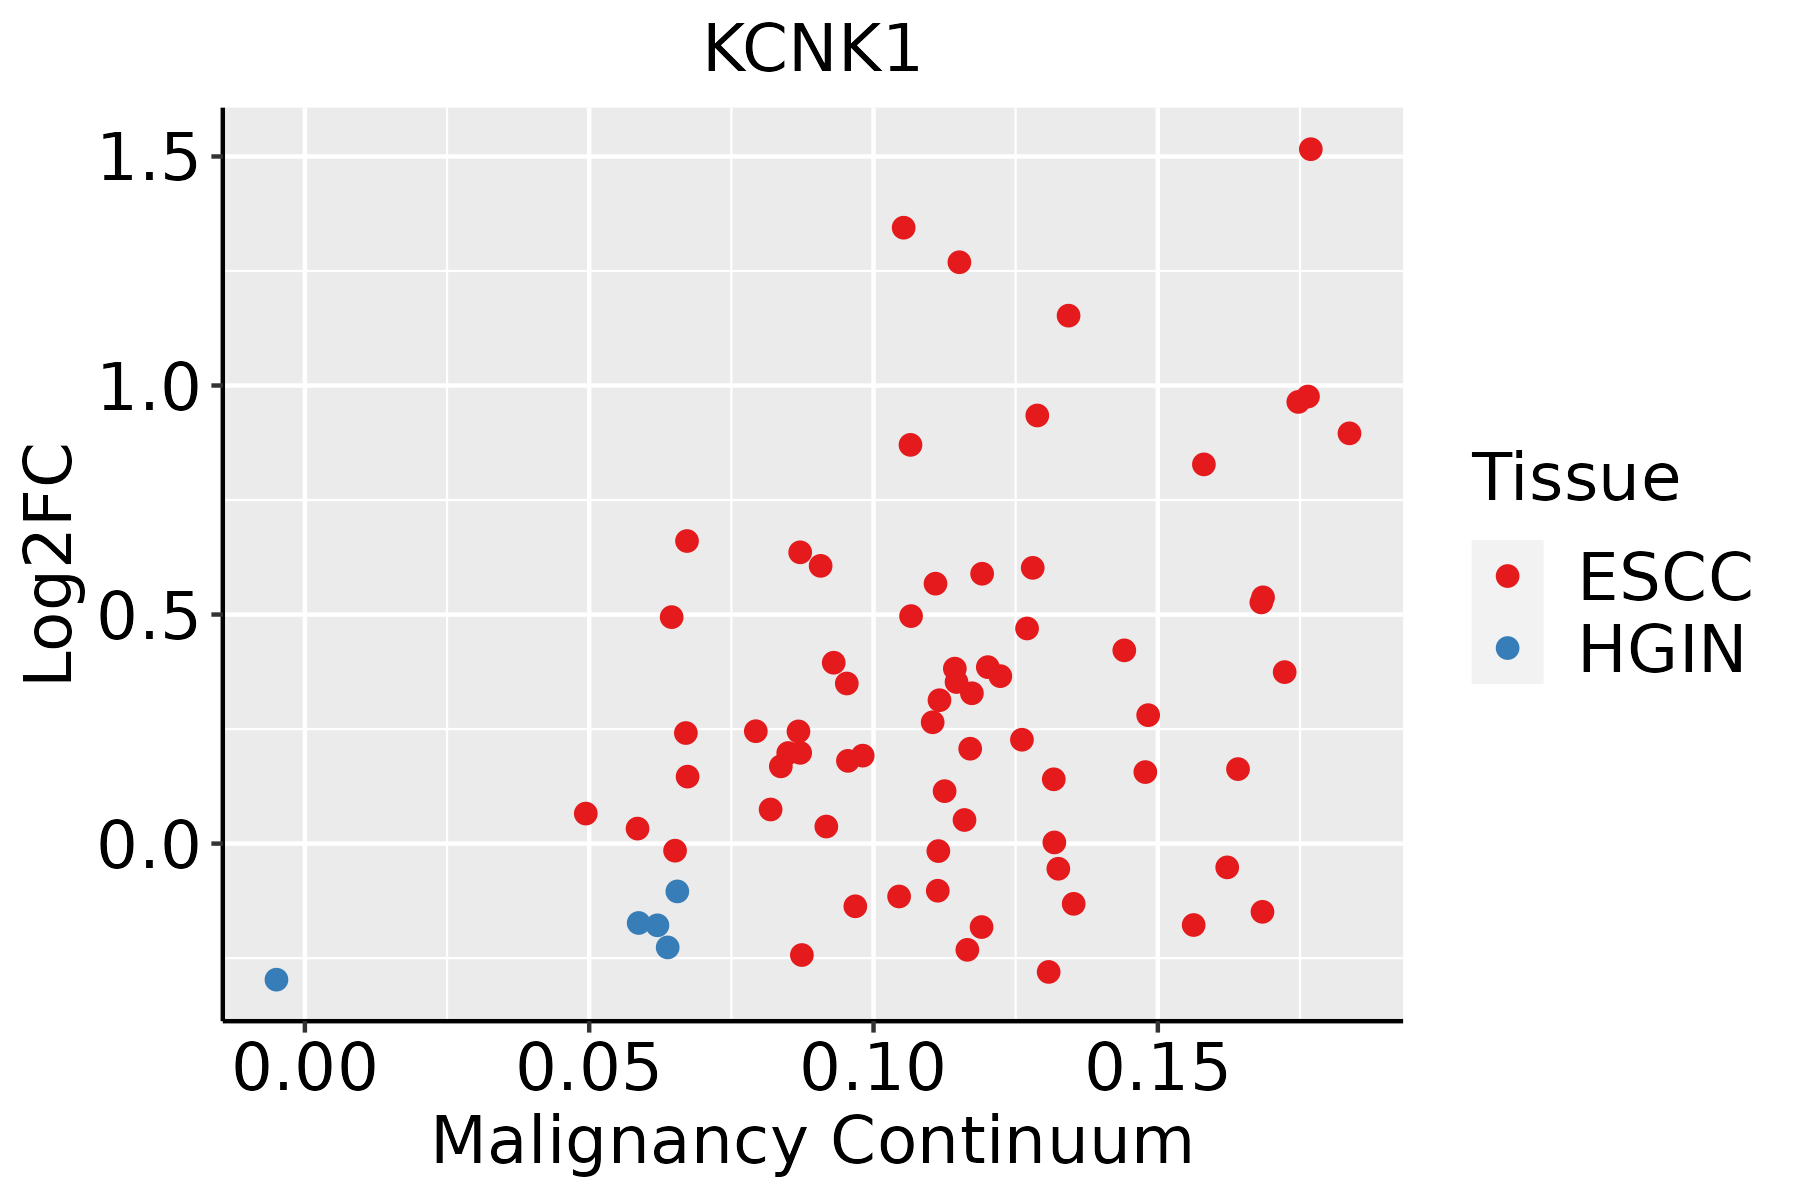 | ESCC: Esophageal squamous cell carcinoma |
| HGIN: High-grade intraepithelial neoplasias | ||
| LGIN: Low-grade intraepithelial neoplasias | ||
| GC | 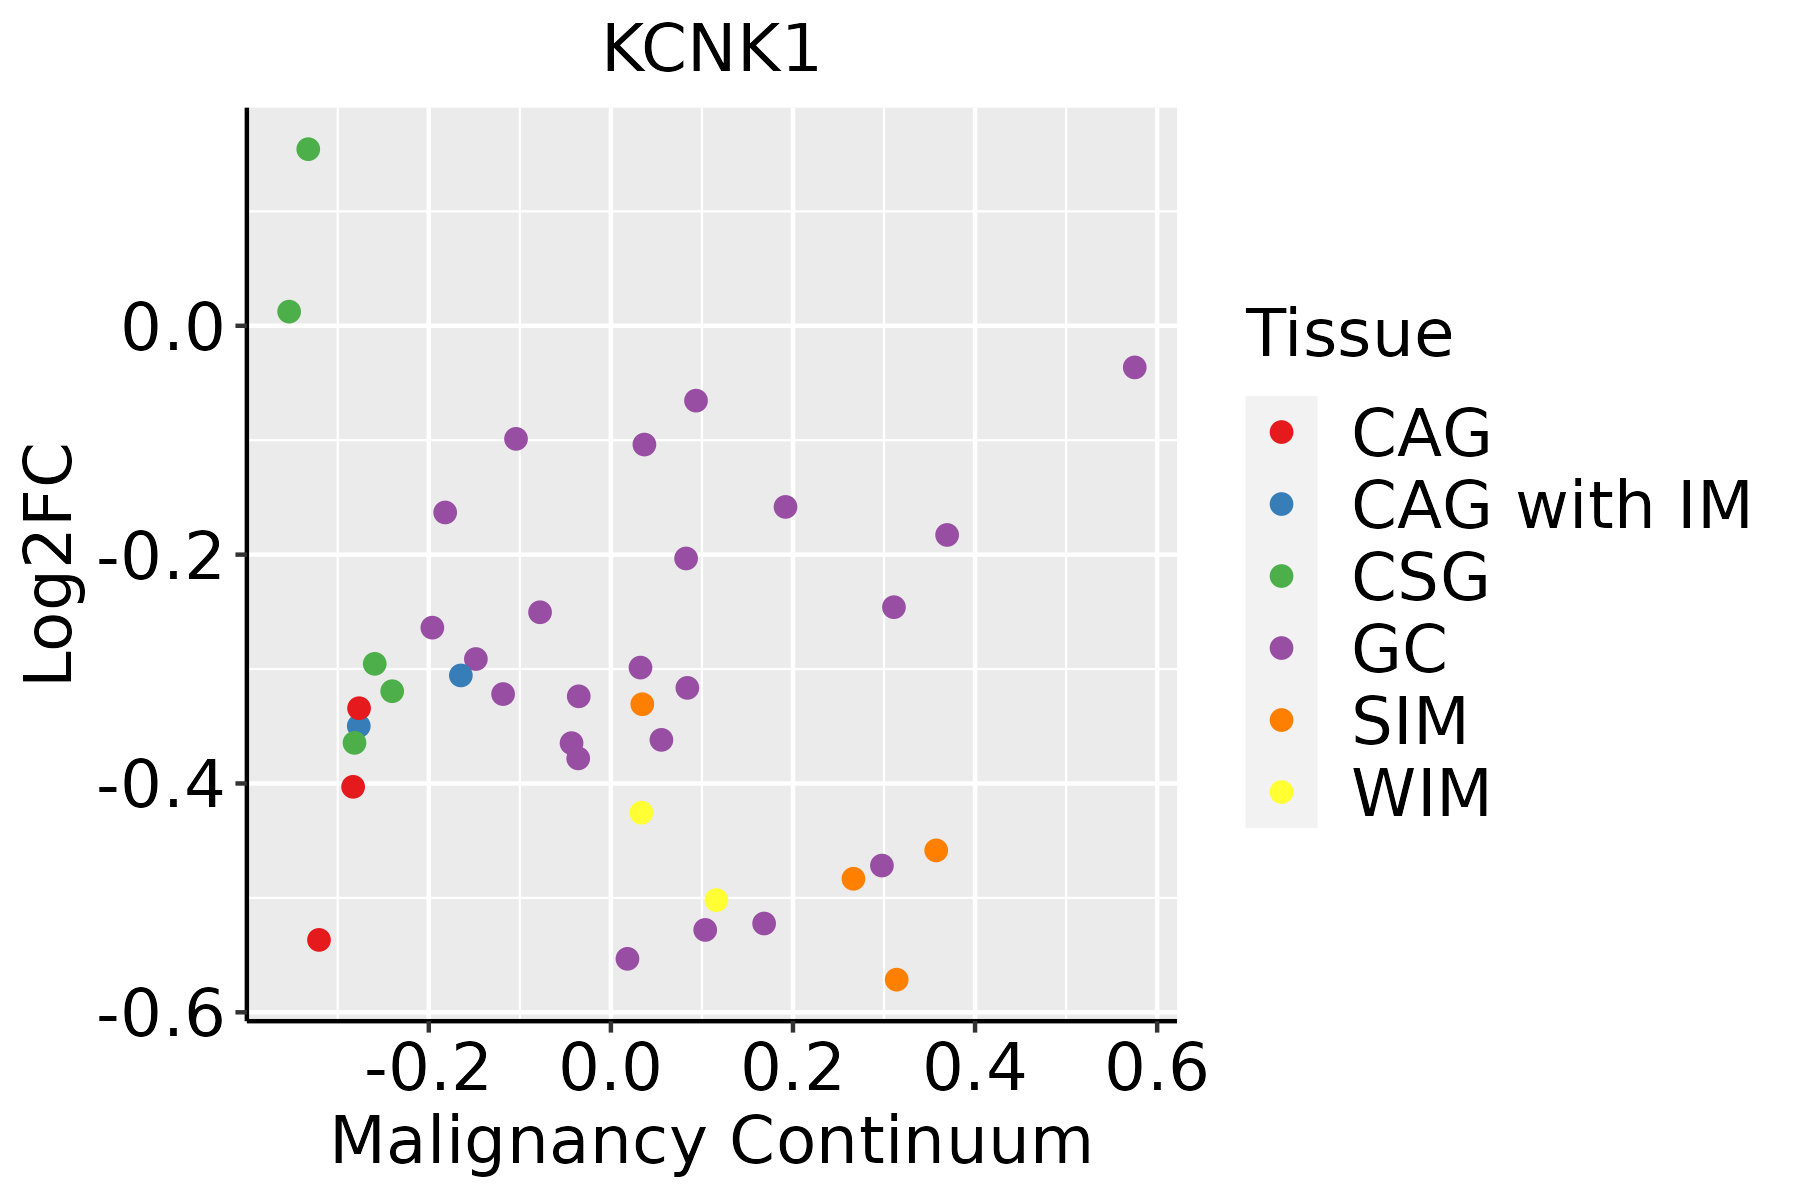 | CAG: Chronic atrophic gastritis |
| CAG with IM: Chronic atrophic gastritis with intestinal metaplasia | ||
| CSG: Chronic superficial gastritis | ||
| GC: Gastric cancer | ||
| SIM: Severe intestinal metaplasia | ||
| WIM: Wild intestinal metaplasia | ||
| Lung | 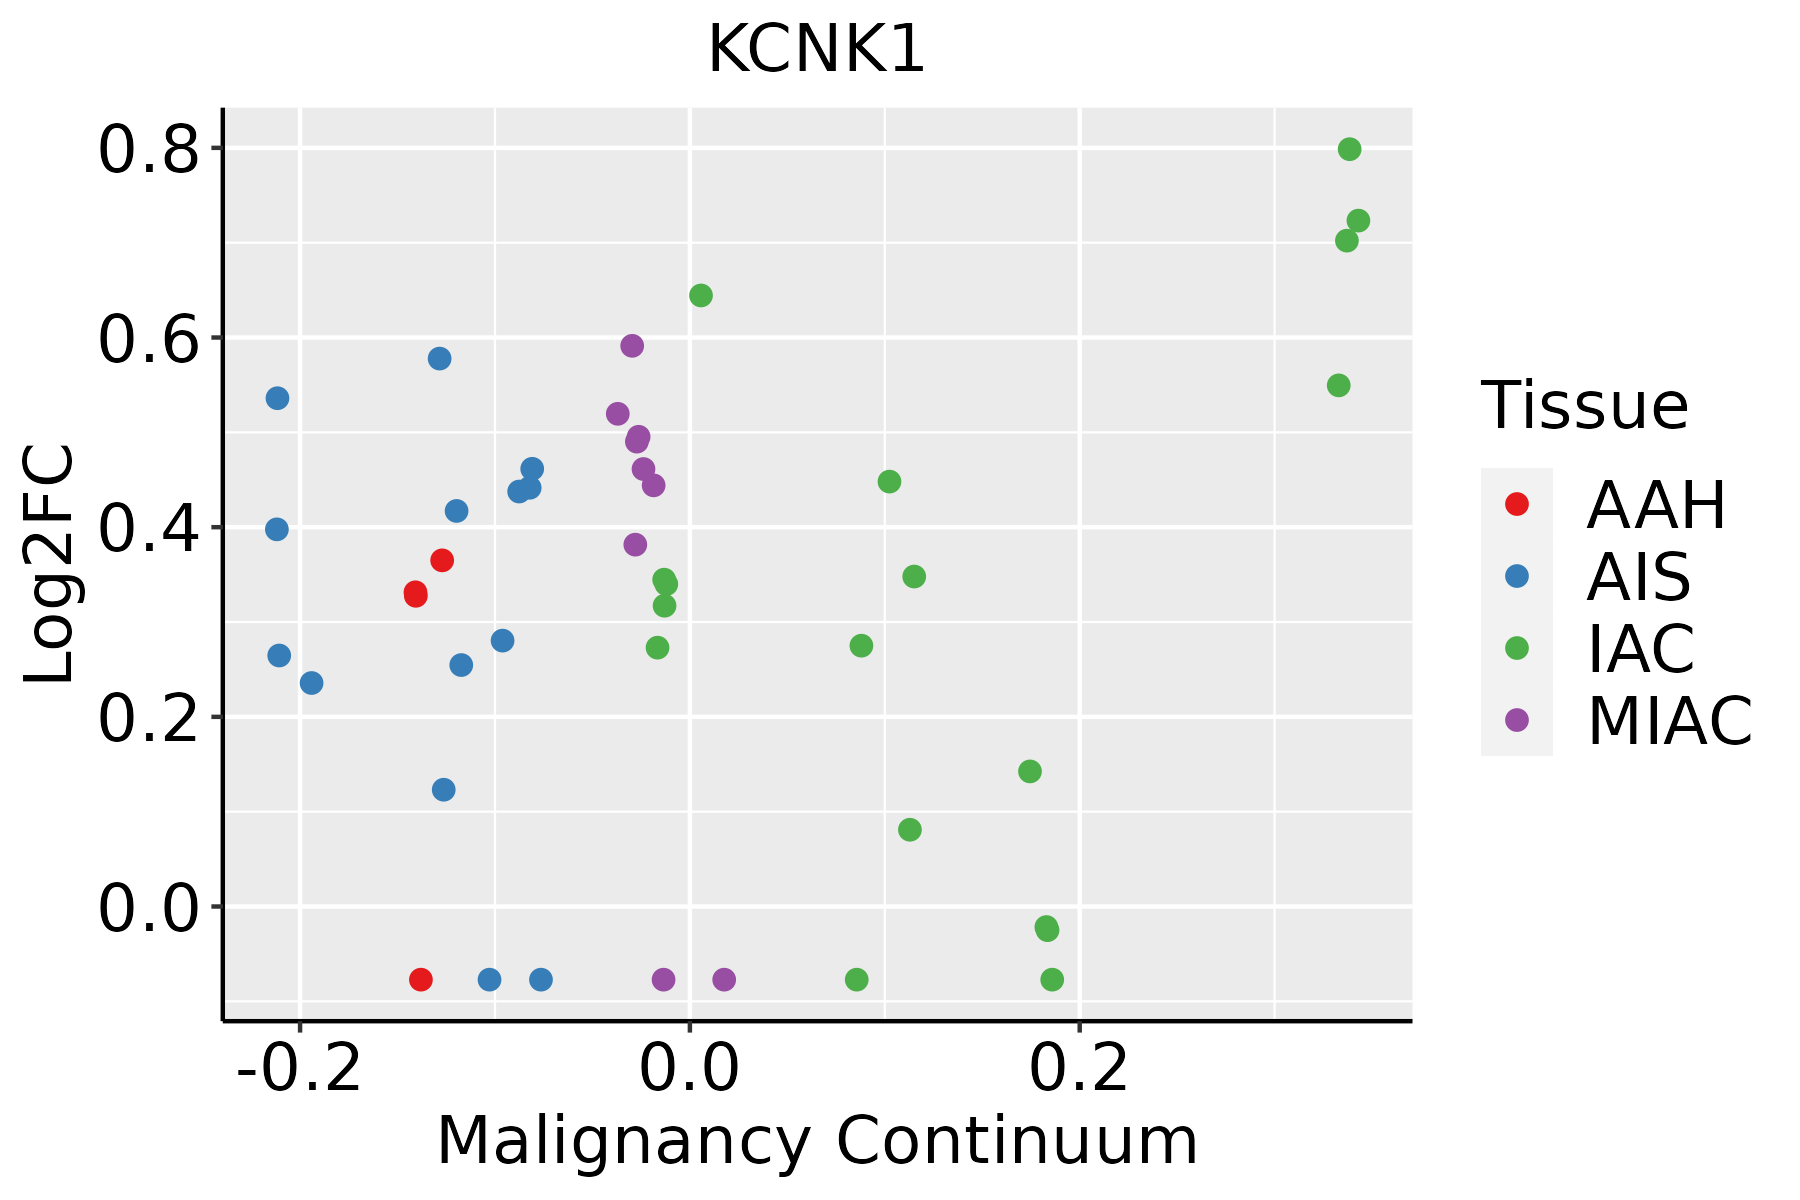 | AAH: Atypical adenomatous hyperplasia |
| AIS: Adenocarcinoma in situ | ||
| IAC: Invasive lung adenocarcinoma | ||
| MIA: Minimally invasive adenocarcinoma | ||
| Oral Cavity | 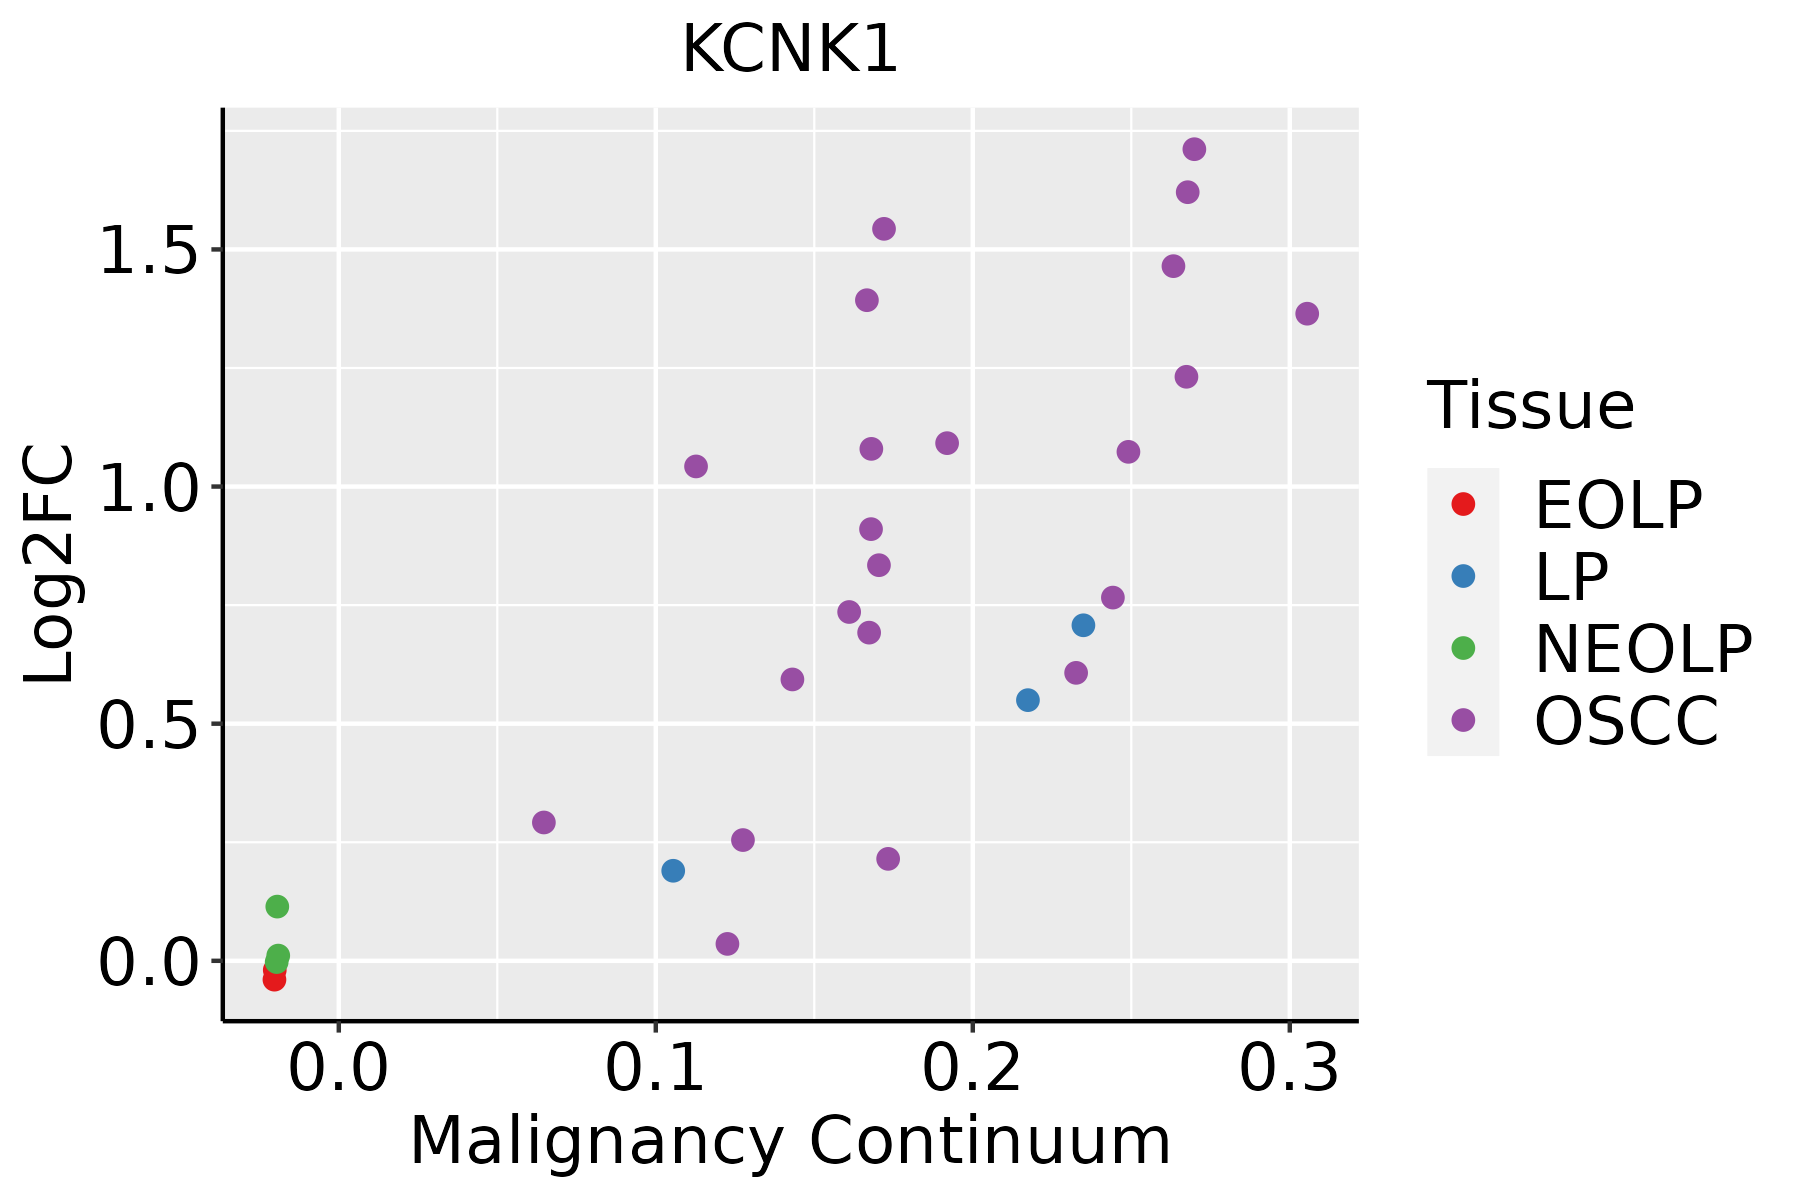 | EOLP: Erosive Oral lichen planus |
| LP: leukoplakia | ||
| NEOLP: Non-erosive oral lichen planus | ||
| OSCC: Oral squamous cell carcinoma | ||
| Prostate | 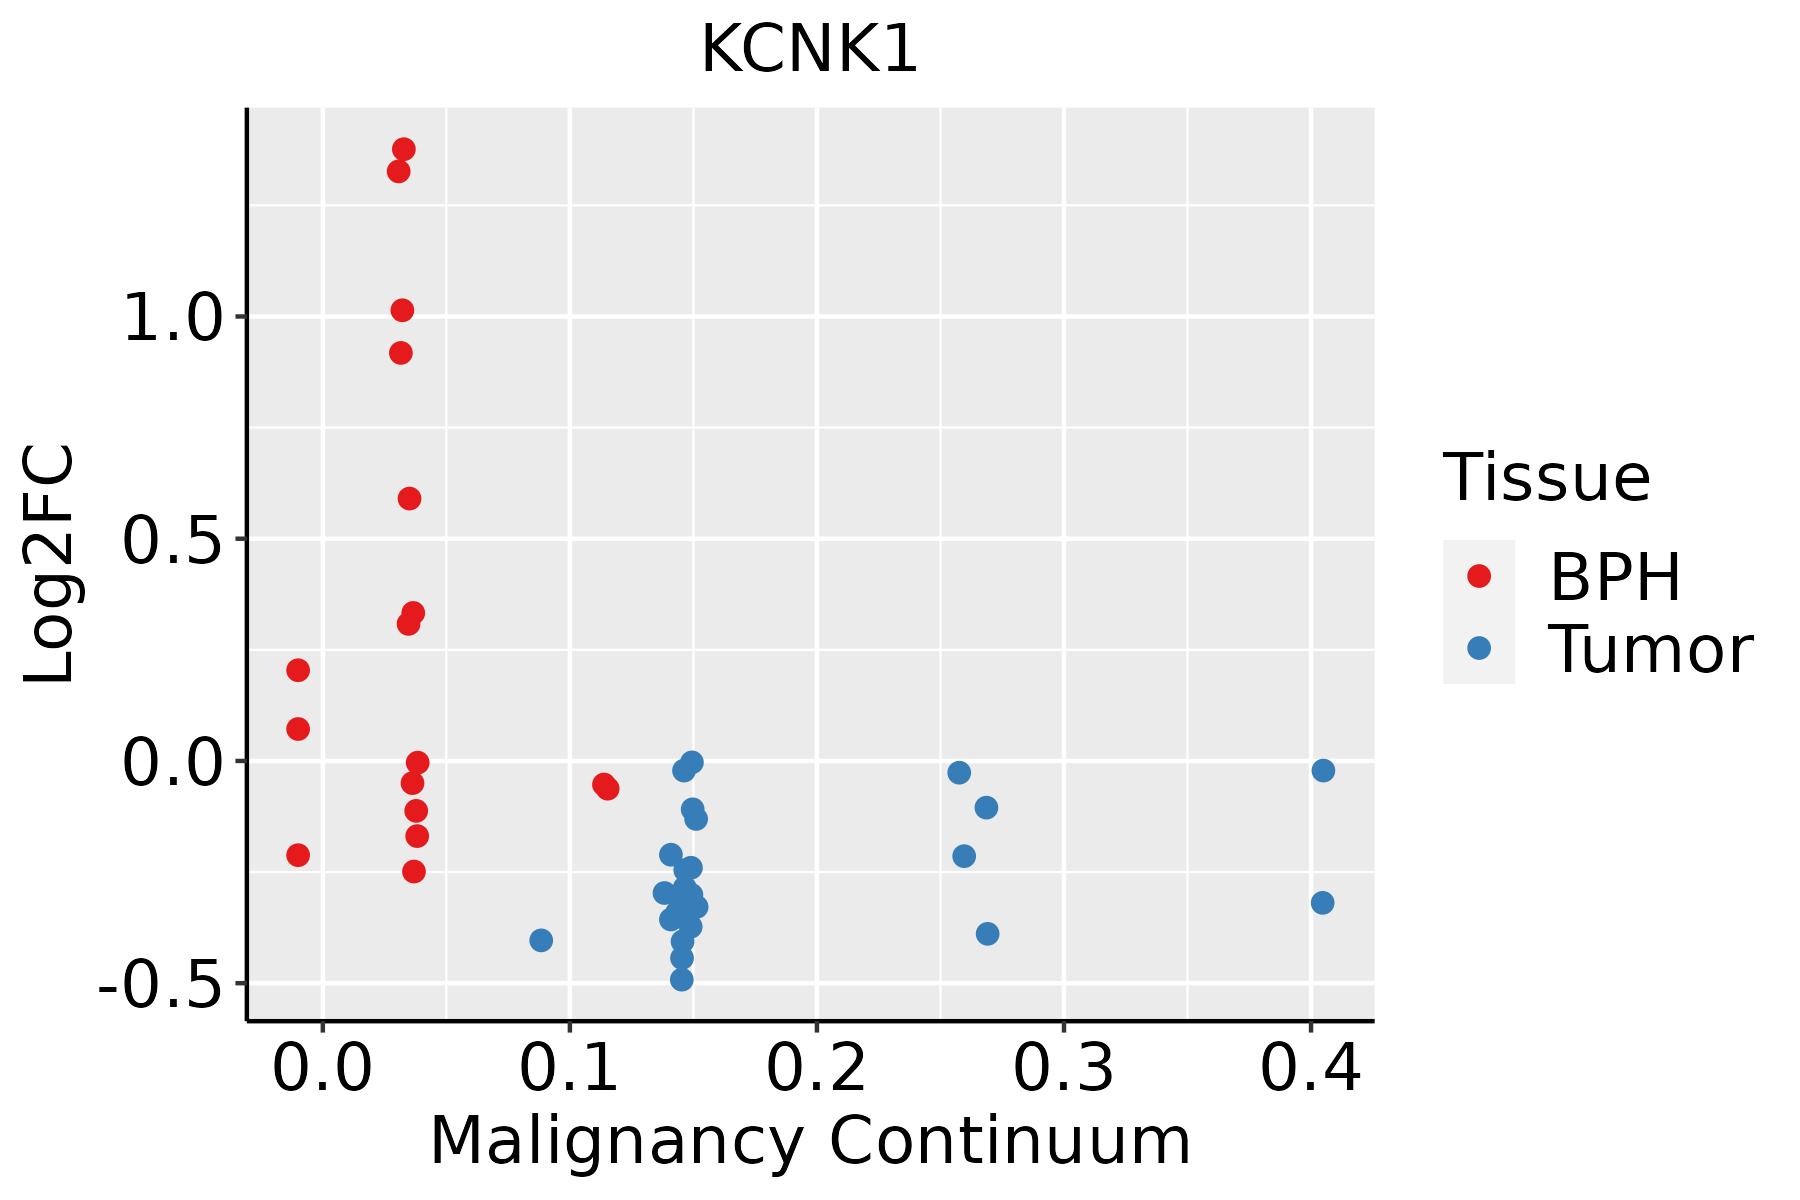 | BPH: Benign Prostatic Hyperplasia |
| Skin | 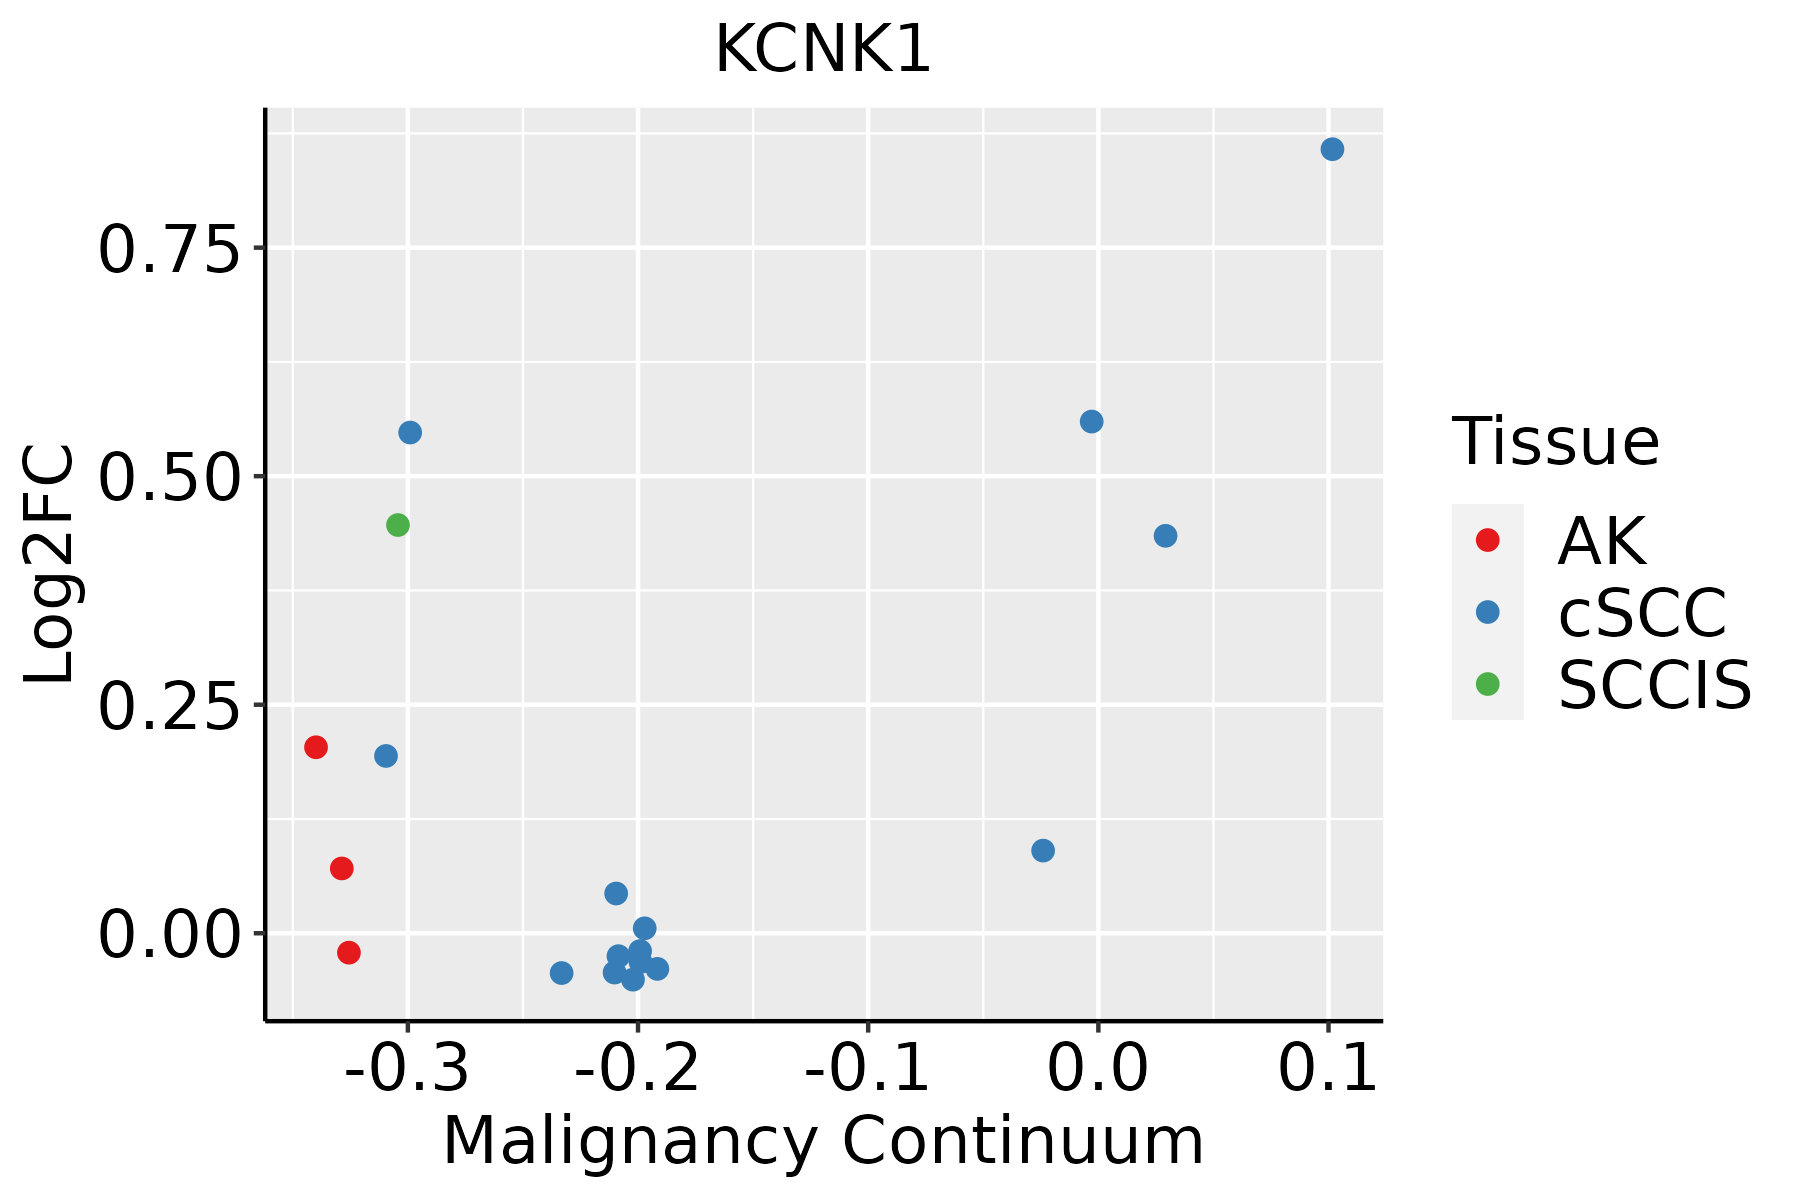 | AK: Actinic keratosis |
| cSCC: Cutaneous squamous cell carcinoma | ||
| SCCIS:squamous cell carcinoma in situ | ||
| Thyroid |  | ATC: Anaplastic thyroid cancer |
| HT: Hashimoto's thyroiditis | ||
| PTC: Papillary thyroid cancer |
| ∗log2FC in expression of this searched gene in stem-like cells from each diseased tissue sample relative to stem-like cells in normal samples in each tissue plotted against the malignancy continuum. Samples are colored based on if they are from different disease stage. |
Top |
Malignant transformation related pathway analysis |
| Find out the enriched GO biological processes and KEGG pathways involved in transition from healthy to precancer to cancer |
| Tissue | Disease Stage | Enriched GO biological Processes |
| Colorectum | AD |  |
| Colorectum | SER |  |
| Colorectum | MSS |  |
| Colorectum | MSI-H |  |
| Colorectum | FAP |  |
| ∗Top 15 enriched GO BP terms are showed in the bar plot of each disease state in each tissue. Each row represents a significant GO biological process which is colored according to the -log10(p.adjust). |
| Page: 1 2 3 4 5 6 7 8 9 |
| GO ID | Tissue | Disease Stage | Description | Gene Ratio | Bg Ratio | pvalue | p.adjust | Count |
| GO:00423912 | Breast | IDC | regulation of membrane potential | 49/1434 | 434/18723 | 4.04e-03 | 3.25e-02 | 49 |
| Page: 1 |
| Pathway ID | Tissue | Disease Stage | Description | Gene Ratio | Bg Ratio | pvalue | p.adjust | qvalue | Count |
| Page: 1 |
Top |
Cell-cell communication analysis |
| Identification of potential cell-cell interactions between two cell types and their ligand-receptor pairs for different disease states |
| Ligand | Receptor | LRpair | Pathway | Tissue | Disease Stage |
| Page: 1 |
Top |
Single-cell gene regulatory network inference analysis |
| Find out the significant the regulons (TFs) and the target genes of each regulon across cell types for different disease states |
| TF | Cell Type | Tissue | Disease Stage | Target Gene | RSS | Regulon Activity |
| ∗The dot plots of a searched regulon are shown for all cell subpopulations in each disease state of each tissue based on the regulon specific score inferred using pySCENIC and by calculating the average expression. |
| Page: 1 |
Top |
Somatic mutation of malignant transformation related genes |
| Annotation of somatic variants for genes involved in malignant transformation |
| Hugo Symbol | Variant Class | Variant Classification | dbSNP RS | HGVSc | HGVSp | HGVSp Short | SWISSPROT | BIOTYPE | SIFT | PolyPhen | Tumor Sample Barcode | Tissue | Histology | Sex | Age | Stage | Therapy Types | Drugs | Outcome |
| KCNK1 | SNV | Missense_Mutation | novel | c.405N>G | p.Ile135Met | p.I135M | O00180 | protein_coding | deleterious(0) | possibly_damaging(0.771) | TCGA-5L-AAT1-01 | Breast | breast invasive carcinoma | Female | <65 | III/IV | Hormone Therapy | letrozol | SD |
| KCNK1 | SNV | Missense_Mutation | c.619G>C | p.Glu207Gln | p.E207Q | O00180 | protein_coding | deleterious(0) | benign(0.354) | TCGA-AC-A23H-01 | Breast | breast invasive carcinoma | Female | >=65 | I/II | Unknown | Unknown | PD | |
| KCNK1 | SNV | Missense_Mutation | novel | c.46N>T | p.Arg16Trp | p.R16W | O00180 | protein_coding | tolerated(0.08) | benign(0.18) | TCGA-AC-A8OQ-01 | Breast | breast invasive carcinoma | Female | >=65 | I/II | Unknown | Unknown | SD |
| KCNK1 | SNV | Missense_Mutation | novel | c.253G>T | p.Ala85Ser | p.A85S | O00180 | protein_coding | deleterious(0.02) | probably_damaging(0.998) | TCGA-EW-A3U0-01 | Breast | breast invasive carcinoma | Female | <65 | III/IV | Chemotherapy | cisplatin | CR |
| KCNK1 | SNV | Missense_Mutation | novel | c.286G>A | p.Ala96Thr | p.A96T | O00180 | protein_coding | tolerated(0.36) | benign(0.005) | TCGA-EA-A3HU-01 | Cervix | cervical & endocervical cancer | Female | <65 | I/II | Unknown | Unknown | SD |
| KCNK1 | SNV | Missense_Mutation | novel | c.685N>A | p.Gly229Arg | p.G229R | O00180 | protein_coding | deleterious(0) | probably_damaging(1) | TCGA-VS-A9V1-01 | Cervix | cervical & endocervical cancer | Female | <65 | I/II | Chemotherapy | cisplatin | PD |
| KCNK1 | SNV | Missense_Mutation | c.362G>A | p.Gly121Asp | p.G121D | O00180 | protein_coding | deleterious(0) | probably_damaging(1) | TCGA-A6-5661-01 | Colorectum | colon adenocarcinoma | Female | >=65 | I/II | Unknown | Unknown | SD | |
| KCNK1 | SNV | Missense_Mutation | c.289N>C | p.Ser97Pro | p.S97P | O00180 | protein_coding | deleterious(0) | probably_damaging(0.986) | TCGA-A6-6653-01 | Colorectum | colon adenocarcinoma | Male | >=65 | I/II | Unknown | Unknown | SD | |
| KCNK1 | SNV | Missense_Mutation | rs776795446 | c.730N>T | p.Leu244Phe | p.L244F | O00180 | protein_coding | deleterious(0.02) | possibly_damaging(0.826) | TCGA-AA-3845-01 | Colorectum | colon adenocarcinoma | Female | >=65 | I/II | Unknown | Unknown | PD |
| KCNK1 | SNV | Missense_Mutation | c.860A>G | p.Asp287Gly | p.D287G | O00180 | protein_coding | tolerated(0.06) | benign(0) | TCGA-AD-6964-01 | Colorectum | colon adenocarcinoma | Male | <65 | III/IV | Chemotherapy | folfox | PD |
| Page: 1 2 3 4 |
Top |
Related drugs of malignant transformation related genes |
| Identification of chemicals and drugs interact with genes involved in malignant transfromation |
| (DGIdb 4.0) |
| Entrez ID | Symbol | Category | Interaction Types | Drug Claim Name | Drug Name | PMIDs |
| Page: 1 |

Copyright 2023-Present -The University of Texas Health Science Center at Houston |