
|
|||||
|
 | |
| |
| |
| |
| |
| |
|
Gene: KCNJ3 |
Gene summary for KCNJ3 |
| Gene information | Species | Human | Gene symbol | KCNJ3 | Gene ID | 3760 |
| Gene name | potassium inwardly rectifying channel subfamily J member 3 | |
| Gene Alias | GIRK1 | |
| Cytomap | 2q24.1 | |
| Gene Type | protein-coding | GO ID | GO:0001508 | UniProtAcc | P48549 |
Top |
Malignant transformation analysis |
| Identification of the aberrant gene expression in precancerous and cancerous lesions by comparing the gene expression of stem-like cells in diseased tissues with normal stem cells |
| Entrez ID | Symbol | Replicates | Species | Organ | Tissue | Adj P-value | Log2FC | Malignancy |
| 3760 | KCNJ3 | GSM4909291 | Human | Breast | IDC | 3.64e-30 | 7.56e-01 | 0.1753 |
| 3760 | KCNJ3 | GSM4909307 | Human | Breast | IDC | 3.24e-49 | 9.49e-01 | 0.1569 |
| 3760 | KCNJ3 | GSM4909308 | Human | Breast | IDC | 6.51e-110 | 1.35e+00 | 0.158 |
| 3760 | KCNJ3 | NCCBC2 | Human | Breast | DCIS | 6.63e-03 | 5.17e-01 | 0.1554 |
| 3760 | KCNJ3 | HTA11_99999965062_69753 | Human | Colorectum | MSI-H | 5.48e-05 | 8.31e-01 | 0.3487 |
| 3760 | KCNJ3 | HTA11_99999965104_69814 | Human | Colorectum | MSS | 2.11e-07 | 3.90e-01 | 0.281 |
| 3760 | KCNJ3 | CRC-1-8810 | Human | Colorectum | CRC | 1.14e-33 | 8.39e-01 | 0.6257 |
| 3760 | KCNJ3 | S43 | Human | Liver | Cirrhotic | 4.33e-03 | -7.72e-02 | -0.0187 |
| 3760 | KCNJ3 | HCC1_Meng | Human | Liver | HCC | 4.33e-03 | -9.03e-02 | 0.0246 |
| 3760 | KCNJ3 | cirrhotic2 | Human | Liver | Cirrhotic | 9.14e-03 | -8.87e-02 | 0.0201 |
| 3760 | KCNJ3 | HCC1 | Human | Liver | HCC | 7.86e-15 | 1.61e+00 | 0.5336 |
| 3760 | KCNJ3 | HCC2 | Human | Liver | HCC | 7.81e-38 | 2.62e+00 | 0.5341 |
| 3760 | KCNJ3 | HCC5 | Human | Liver | HCC | 1.96e-15 | 8.02e-01 | 0.4932 |
| 3760 | KCNJ3 | Pt13.a | Human | Liver | HCC | 9.14e-03 | -9.16e-02 | 0.021 |
| 3760 | KCNJ3 | HTA12-15-2 | Human | Pancreas | PDAC | 4.27e-03 | 2.47e-01 | 0.2315 |
| 3760 | KCNJ3 | HTA12-23-1 | Human | Pancreas | PDAC | 1.44e-05 | 5.15e-01 | 0.3405 |
| 3760 | KCNJ3 | HTA12-25-1 | Human | Pancreas | PDAC | 3.64e-05 | 4.88e-01 | 0.313 |
| 3760 | KCNJ3 | HTA12-26-1 | Human | Pancreas | PDAC | 9.77e-13 | 6.22e-01 | 0.3728 |
| 3760 | KCNJ3 | HTA12-29-1 | Human | Pancreas | PDAC | 6.39e-34 | 7.83e-01 | 0.3722 |
| 3760 | KCNJ3 | HTA12-32-1 | Human | Pancreas | PDAC | 1.46e-03 | 7.34e-01 | 0.3624 |
| Page: 1 |
| Tissue | Expression Dynamics | Abbreviation |
| Breast | 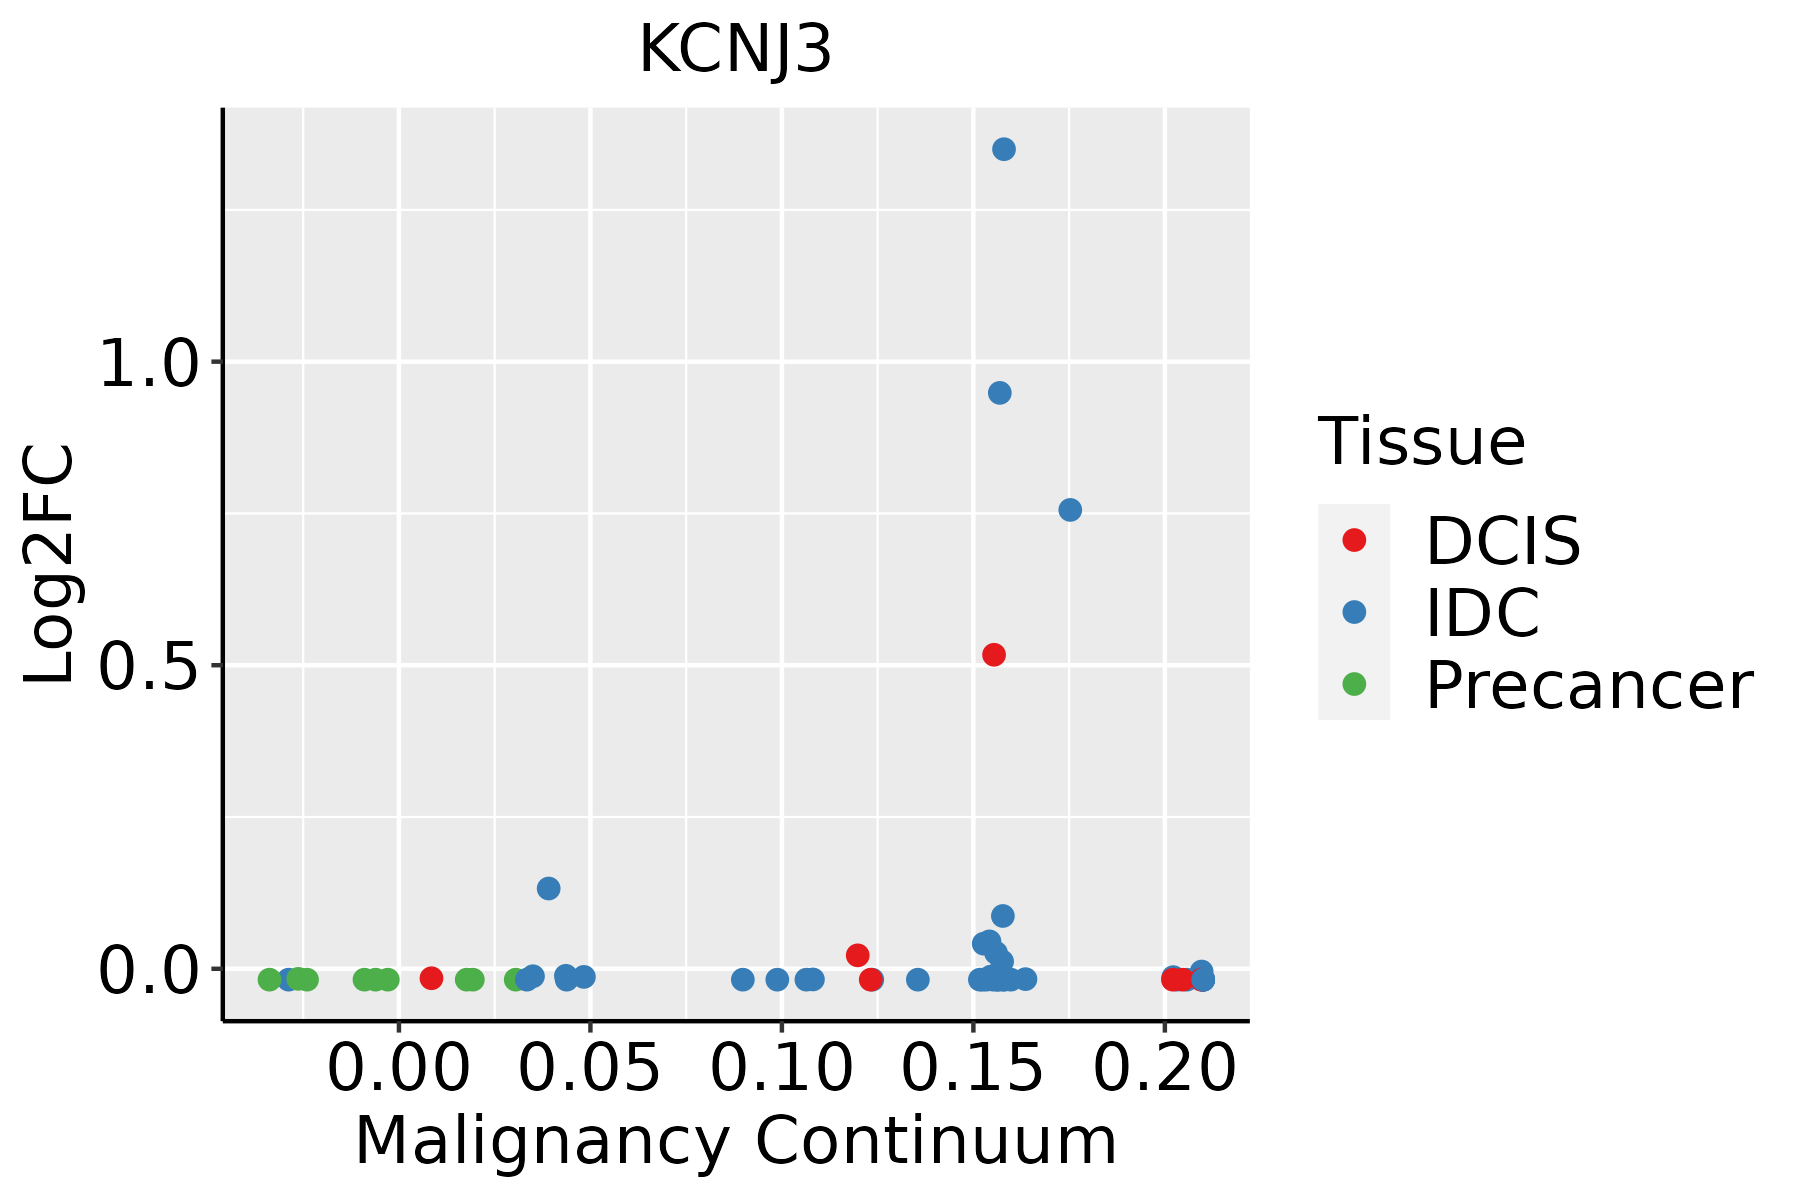 | IDC: Invasive ductal carcinoma |
| DCIS: Ductal carcinoma in situ | ||
| Precancer(BRCA1-mut): Precancerous lesion from BRCA1 mutation carriers | ||
| Colorectum (GSE201348) |  | FAP: Familial adenomatous polyposis |
| CRC: Colorectal cancer | ||
| Colorectum (HTA11) |  | AD: Adenomas |
| SER: Sessile serrated lesions | ||
| MSI-H: Microsatellite-high colorectal cancer | ||
| MSS: Microsatellite stable colorectal cancer | ||
| Liver |  | HCC: Hepatocellular carcinoma |
| NAFLD: Non-alcoholic fatty liver disease |
| ∗log2FC in expression of this searched gene in stem-like cells from each diseased tissue sample relative to stem-like cells in normal samples in each tissue plotted against the malignancy continuum. Samples are colored based on if they are from different disease stage. |
Top |
Malignant transformation related pathway analysis |
| Find out the enriched GO biological processes and KEGG pathways involved in transition from healthy to precancer to cancer |
| Tissue | Disease Stage | Enriched GO biological Processes |
| Colorectum | AD |  |
| Colorectum | SER |  |
| Colorectum | MSS |  |
| Colorectum | MSI-H |  |
| Colorectum | FAP |  |
| ∗Top 15 enriched GO BP terms are showed in the bar plot of each disease state in each tissue. Each row represents a significant GO biological process which is colored according to the -log10(p.adjust). |
| Page: 1 2 3 4 5 6 7 8 9 |
| GO ID | Tissue | Disease Stage | Description | Gene Ratio | Bg Ratio | pvalue | p.adjust | Count |
| GO:008606511 | Breast | IDC | cell communication involved in cardiac conduction | 13/1434 | 58/18723 | 3.59e-04 | 5.18e-03 | 13 |
| GO:00613373 | Breast | IDC | cardiac conduction | 16/1434 | 98/18723 | 3.06e-03 | 2.60e-02 | 16 |
| GO:00423912 | Breast | IDC | regulation of membrane potential | 49/1434 | 434/18723 | 4.04e-03 | 3.25e-02 | 49 |
| GO:00860015 | Breast | IDC | cardiac muscle cell action potential | 13/1434 | 76/18723 | 4.81e-03 | 3.67e-02 | 13 |
| GO:00020271 | Breast | IDC | regulation of heart rate | 16/1434 | 103/18723 | 5.06e-03 | 3.79e-02 | 16 |
| GO:00030125 | Breast | IDC | muscle system process | 50/1434 | 452/18723 | 5.52e-03 | 4.05e-02 | 50 |
| GO:00015082 | Breast | IDC | action potential | 19/1434 | 134/18723 | 6.62e-03 | 4.62e-02 | 19 |
| GO:008606521 | Breast | DCIS | cell communication involved in cardiac conduction | 12/1390 | 58/18723 | 9.71e-04 | 1.08e-02 | 12 |
| GO:000301212 | Breast | DCIS | muscle system process | 50/1390 | 452/18723 | 3.02e-03 | 2.57e-02 | 50 |
| GO:006133711 | Breast | DCIS | cardiac conduction | 15/1390 | 98/18723 | 5.65e-03 | 4.09e-02 | 15 |
| GO:00423911 | Breast | DCIS | regulation of membrane potential | 47/1390 | 434/18723 | 5.87e-03 | 4.20e-02 | 47 |
| GO:00300482 | Colorectum | MSS | actin filament-based movement | 44/3467 | 127/18723 | 1.11e-05 | 2.64e-04 | 44 |
| GO:0086001 | Colorectum | MSS | cardiac muscle cell action potential | 26/3467 | 76/18723 | 8.18e-04 | 8.59e-03 | 26 |
| GO:0086065 | Colorectum | MSS | cell communication involved in cardiac conduction | 21/3467 | 58/18723 | 1.11e-03 | 1.09e-02 | 21 |
| GO:0086005 | Colorectum | MSS | ventricular cardiac muscle cell action potential | 14/3467 | 35/18723 | 2.50e-03 | 2.01e-02 | 14 |
| GO:0086091 | Colorectum | MSS | regulation of heart rate by cardiac conduction | 15/3467 | 39/18723 | 2.80e-03 | 2.19e-02 | 15 |
| GO:0070252 | Colorectum | MSS | actin-mediated cell contraction | 29/3467 | 97/18723 | 4.38e-03 | 3.10e-02 | 29 |
| GO:0086003 | Colorectum | MSS | cardiac muscle cell contraction | 23/3467 | 73/18723 | 5.22e-03 | 3.57e-02 | 23 |
| GO:00030121 | Colorectum | MSS | muscle system process | 105/3467 | 452/18723 | 6.39e-03 | 4.26e-02 | 105 |
| GO:00860651 | Colorectum | MSI-H | cell communication involved in cardiac conduction | 12/1319 | 58/18723 | 6.11e-04 | 1.20e-02 | 12 |
| Page: 1 2 |
| Pathway ID | Tissue | Disease Stage | Description | Gene Ratio | Bg Ratio | pvalue | p.adjust | qvalue | Count |
| hsa0491523 | Breast | IDC | Estrogen signaling pathway | 35/867 | 138/8465 | 2.55e-07 | 5.18e-06 | 3.88e-06 | 35 |
| hsa0472323 | Breast | IDC | Retrograde endocannabinoid signaling | 31/867 | 148/8465 | 7.62e-05 | 7.50e-04 | 5.61e-04 | 31 |
| hsa0491533 | Breast | IDC | Estrogen signaling pathway | 35/867 | 138/8465 | 2.55e-07 | 5.18e-06 | 3.88e-06 | 35 |
| hsa0472333 | Breast | IDC | Retrograde endocannabinoid signaling | 31/867 | 148/8465 | 7.62e-05 | 7.50e-04 | 5.61e-04 | 31 |
| hsa0491542 | Breast | DCIS | Estrogen signaling pathway | 35/846 | 138/8465 | 1.40e-07 | 2.51e-06 | 1.85e-06 | 35 |
| hsa0472342 | Breast | DCIS | Retrograde endocannabinoid signaling | 29/846 | 148/8465 | 2.82e-04 | 2.34e-03 | 1.72e-03 | 29 |
| hsa0491552 | Breast | DCIS | Estrogen signaling pathway | 35/846 | 138/8465 | 1.40e-07 | 2.51e-06 | 1.85e-06 | 35 |
| hsa0472352 | Breast | DCIS | Retrograde endocannabinoid signaling | 29/846 | 148/8465 | 2.82e-04 | 2.34e-03 | 1.72e-03 | 29 |
| hsa047234 | Colorectum | MSS | Retrograde endocannabinoid signaling | 61/1875 | 148/8465 | 1.21e-07 | 1.93e-06 | 1.18e-06 | 61 |
| hsa049152 | Colorectum | MSS | Estrogen signaling pathway | 48/1875 | 138/8465 | 4.23e-04 | 3.08e-03 | 1.89e-03 | 48 |
| hsa047284 | Colorectum | MSS | Dopaminergic synapse | 45/1875 | 132/8465 | 1.02e-03 | 5.94e-03 | 3.64e-03 | 45 |
| hsa04713 | Colorectum | MSS | Circadian entrainment | 32/1875 | 97/8465 | 8.84e-03 | 3.25e-02 | 1.99e-02 | 32 |
| hsa04725 | Colorectum | MSS | Cholinergic synapse | 36/1875 | 113/8465 | 1.05e-02 | 3.69e-02 | 2.26e-02 | 36 |
| hsa047235 | Colorectum | MSS | Retrograde endocannabinoid signaling | 61/1875 | 148/8465 | 1.21e-07 | 1.93e-06 | 1.18e-06 | 61 |
| hsa049153 | Colorectum | MSS | Estrogen signaling pathway | 48/1875 | 138/8465 | 4.23e-04 | 3.08e-03 | 1.89e-03 | 48 |
| hsa047285 | Colorectum | MSS | Dopaminergic synapse | 45/1875 | 132/8465 | 1.02e-03 | 5.94e-03 | 3.64e-03 | 45 |
| hsa047131 | Colorectum | MSS | Circadian entrainment | 32/1875 | 97/8465 | 8.84e-03 | 3.25e-02 | 1.99e-02 | 32 |
| hsa047251 | Colorectum | MSS | Cholinergic synapse | 36/1875 | 113/8465 | 1.05e-02 | 3.69e-02 | 2.26e-02 | 36 |
| hsa047236 | Colorectum | MSI-H | Retrograde endocannabinoid signaling | 33/797 | 148/8465 | 1.88e-06 | 3.21e-05 | 2.69e-05 | 33 |
| hsa047237 | Colorectum | MSI-H | Retrograde endocannabinoid signaling | 33/797 | 148/8465 | 1.88e-06 | 3.21e-05 | 2.69e-05 | 33 |
| Page: 1 2 |
Top |
Cell-cell communication analysis |
| Identification of potential cell-cell interactions between two cell types and their ligand-receptor pairs for different disease states |
| Ligand | Receptor | LRpair | Pathway | Tissue | Disease Stage |
| Page: 1 |
Top |
Single-cell gene regulatory network inference analysis |
| Find out the significant the regulons (TFs) and the target genes of each regulon across cell types for different disease states |
| TF | Cell Type | Tissue | Disease Stage | Target Gene | RSS | Regulon Activity |
| ∗The dot plots of a searched regulon are shown for all cell subpopulations in each disease state of each tissue based on the regulon specific score inferred using pySCENIC and by calculating the average expression. |
| Page: 1 |
Top |
Somatic mutation of malignant transformation related genes |
| Annotation of somatic variants for genes involved in malignant transformation |
| Hugo Symbol | Variant Class | Variant Classification | dbSNP RS | HGVSc | HGVSp | HGVSp Short | SWISSPROT | BIOTYPE | SIFT | PolyPhen | Tumor Sample Barcode | Tissue | Histology | Sex | Age | Stage | Therapy Types | Drugs | Outcome |
| KCNJ3 | SNV | Missense_Mutation | novel | c.373N>T | p.Ala125Ser | p.A125S | P48549 | protein_coding | tolerated(0.77) | benign(0.115) | TCGA-A2-A25A-01 | Breast | breast invasive carcinoma | Female | <65 | I/II | Unspecific | Cytoxan | SD |
| KCNJ3 | SNV | Missense_Mutation | c.173G>T | p.Gly58Val | p.G58V | P48549 | protein_coding | tolerated(0.09) | possibly_damaging(0.84) | TCGA-BH-A0BL-01 | Breast | breast invasive carcinoma | Female | <65 | I/II | Chemotherapy | adriamycin | CR | |
| KCNJ3 | SNV | Missense_Mutation | novel | c.1063N>A | p.Pro355Thr | p.P355T | P48549 | protein_coding | tolerated(0.16) | benign(0.025) | TCGA-GI-A2C9-01 | Breast | breast invasive carcinoma | Female | <65 | I/II | Unspecific | SD | |
| KCNJ3 | SNV | Missense_Mutation | novel | c.806C>T | p.Thr269Ile | p.T269I | P48549 | protein_coding | tolerated(0.44) | benign(0.114) | TCGA-2W-A8YY-01 | Cervix | cervical & endocervical cancer | Female | <65 | I/II | Chemotherapy | cisplatin | CR |
| KCNJ3 | SNV | Missense_Mutation | c.5N>T | p.Ser2Phe | p.S2F | P48549 | protein_coding | deleterious_low_confidence(0) | possibly_damaging(0.641) | TCGA-AA-3492-01 | Colorectum | colon adenocarcinoma | Female | >=65 | I/II | Unknown | Unknown | SD | |
| KCNJ3 | SNV | Missense_Mutation | c.790C>A | p.Leu264Ile | p.L264I | P48549 | protein_coding | deleterious(0.02) | probably_damaging(1) | TCGA-AA-3510-01 | Colorectum | colon adenocarcinoma | Male | >=65 | I/II | Unknown | Unknown | SD | |
| KCNJ3 | SNV | Missense_Mutation | c.676N>A | p.Ala226Thr | p.A226T | P48549 | protein_coding | deleterious(0) | probably_damaging(0.997) | TCGA-AA-3713-01 | Colorectum | colon adenocarcinoma | Male | >=65 | III/IV | Chemotherapy | 5-fluorouracil | PR | |
| KCNJ3 | SNV | Missense_Mutation | c.471G>T | p.Glu157Asp | p.E157D | P48549 | protein_coding | deleterious(0) | probably_damaging(0.981) | TCGA-AA-3864-01 | Colorectum | colon adenocarcinoma | Male | >=65 | I/II | Unknown | Unknown | SD | |
| KCNJ3 | SNV | Missense_Mutation | novel | c.1456G>A | p.Gly486Arg | p.G486R | P48549 | protein_coding | deleterious_low_confidence(0.01) | possibly_damaging(0.603) | TCGA-AA-3975-01 | Colorectum | colon adenocarcinoma | Male | >=65 | I/II | Unknown | Unknown | SD |
| KCNJ3 | SNV | Missense_Mutation | novel | c.1151A>T | p.Asn384Ile | p.N384I | P48549 | protein_coding | tolerated(0.36) | benign(0.038) | TCGA-AA-3984-01 | Colorectum | colon adenocarcinoma | Female | <65 | I/II | Unknown | Unknown | SD |
| Page: 1 2 3 4 5 6 7 8 9 10 11 12 13 14 15 |
Top |
Related drugs of malignant transformation related genes |
| Identification of chemicals and drugs interact with genes involved in malignant transfromation |
| (DGIdb 4.0) |
| Entrez ID | Symbol | Category | Interaction Types | Drug Claim Name | Drug Name | PMIDs |
| 3760 | KCNJ3 | EXTERNAL SIDE OF PLASMA MEMBRANE, ION CHANNEL, DRUGGABLE GENOME | activator | 135652743 | ||
| 3760 | KCNJ3 | EXTERNAL SIDE OF PLASMA MEMBRANE, ION CHANNEL, DRUGGABLE GENOME | activator | 223366101 | ||
| 3760 | KCNJ3 | EXTERNAL SIDE OF PLASMA MEMBRANE, ION CHANNEL, DRUGGABLE GENOME | blocker | 223366037 | ||
| 3760 | KCNJ3 | EXTERNAL SIDE OF PLASMA MEMBRANE, ION CHANNEL, DRUGGABLE GENOME | CLOZAPINE | CLOZAPINE | 10780978 | |
| 3760 | KCNJ3 | EXTERNAL SIDE OF PLASMA MEMBRANE, ION CHANNEL, DRUGGABLE GENOME | FLUPIRTINE | FLUPIRTINE | ||
| 3760 | KCNJ3 | EXTERNAL SIDE OF PLASMA MEMBRANE, ION CHANNEL, DRUGGABLE GENOME | blocker | 135652729 | ||
| 3760 | KCNJ3 | EXTERNAL SIDE OF PLASMA MEMBRANE, ION CHANNEL, DRUGGABLE GENOME | THYROTROPIN | THYROTROPIN | 10075694 |
| Page: 1 |

Copyright 2023-Present -The University of Texas Health Science Center at Houston |