
|
|||||
|
 | |
| |
| |
| |
| |
| |
|
Gene: KCNJ16 |
Gene summary for KCNJ16 |
| Gene information | Species | Human | Gene symbol | KCNJ16 | Gene ID | 3773 |
| Gene name | potassium inwardly rectifying channel subfamily J member 16 | |
| Gene Alias | BIR9 | |
| Cytomap | 17q24.3 | |
| Gene Type | protein-coding | GO ID | GO:0006810 | UniProtAcc | Q9NPI9 |
Top |
Malignant transformation analysis |
| Identification of the aberrant gene expression in precancerous and cancerous lesions by comparing the gene expression of stem-like cells in diseased tissues with normal stem cells |
| Entrez ID | Symbol | Replicates | Species | Organ | Tissue | Adj P-value | Log2FC | Malignancy |
| 3773 | KCNJ16 | Adj_PTCwithHT_6 | Human | Thyroid | HT | 1.68e-15 | -5.04e-01 | 0.02 |
| 3773 | KCNJ16 | Adj_PTCwithHT_8 | Human | Thyroid | HT | 1.04e-04 | -4.11e-01 | 0.0267 |
| 3773 | KCNJ16 | PTCwithHT_1 | Human | Thyroid | HT | 1.35e-03 | -5.10e-01 | 0.0238 |
| 3773 | KCNJ16 | PTCwithHT_6 | Human | Thyroid | HT | 4.25e-14 | -4.92e-01 | 0.02 |
| 3773 | KCNJ16 | PTCwithHT_8 | Human | Thyroid | HT | 6.41e-06 | -3.53e-01 | 0.0351 |
| 3773 | KCNJ16 | PTCwithoutHT_2 | Human | Thyroid | PTC | 4.62e-09 | -4.24e-01 | 0.0419 |
| 3773 | KCNJ16 | male-WTA | Human | Thyroid | PTC | 5.71e-63 | 6.95e-01 | 0.1037 |
| 3773 | KCNJ16 | PTC01 | Human | Thyroid | PTC | 1.07e-12 | 6.19e-01 | 0.1899 |
| 3773 | KCNJ16 | PTC04 | Human | Thyroid | PTC | 4.20e-02 | 3.73e-01 | 0.1927 |
| 3773 | KCNJ16 | PTC05 | Human | Thyroid | PTC | 1.29e-15 | 1.29e+00 | 0.2065 |
| 3773 | KCNJ16 | PTC06 | Human | Thyroid | PTC | 1.10e-48 | 2.02e+00 | 0.2057 |
| 3773 | KCNJ16 | PTC07 | Human | Thyroid | PTC | 8.38e-42 | 1.28e+00 | 0.2044 |
| 3773 | KCNJ16 | ATC09 | Human | Thyroid | ATC | 3.28e-03 | -4.94e-01 | 0.2871 |
| 3773 | KCNJ16 | ATC12 | Human | Thyroid | ATC | 3.77e-15 | -5.10e-01 | 0.34 |
| 3773 | KCNJ16 | ATC13 | Human | Thyroid | ATC | 4.70e-13 | -5.10e-01 | 0.34 |
| 3773 | KCNJ16 | ATC1 | Human | Thyroid | ATC | 2.68e-02 | -4.92e-01 | 0.2878 |
| 3773 | KCNJ16 | ATC4 | Human | Thyroid | ATC | 1.42e-13 | -5.10e-01 | 0.34 |
| 3773 | KCNJ16 | ATC5 | Human | Thyroid | ATC | 4.70e-13 | -5.10e-01 | 0.34 |
| Page: 1 |
| Tissue | Expression Dynamics | Abbreviation |
| Thyroid | 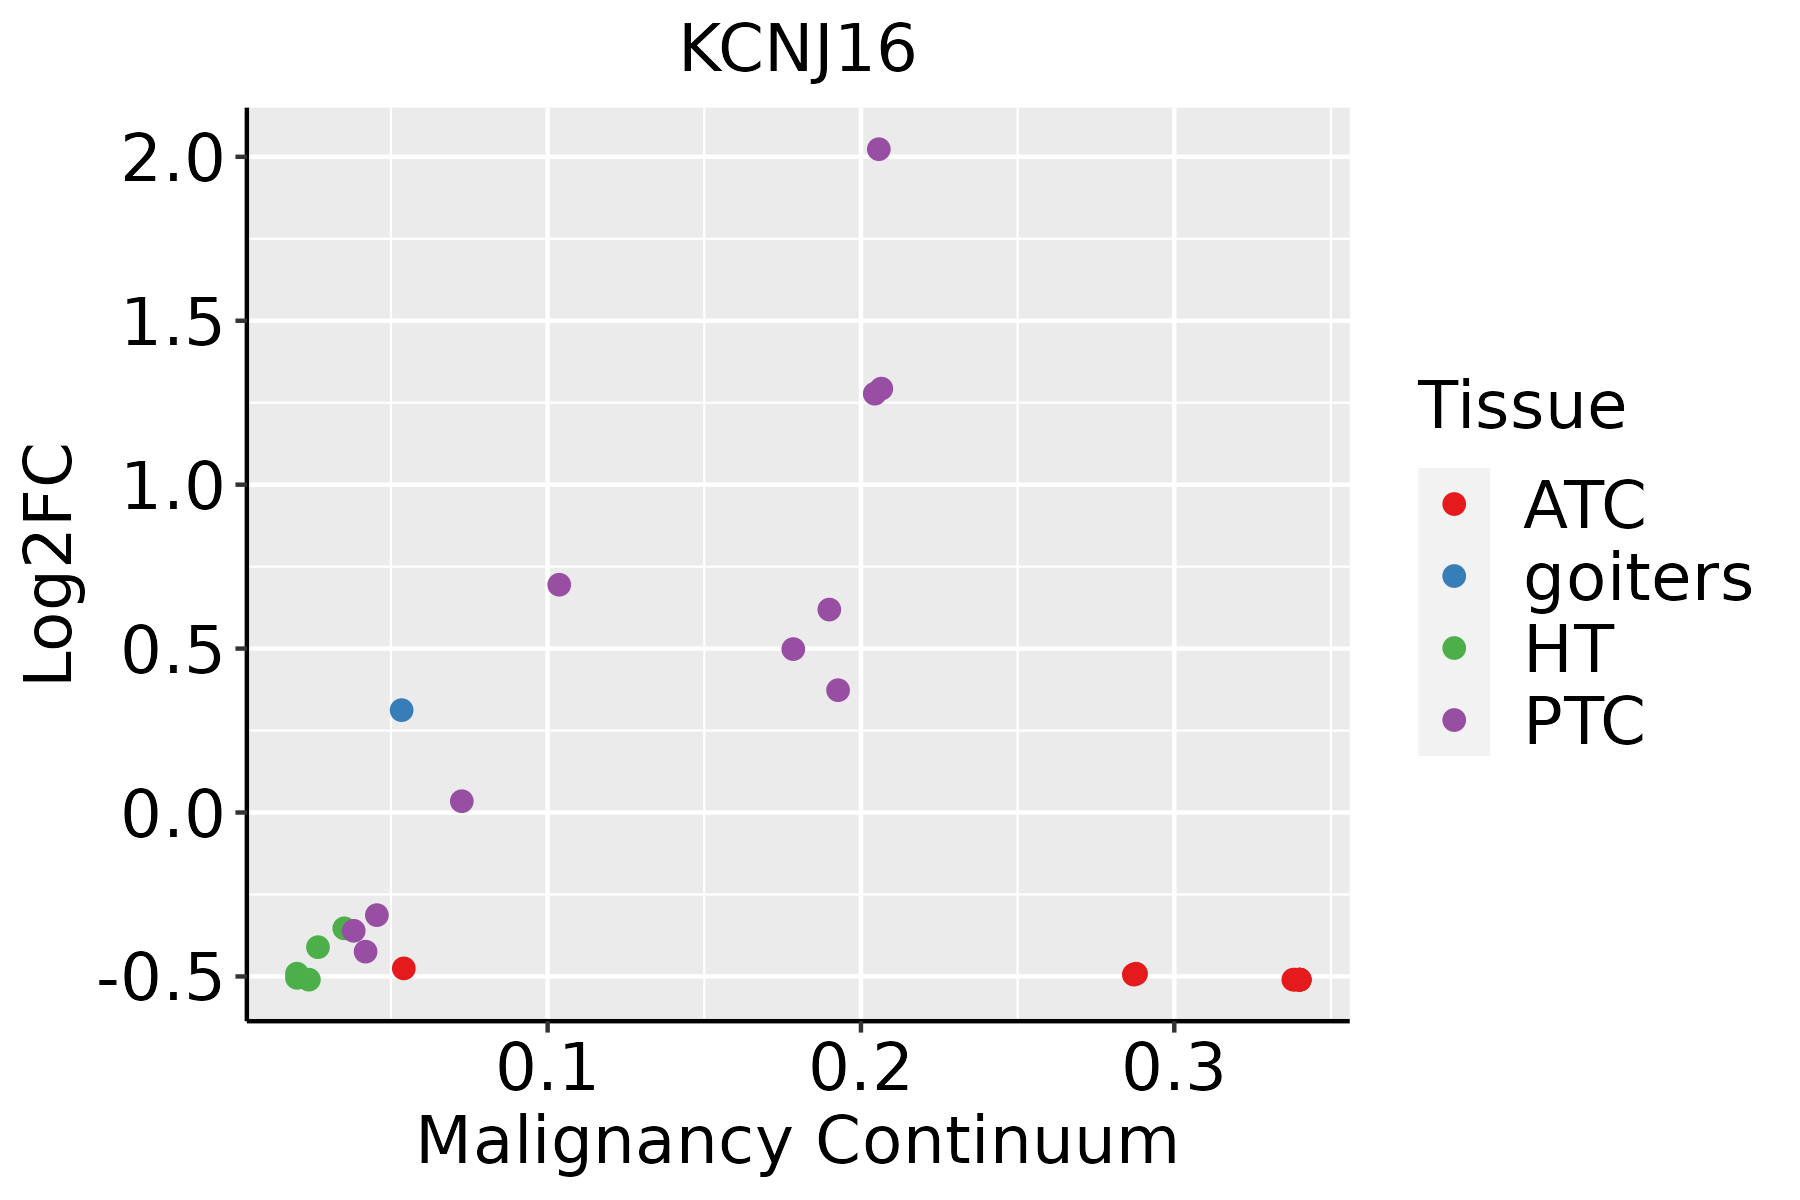 | ATC: Anaplastic thyroid cancer |
| HT: Hashimoto's thyroiditis | ||
| PTC: Papillary thyroid cancer |
| ∗log2FC in expression of this searched gene in stem-like cells from each diseased tissue sample relative to stem-like cells in normal samples in each tissue plotted against the malignancy continuum. Samples are colored based on if they are from different disease stage. |
Top |
Malignant transformation related pathway analysis |
| Find out the enriched GO biological processes and KEGG pathways involved in transition from healthy to precancer to cancer |
| Tissue | Disease Stage | Enriched GO biological Processes |
| Colorectum | AD |  |
| Colorectum | SER |  |
| Colorectum | MSS |  |
| Colorectum | MSI-H |  |
| Colorectum | FAP |  |
| ∗Top 15 enriched GO BP terms are showed in the bar plot of each disease state in each tissue. Each row represents a significant GO biological process which is colored according to the -log10(p.adjust). |
| Page: 1 2 3 4 5 6 7 8 9 |
| GO ID | Tissue | Disease Stage | Description | Gene Ratio | Bg Ratio | pvalue | p.adjust | Count |
| Page: 1 |
| Pathway ID | Tissue | Disease Stage | Description | Gene Ratio | Bg Ratio | pvalue | p.adjust | qvalue | Count |
| Page: 1 |
Top |
Cell-cell communication analysis |
| Identification of potential cell-cell interactions between two cell types and their ligand-receptor pairs for different disease states |
| Ligand | Receptor | LRpair | Pathway | Tissue | Disease Stage |
| Page: 1 |
Top |
Single-cell gene regulatory network inference analysis |
| Find out the significant the regulons (TFs) and the target genes of each regulon across cell types for different disease states |
| TF | Cell Type | Tissue | Disease Stage | Target Gene | RSS | Regulon Activity |
| ∗The dot plots of a searched regulon are shown for all cell subpopulations in each disease state of each tissue based on the regulon specific score inferred using pySCENIC and by calculating the average expression. |
| Page: 1 |
Top |
Somatic mutation of malignant transformation related genes |
| Annotation of somatic variants for genes involved in malignant transformation |
| Hugo Symbol | Variant Class | Variant Classification | dbSNP RS | HGVSc | HGVSp | HGVSp Short | SWISSPROT | BIOTYPE | SIFT | PolyPhen | Tumor Sample Barcode | Tissue | Histology | Sex | Age | Stage | Therapy Types | Drugs | Outcome |
| KCNJ16 | SNV | Missense_Mutation | novel | c.1048N>C | p.Glu350Gln | p.E350Q | protein_coding | tolerated(0.35) | benign(0.079) | TCGA-5L-AAT1-01 | Breast | breast invasive carcinoma | Female | <65 | III/IV | Hormone Therapy | letrozol | SD | |
| KCNJ16 | SNV | Missense_Mutation | c.1018N>A | p.Leu340Ile | p.L340I | protein_coding | deleterious(0.01) | probably_damaging(0.998) | TCGA-AN-A0AK-01 | Breast | breast invasive carcinoma | Female | >=65 | I/II | Unknown | Unknown | SD | ||
| KCNJ16 | SNV | Missense_Mutation | novel | c.336T>G | p.Phe112Leu | p.F112L | protein_coding | deleterious(0) | benign(0.143) | TCGA-AR-A1AW-01 | Breast | breast invasive carcinoma | Female | >=65 | I/II | Chemotherapy | docetaxel | SD | |
| KCNJ16 | SNV | Missense_Mutation | c.148N>T | p.Ala50Ser | p.A50S | protein_coding | tolerated(0.4) | benign(0.007) | TCGA-AR-A251-01 | Breast | breast invasive carcinoma | Female | <65 | III/IV | Chemotherapy | doxorubicin | SD | ||
| KCNJ16 | insertion | In_Frame_Ins | novel | c.580_581insATT | p.Ile194delinsAsnPhe | p.I194delinsNF | protein_coding | TCGA-AO-A128-01 | Breast | breast invasive carcinoma | Female | <65 | I/II | Chemotherapy | doxorubicin | SD | |||
| KCNJ16 | insertion | Frame_Shift_Ins | novel | c.556_557insGTTTTGTAGTAGTAAGAAT | p.Ile186SerfsTer61 | p.I186Sfs*61 | protein_coding | TCGA-AR-A0U0-01 | Breast | breast invasive carcinoma | Female | >=65 | I/II | Unknown | Unknown | SD | |||
| KCNJ16 | insertion | Nonsense_Mutation | novel | c.558_559insTAGACTTGTTGCTATTT | p.Leu187Ter | p.L187* | protein_coding | TCGA-AR-A0U0-01 | Breast | breast invasive carcinoma | Female | >=65 | I/II | Unknown | Unknown | SD | |||
| KCNJ16 | SNV | Missense_Mutation | c.108N>A | p.Met36Ile | p.M36I | protein_coding | tolerated_low_confidence(0.26) | benign(0.311) | TCGA-C5-A1MK-01 | Cervix | cervical & endocervical cancer | Female | >=65 | III/IV | Chemotherapy | carboplatin | PD | ||
| KCNJ16 | SNV | Missense_Mutation | novel | c.283G>C | p.Asp95His | p.D95H | protein_coding | deleterious(0) | probably_damaging(1) | TCGA-C5-A8ZZ-01 | Cervix | cervical & endocervical cancer | Female | <65 | I/II | Unspecific | Cisplatin | SD | |
| KCNJ16 | SNV | Missense_Mutation | c.223N>T | p.Asp75Tyr | p.D75Y | protein_coding | deleterious(0) | probably_damaging(1) | TCGA-FU-A3HZ-01 | Cervix | cervical & endocervical cancer | Female | <65 | I/II | Chemotherapy | cisplatin | CR |
| Page: 1 2 3 4 5 6 7 8 9 10 |
Top |
Related drugs of malignant transformation related genes |
| Identification of chemicals and drugs interact with genes involved in malignant transfromation |
| (DGIdb 4.0) |
| Entrez ID | Symbol | Category | Interaction Types | Drug Claim Name | Drug Name | PMIDs |
| Page: 1 |

Copyright 2023-Present -The University of Texas Health Science Center at Houston |