
|
|||||
|
 | |
| |
| |
| |
| |
| |
|
Gene: KCNJ15 |
Gene summary for KCNJ15 |
| Gene information | Species | Human | Gene symbol | KCNJ15 | Gene ID | 3772 |
| Gene name | potassium inwardly rectifying channel subfamily J member 15 | |
| Gene Alias | IRKK | |
| Cytomap | 21q22.13-q22.2 | |
| Gene Type | protein-coding | GO ID | GO:0006810 | UniProtAcc | Q99712 |
Top |
Malignant transformation analysis |
| Identification of the aberrant gene expression in precancerous and cancerous lesions by comparing the gene expression of stem-like cells in diseased tissues with normal stem cells |
| Entrez ID | Symbol | Replicates | Species | Organ | Tissue | Adj P-value | Log2FC | Malignancy |
| 3772 | KCNJ15 | LZE4T | Human | Esophagus | ESCC | 2.57e-05 | 2.08e-01 | 0.0811 |
| 3772 | KCNJ15 | LZE8T | Human | Esophagus | ESCC | 4.22e-05 | 2.10e-01 | 0.067 |
| 3772 | KCNJ15 | P2T-E | Human | Esophagus | ESCC | 2.91e-06 | -1.98e-02 | 0.1177 |
| 3772 | KCNJ15 | P4T-E | Human | Esophagus | ESCC | 6.11e-13 | 1.02e-01 | 0.1323 |
| 3772 | KCNJ15 | P5T-E | Human | Esophagus | ESCC | 8.35e-04 | -6.41e-02 | 0.1327 |
| 3772 | KCNJ15 | P9T-E | Human | Esophagus | ESCC | 1.44e-08 | 1.38e-01 | 0.1131 |
| 3772 | KCNJ15 | P10T-E | Human | Esophagus | ESCC | 9.11e-19 | 4.79e-01 | 0.116 |
| 3772 | KCNJ15 | P11T-E | Human | Esophagus | ESCC | 5.58e-05 | 4.58e-01 | 0.1426 |
| 3772 | KCNJ15 | P15T-E | Human | Esophagus | ESCC | 2.89e-12 | 2.73e-01 | 0.1149 |
| 3772 | KCNJ15 | P21T-E | Human | Esophagus | ESCC | 1.04e-21 | 5.09e-01 | 0.1617 |
| 3772 | KCNJ15 | P22T-E | Human | Esophagus | ESCC | 5.63e-29 | 6.49e-01 | 0.1236 |
| 3772 | KCNJ15 | P26T-E | Human | Esophagus | ESCC | 1.70e-17 | 4.24e-01 | 0.1276 |
| 3772 | KCNJ15 | P27T-E | Human | Esophagus | ESCC | 3.15e-07 | 1.30e-01 | 0.1055 |
| 3772 | KCNJ15 | P28T-E | Human | Esophagus | ESCC | 4.52e-07 | 1.72e-01 | 0.1149 |
| 3772 | KCNJ15 | P30T-E | Human | Esophagus | ESCC | 4.12e-12 | 2.99e-01 | 0.137 |
| 3772 | KCNJ15 | P31T-E | Human | Esophagus | ESCC | 6.16e-15 | 4.77e-01 | 0.1251 |
| 3772 | KCNJ15 | P37T-E | Human | Esophagus | ESCC | 2.34e-08 | 1.71e-01 | 0.1371 |
| 3772 | KCNJ15 | P42T-E | Human | Esophagus | ESCC | 1.45e-06 | 2.15e-01 | 0.1175 |
| 3772 | KCNJ15 | P48T-E | Human | Esophagus | ESCC | 2.54e-08 | 1.46e-01 | 0.0959 |
| 3772 | KCNJ15 | P52T-E | Human | Esophagus | ESCC | 8.44e-16 | 3.78e-01 | 0.1555 |
| Page: 1 2 3 4 |
| Tissue | Expression Dynamics | Abbreviation |
| Esophagus | 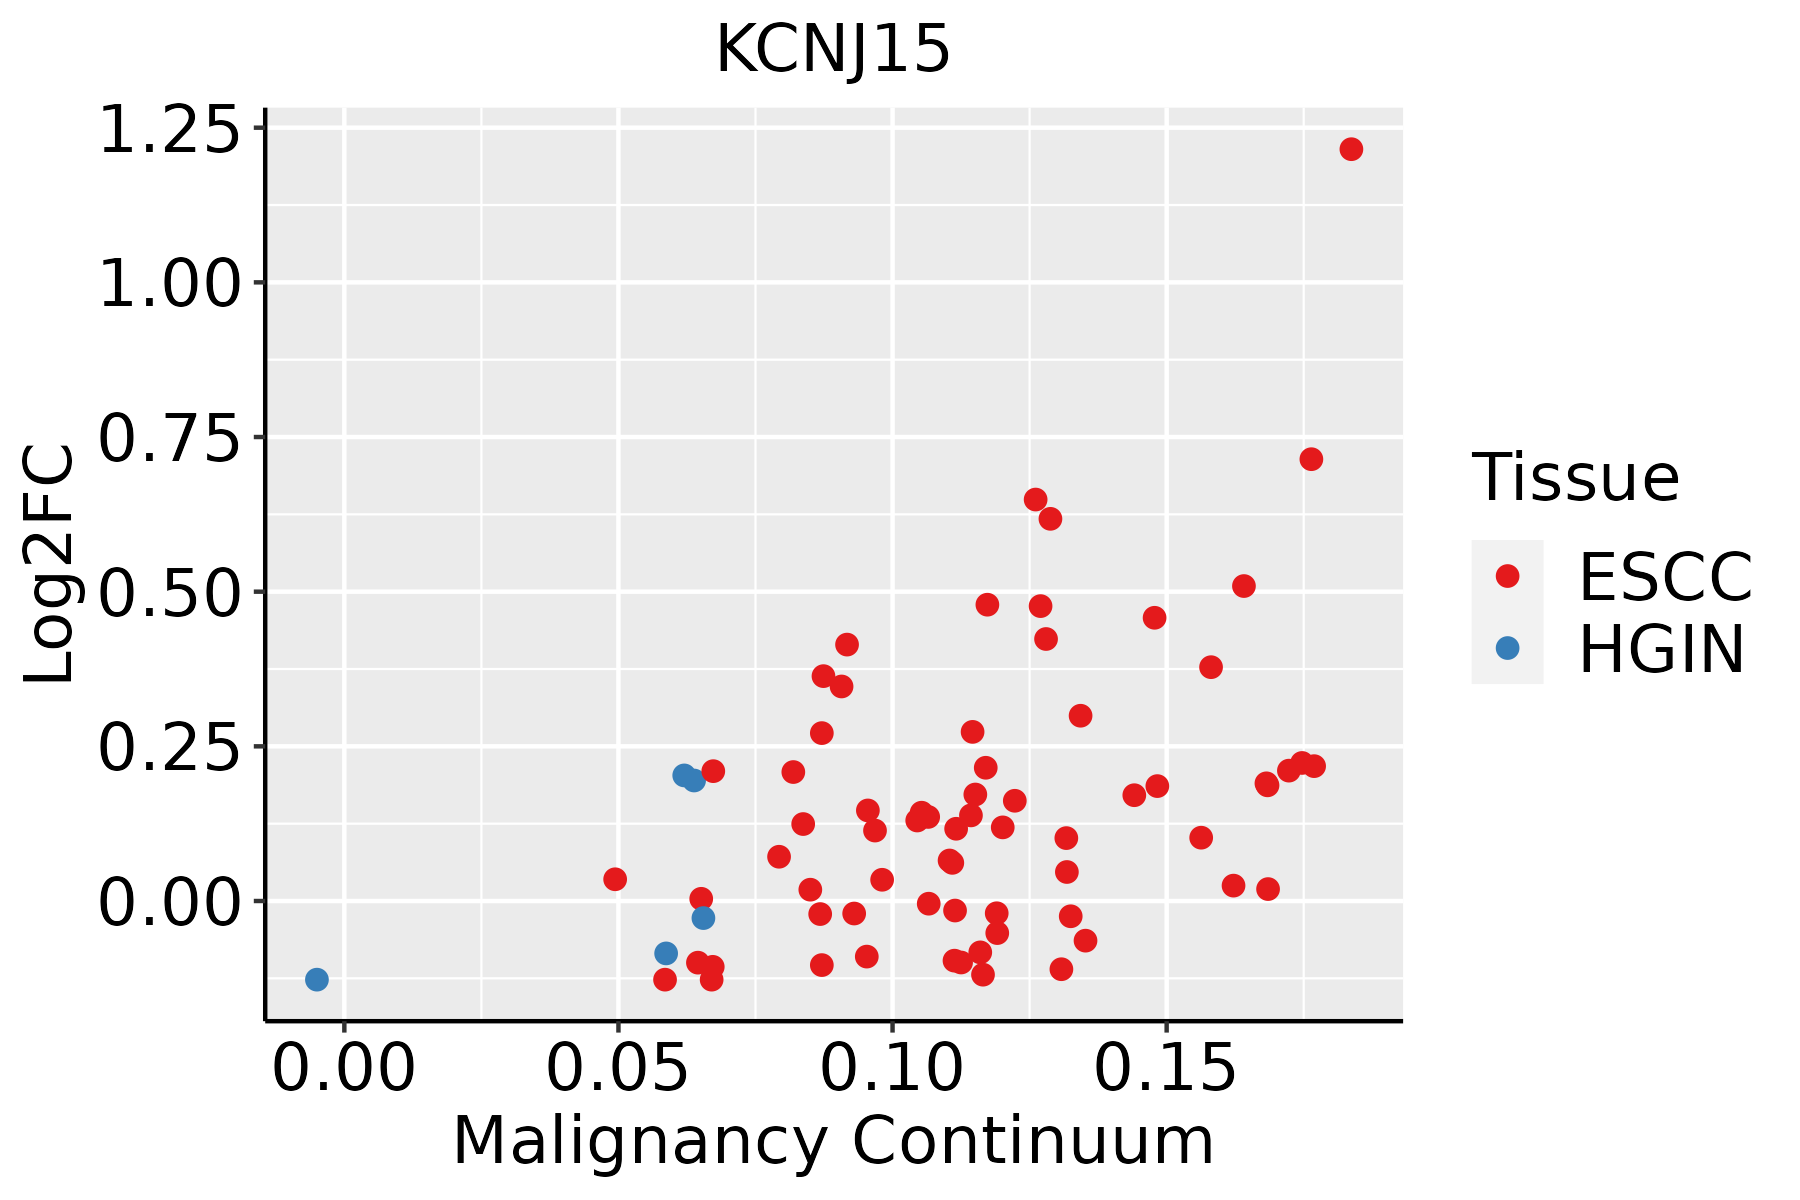 | ESCC: Esophageal squamous cell carcinoma |
| HGIN: High-grade intraepithelial neoplasias | ||
| LGIN: Low-grade intraepithelial neoplasias | ||
| Lung | 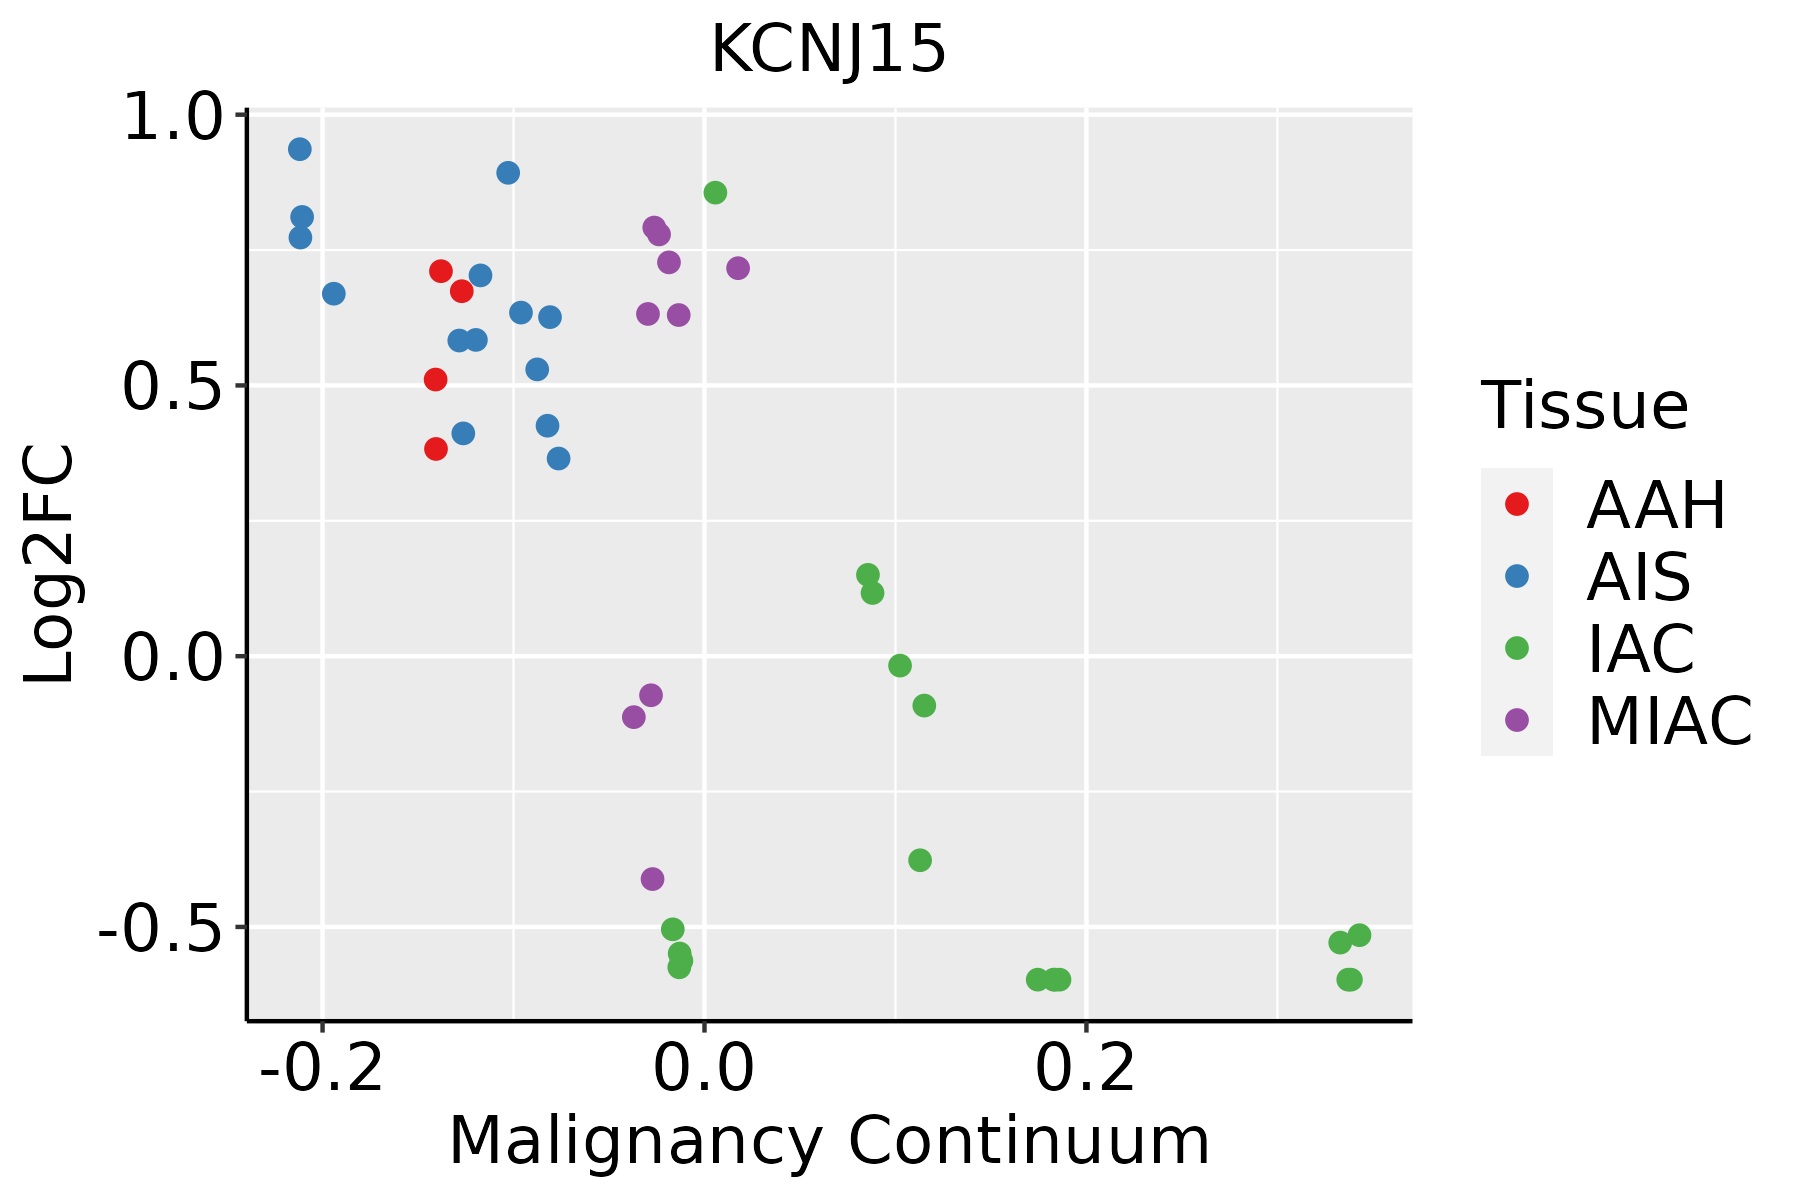 | AAH: Atypical adenomatous hyperplasia |
| AIS: Adenocarcinoma in situ | ||
| IAC: Invasive lung adenocarcinoma | ||
| MIA: Minimally invasive adenocarcinoma | ||
| Oral Cavity | 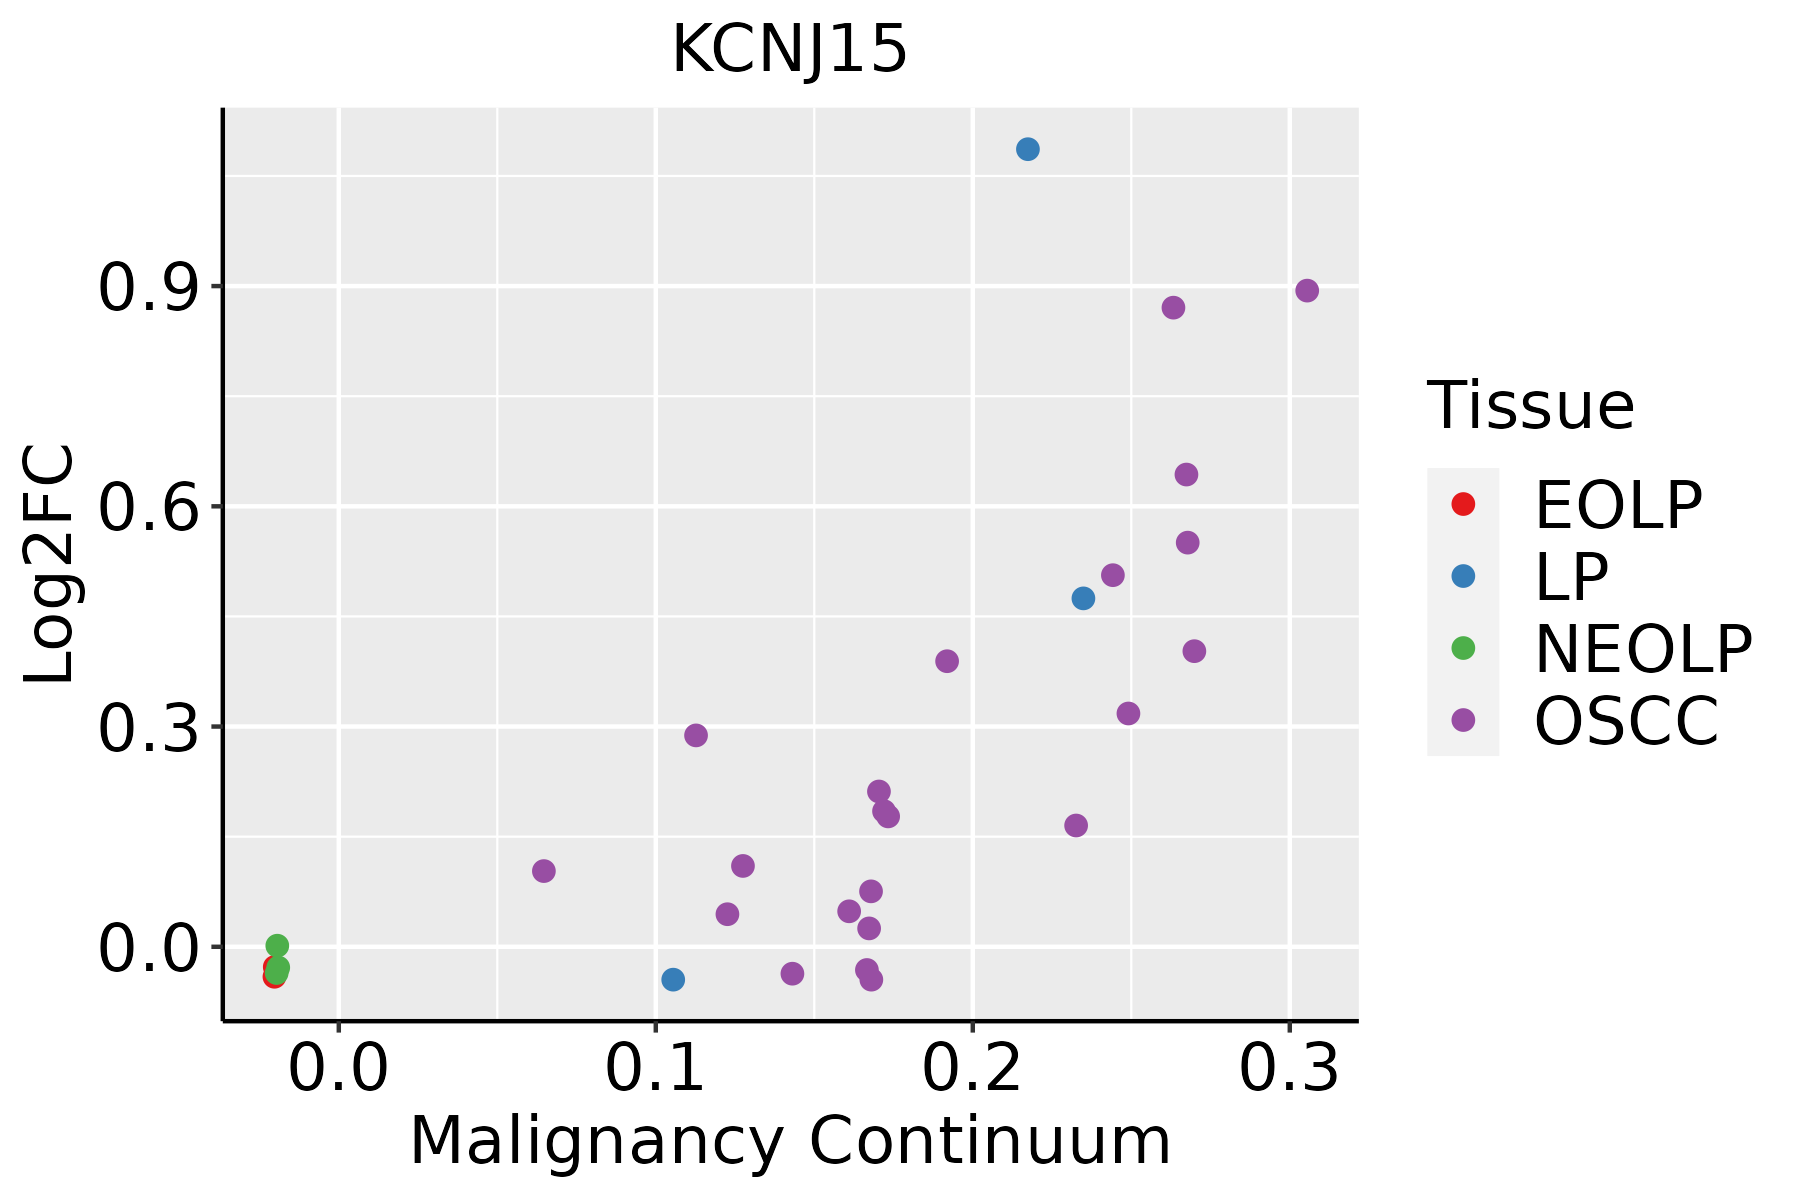 | EOLP: Erosive Oral lichen planus |
| LP: leukoplakia | ||
| NEOLP: Non-erosive oral lichen planus | ||
| OSCC: Oral squamous cell carcinoma | ||
| Skin | 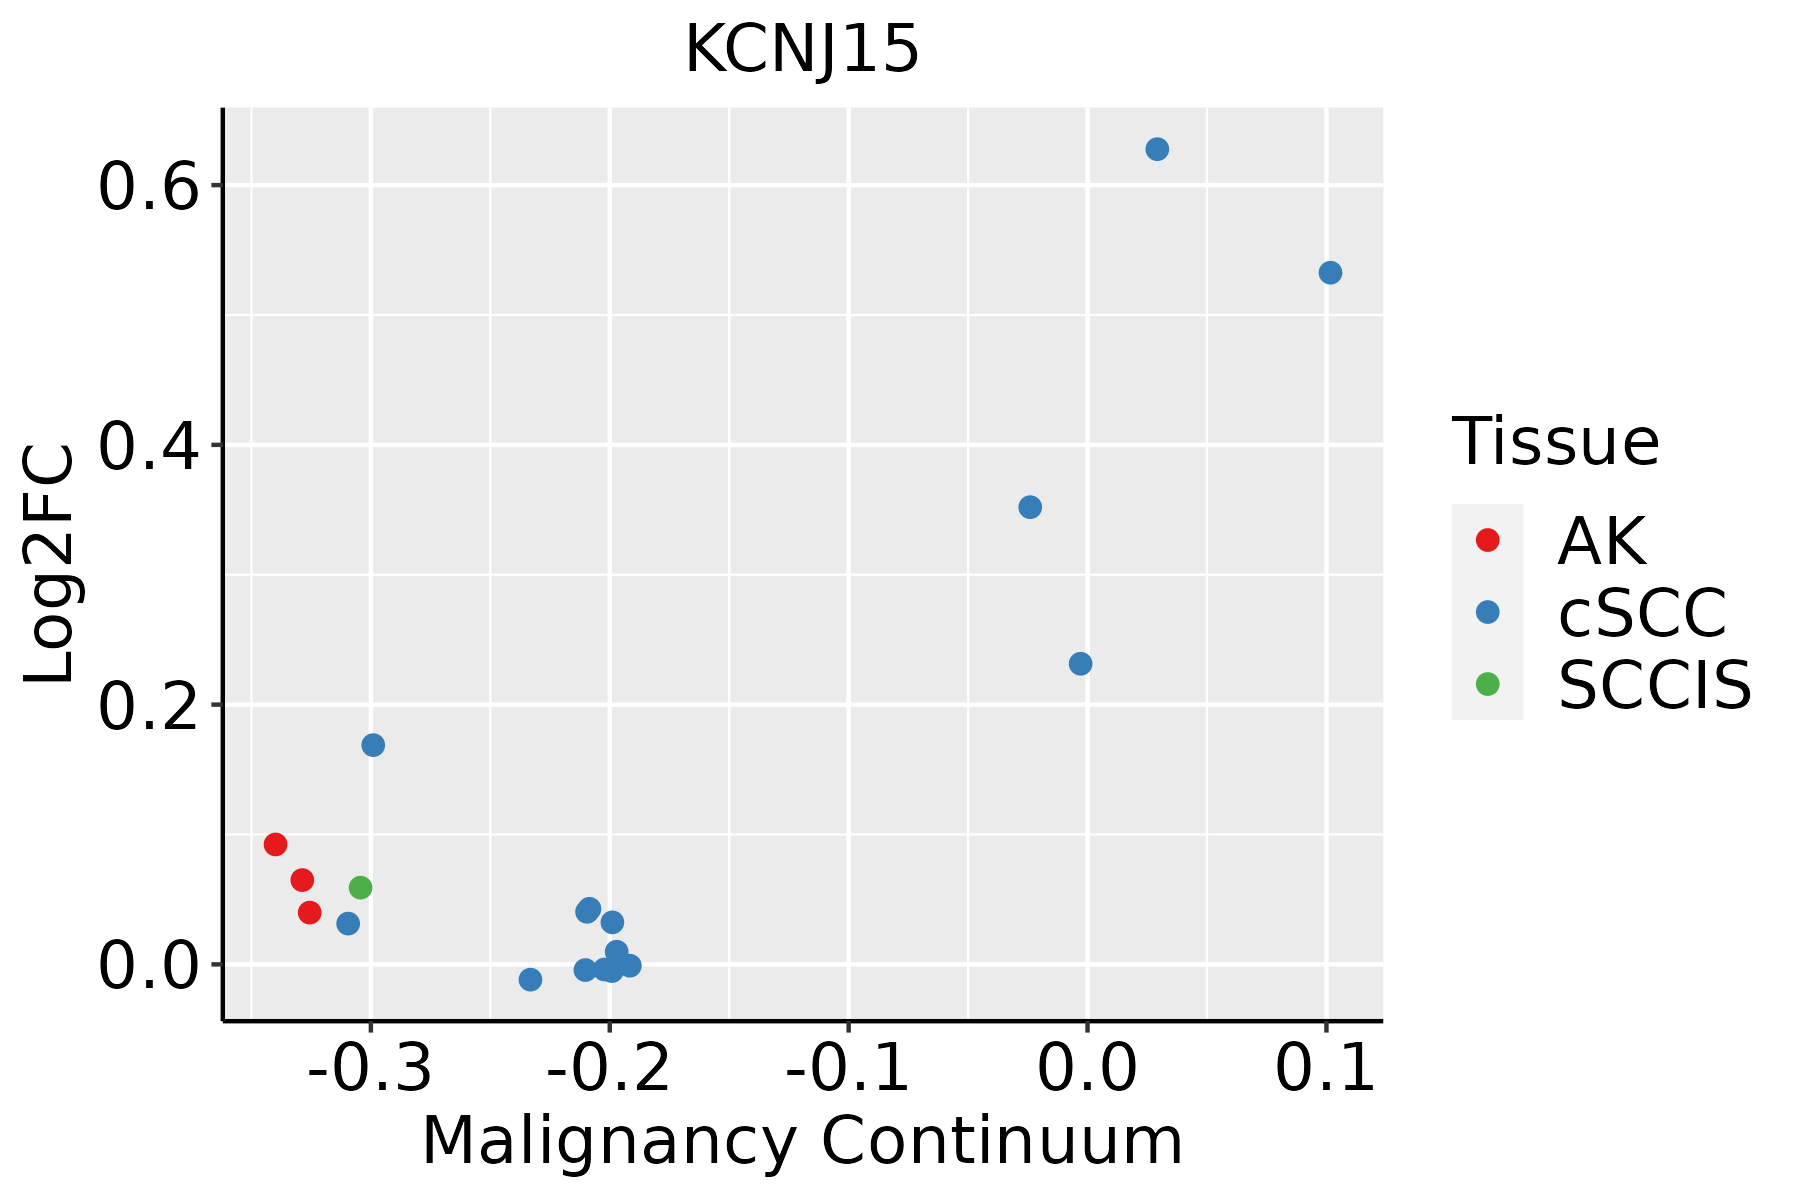 | AK: Actinic keratosis |
| cSCC: Cutaneous squamous cell carcinoma | ||
| SCCIS:squamous cell carcinoma in situ | ||
| Thyroid | 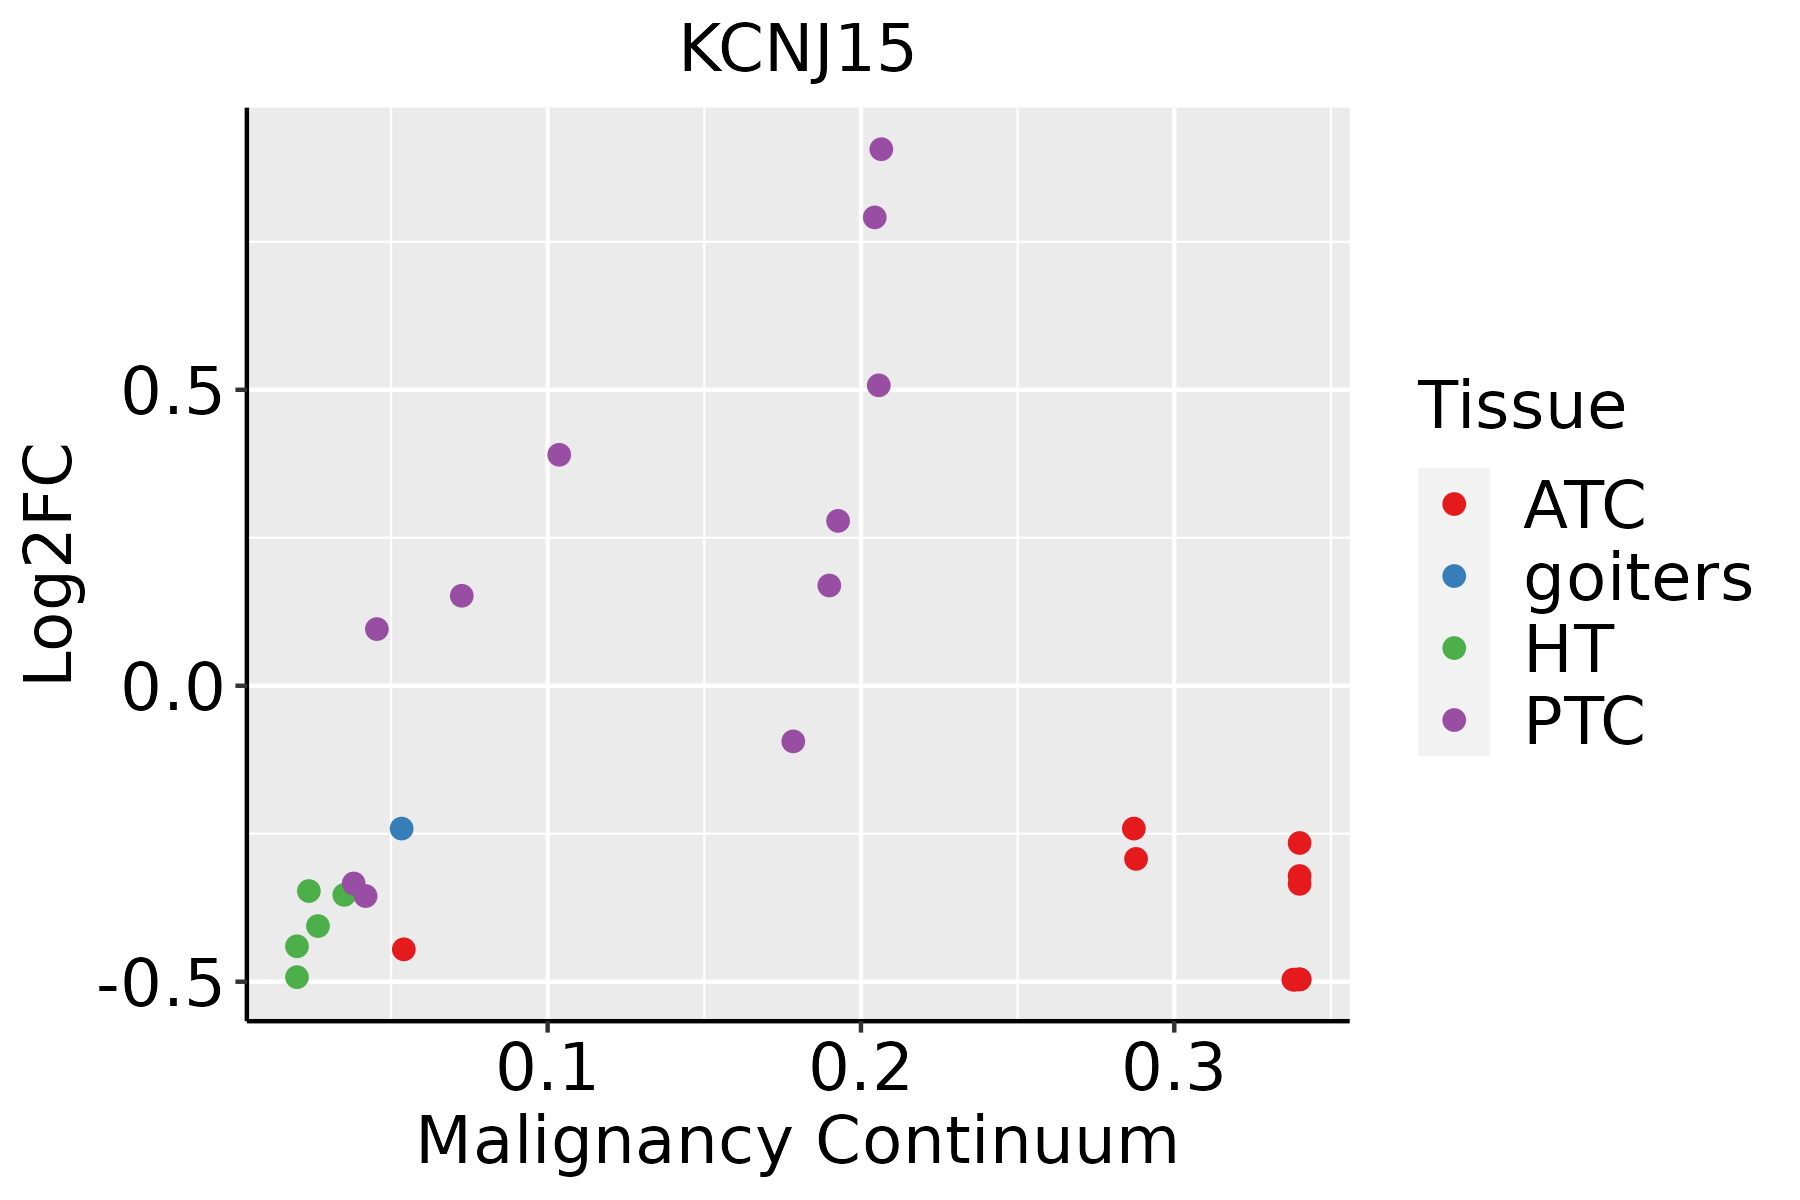 | ATC: Anaplastic thyroid cancer |
| HT: Hashimoto's thyroiditis | ||
| PTC: Papillary thyroid cancer |
| ∗log2FC in expression of this searched gene in stem-like cells from each diseased tissue sample relative to stem-like cells in normal samples in each tissue plotted against the malignancy continuum. Samples are colored based on if they are from different disease stage. |
Top |
Malignant transformation related pathway analysis |
| Find out the enriched GO biological processes and KEGG pathways involved in transition from healthy to precancer to cancer |
| Tissue | Disease Stage | Enriched GO biological Processes |
| Colorectum | AD |  |
| Colorectum | SER |  |
| Colorectum | MSS |  |
| Colorectum | MSI-H |  |
| Colorectum | FAP |  |
| ∗Top 15 enriched GO BP terms are showed in the bar plot of each disease state in each tissue. Each row represents a significant GO biological process which is colored according to the -log10(p.adjust). |
| Page: 1 2 3 4 5 6 7 8 9 |
| GO ID | Tissue | Disease Stage | Description | Gene Ratio | Bg Ratio | pvalue | p.adjust | Count |
| Page: 1 |
| Pathway ID | Tissue | Disease Stage | Description | Gene Ratio | Bg Ratio | pvalue | p.adjust | qvalue | Count |
| hsa0497112 | Lung | IAC | Gastric acid secretion | 17/1053 | 76/8465 | 1.08e-02 | 3.93e-02 | 2.61e-02 | 17 |
| hsa0497113 | Lung | IAC | Gastric acid secretion | 17/1053 | 76/8465 | 1.08e-02 | 3.93e-02 | 2.61e-02 | 17 |
| hsa0497121 | Lung | AIS | Gastric acid secretion | 16/961 | 76/8465 | 1.02e-02 | 4.28e-02 | 2.74e-02 | 16 |
| hsa0497131 | Lung | AIS | Gastric acid secretion | 16/961 | 76/8465 | 1.02e-02 | 4.28e-02 | 2.74e-02 | 16 |
| Page: 1 |
Top |
Cell-cell communication analysis |
| Identification of potential cell-cell interactions between two cell types and their ligand-receptor pairs for different disease states |
| Ligand | Receptor | LRpair | Pathway | Tissue | Disease Stage |
| Page: 1 |
Top |
Single-cell gene regulatory network inference analysis |
| Find out the significant the regulons (TFs) and the target genes of each regulon across cell types for different disease states |
| TF | Cell Type | Tissue | Disease Stage | Target Gene | RSS | Regulon Activity |
| ∗The dot plots of a searched regulon are shown for all cell subpopulations in each disease state of each tissue based on the regulon specific score inferred using pySCENIC and by calculating the average expression. |
| Page: 1 |
Top |
Somatic mutation of malignant transformation related genes |
| Annotation of somatic variants for genes involved in malignant transformation |
| Hugo Symbol | Variant Class | Variant Classification | dbSNP RS | HGVSc | HGVSp | HGVSp Short | SWISSPROT | BIOTYPE | SIFT | PolyPhen | Tumor Sample Barcode | Tissue | Histology | Sex | Age | Stage | Therapy Types | Drugs | Outcome |
| KCNJ15 | SNV | Missense_Mutation | c.465N>T | p.Leu155Phe | p.L155F | Q99712 | protein_coding | tolerated(0.17) | probably_damaging(0.951) | TCGA-A2-A0D0-01 | Breast | breast invasive carcinoma | Female | <65 | I/II | Chemotherapy | cytoxan | SD | |
| KCNJ15 | SNV | Missense_Mutation | rs757894746 | c.82N>T | p.Arg28Cys | p.R28C | Q99712 | protein_coding | deleterious(0) | probably_damaging(0.987) | TCGA-A8-A08G-01 | Breast | breast invasive carcinoma | Female | <65 | I/II | Chemotherapy | 5-fluorouracil | CR |
| KCNJ15 | SNV | Missense_Mutation | novel | c.471N>T | p.Glu157Asp | p.E157D | Q99712 | protein_coding | tolerated(0.27) | probably_damaging(0.999) | TCGA-AN-A046-01 | Breast | breast invasive carcinoma | Female | >=65 | I/II | Unknown | Unknown | SD |
| KCNJ15 | SNV | Missense_Mutation | rs765815153 | c.398N>A | p.Arg133His | p.R133H | Q99712 | protein_coding | deleterious(0) | probably_damaging(1) | TCGA-B6-A0WV-01 | Breast | breast invasive carcinoma | Female | >=65 | I/II | Unknown | Unknown | SD |
| KCNJ15 | SNV | Missense_Mutation | c.544N>A | p.His182Asn | p.H182N | Q99712 | protein_coding | tolerated(0.21) | benign(0.003) | TCGA-D8-A1XL-01 | Breast | breast invasive carcinoma | Female | <65 | I/II | Chemotherapy | doxorubicine+cyclophosphamide+tamoxifen | SD | |
| KCNJ15 | SNV | Missense_Mutation | novel | c.509N>C | p.Arg170Thr | p.R170T | Q99712 | protein_coding | tolerated(0.06) | probably_damaging(0.984) | TCGA-D8-A27V-01 | Breast | breast invasive carcinoma | Female | <65 | I/II | Hormone Therapy | tamoxiphen | SD |
| KCNJ15 | insertion | Frame_Shift_Ins | novel | c.338_339insCAGAGCCTGGCAATGGATGCCATTCACA | p.Leu114ArgfsTer53 | p.L114Rfs*53 | Q99712 | protein_coding | TCGA-A8-A06Z-01 | Breast | breast invasive carcinoma | Female | >=65 | I/II | Unknown | Unknown | SD | ||
| KCNJ15 | SNV | Missense_Mutation | rs772620107 | c.350N>T | p.Ala117Val | p.A117V | Q99712 | protein_coding | deleterious(0) | probably_damaging(1) | TCGA-VS-A94Z-01 | Cervix | cervical & endocervical cancer | Female | <65 | I/II | Chemotherapy | cisplatin | CR |
| KCNJ15 | SNV | Missense_Mutation | rs765815153 | c.398N>A | p.Arg133His | p.R133H | Q99712 | protein_coding | deleterious(0) | probably_damaging(1) | TCGA-5M-AAT4-01 | Colorectum | colon adenocarcinoma | Male | >=65 | III/IV | Unknown | Unknown | PD |
| KCNJ15 | SNV | Missense_Mutation | c.976N>T | p.Asp326Tyr | p.D326Y | Q99712 | protein_coding | deleterious(0) | probably_damaging(0.998) | TCGA-AA-3941-01 | Colorectum | colon adenocarcinoma | Female | >=65 | I/II | Unknown | Unknown | SD |
| Page: 1 2 3 4 5 |
Top |
Related drugs of malignant transformation related genes |
| Identification of chemicals and drugs interact with genes involved in malignant transfromation |
| (DGIdb 4.0) |
| Entrez ID | Symbol | Category | Interaction Types | Drug Claim Name | Drug Name | PMIDs |
| Page: 1 |

Copyright 2023-Present -The University of Texas Health Science Center at Houston |