
|
|||||
|
 | |
| |
| |
| |
| |
| |
|
Gene: KCNF1 |
Gene summary for KCNF1 |
| Gene information | Species | Human | Gene symbol | KCNF1 | Gene ID | 3754 |
| Gene name | potassium voltage-gated channel modifier subfamily F member 1 | |
| Gene Alias | IK8 | |
| Cytomap | 2p25.1 | |
| Gene Type | protein-coding | GO ID | GO:0006810 | UniProtAcc | Q9H3M0 |
Top |
Malignant transformation analysis |
| Identification of the aberrant gene expression in precancerous and cancerous lesions by comparing the gene expression of stem-like cells in diseased tissues with normal stem cells |
| Entrez ID | Symbol | Replicates | Species | Organ | Tissue | Adj P-value | Log2FC | Malignancy |
| 3754 | KCNF1 | GSM4909317 | Human | Breast | IDC | 2.35e-11 | 3.84e-01 | 0.1355 |
| 3754 | KCNF1 | GSM4909318 | Human | Breast | IDC | 1.98e-06 | 5.71e-01 | 0.2031 |
| Page: 1 |
| Tissue | Expression Dynamics | Abbreviation |
| Breast | 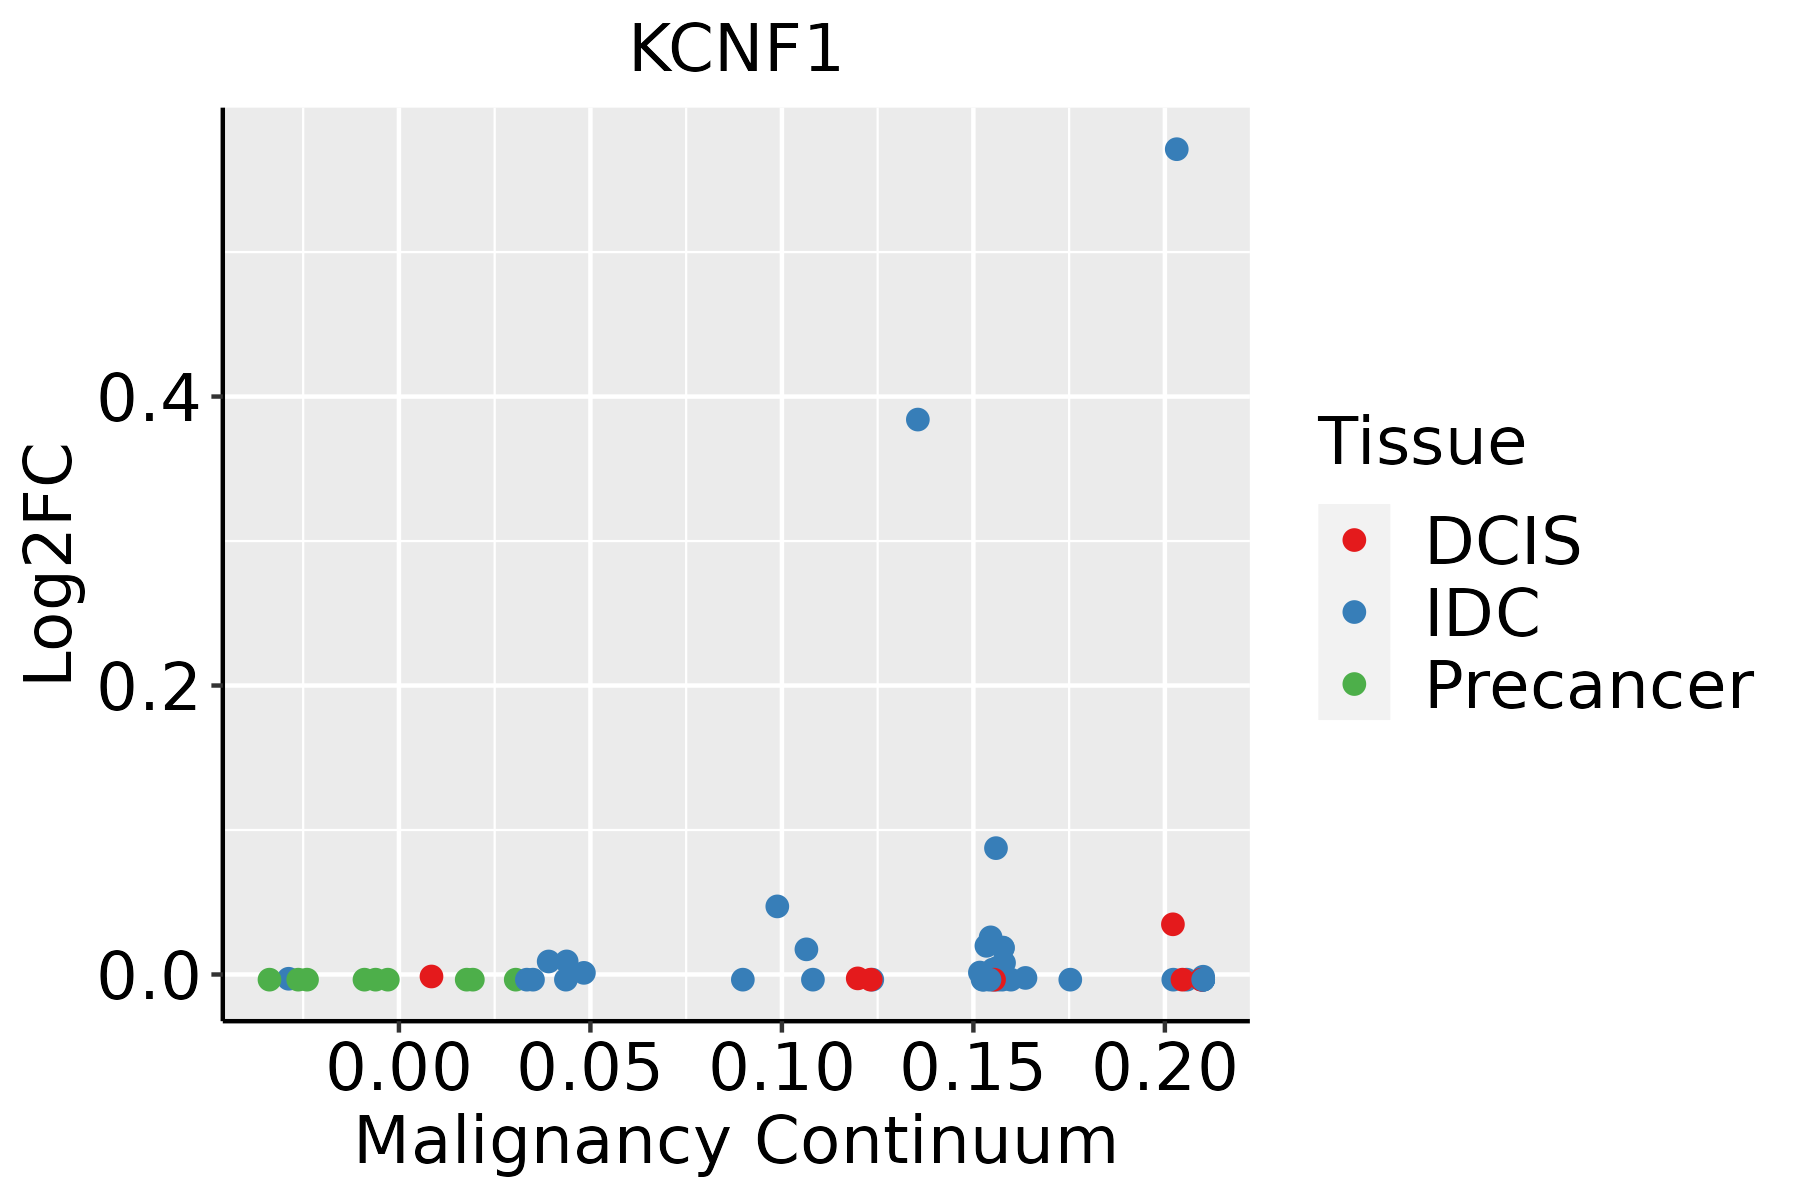 | IDC: Invasive ductal carcinoma |
| DCIS: Ductal carcinoma in situ | ||
| Precancer(BRCA1-mut): Precancerous lesion from BRCA1 mutation carriers |
| ∗log2FC in expression of this searched gene in stem-like cells from each diseased tissue sample relative to stem-like cells in normal samples in each tissue plotted against the malignancy continuum. Samples are colored based on if they are from different disease stage. |
Top |
Malignant transformation related pathway analysis |
| Find out the enriched GO biological processes and KEGG pathways involved in transition from healthy to precancer to cancer |
| Tissue | Disease Stage | Enriched GO biological Processes |
| Colorectum | AD |  |
| Colorectum | SER |  |
| Colorectum | MSS |  |
| Colorectum | MSI-H |  |
| Colorectum | FAP |  |
| ∗Top 15 enriched GO BP terms are showed in the bar plot of each disease state in each tissue. Each row represents a significant GO biological process which is colored according to the -log10(p.adjust). |
| Page: 1 2 3 4 5 6 7 8 9 |
| GO ID | Tissue | Disease Stage | Description | Gene Ratio | Bg Ratio | pvalue | p.adjust | Count |
| Page: 1 |
| Pathway ID | Tissue | Disease Stage | Description | Gene Ratio | Bg Ratio | pvalue | p.adjust | qvalue | Count |
| Page: 1 |
Top |
Cell-cell communication analysis |
| Identification of potential cell-cell interactions between two cell types and their ligand-receptor pairs for different disease states |
| Ligand | Receptor | LRpair | Pathway | Tissue | Disease Stage |
| Page: 1 |
Top |
Single-cell gene regulatory network inference analysis |
| Find out the significant the regulons (TFs) and the target genes of each regulon across cell types for different disease states |
| TF | Cell Type | Tissue | Disease Stage | Target Gene | RSS | Regulon Activity |
| ∗The dot plots of a searched regulon are shown for all cell subpopulations in each disease state of each tissue based on the regulon specific score inferred using pySCENIC and by calculating the average expression. |
| Page: 1 |
Top |
Somatic mutation of malignant transformation related genes |
| Annotation of somatic variants for genes involved in malignant transformation |
| Hugo Symbol | Variant Class | Variant Classification | dbSNP RS | HGVSc | HGVSp | HGVSp Short | SWISSPROT | BIOTYPE | SIFT | PolyPhen | Tumor Sample Barcode | Tissue | Histology | Sex | Age | Stage | Therapy Types | Drugs | Outcome |
| KCNF1 | SNV | Missense_Mutation | novel | c.488N>A | p.Arg163His | p.R163H | Q9H3M0 | protein_coding | deleterious(0.05) | benign(0.154) | TCGA-AC-A3OD-01 | Breast | breast invasive carcinoma | Female | >=65 | I/II | Unknown | Unknown | SD |
| KCNF1 | SNV | Missense_Mutation | novel | c.1111N>A | p.Val371Ile | p.V371I | Q9H3M0 | protein_coding | deleterious(0) | probably_damaging(0.995) | TCGA-AC-A8OS-01 | Breast | breast invasive carcinoma | Female | >=65 | I/II | Unknown | Unknown | SD |
| KCNF1 | SNV | Missense_Mutation | c.1315N>A | p.Glu439Lys | p.E439K | Q9H3M0 | protein_coding | tolerated(0.68) | benign(0) | TCGA-AN-A046-01 | Breast | breast invasive carcinoma | Female | >=65 | I/II | Unknown | Unknown | SD | |
| KCNF1 | SNV | Missense_Mutation | c.424N>A | p.Ala142Thr | p.A142T | Q9H3M0 | protein_coding | tolerated(0.5) | possibly_damaging(0.875) | TCGA-AO-A128-01 | Breast | breast invasive carcinoma | Female | <65 | I/II | Chemotherapy | doxorubicin | SD | |
| KCNF1 | SNV | Missense_Mutation | novel | c.253N>A | p.Ala85Thr | p.A85T | Q9H3M0 | protein_coding | tolerated(0.1) | possibly_damaging(0.506) | TCGA-C8-A12U-01 | Breast | breast invasive carcinoma | Female | <65 | I/II | Unknown | Unknown | SD |
| KCNF1 | deletion | Frame_Shift_Del | novel | c.942delC | p.Tyr315MetfsTer54 | p.Y315Mfs*54 | Q9H3M0 | protein_coding | TCGA-D8-A27V-01 | Breast | breast invasive carcinoma | Female | <65 | I/II | Hormone Therapy | tamoxiphen | SD | ||
| KCNF1 | SNV | Missense_Mutation | rs773536391 | c.472N>A | p.Glu158Lys | p.E158K | Q9H3M0 | protein_coding | tolerated(0.6) | benign(0.052) | TCGA-JX-A3Q0-01 | Cervix | cervical & endocervical cancer | Female | <65 | III/IV | Unknown | Unknown | SD |
| KCNF1 | SNV | Missense_Mutation | novel | c.914N>A | p.Arg305His | p.R305H | Q9H3M0 | protein_coding | deleterious(0) | probably_damaging(0.928) | TCGA-MA-AA42-01 | Cervix | cervical & endocervical cancer | Female | >=65 | I/II | Unknown | Unknown | SD |
| KCNF1 | insertion | Frame_Shift_Ins | novel | c.695_696insC | p.Trp232CysfsTer124 | p.W232Cfs*124 | Q9H3M0 | protein_coding | TCGA-DS-A1OC-01 | Cervix | cervical & endocervical cancer | Female | <65 | I/II | Chemotherapy | gemcitabine | SD | ||
| KCNF1 | SNV | Missense_Mutation | c.1225N>G | p.Phe409Val | p.F409V | Q9H3M0 | protein_coding | deleterious(0) | probably_damaging(0.987) | TCGA-A6-2686-01 | Colorectum | colon adenocarcinoma | Female | >=65 | I/II | Unknown | Unknown | SD |
| Page: 1 2 3 4 5 6 7 8 9 |
Top |
Related drugs of malignant transformation related genes |
| Identification of chemicals and drugs interact with genes involved in malignant transfromation |
| (DGIdb 4.0) |
| Entrez ID | Symbol | Category | Interaction Types | Drug Claim Name | Drug Name | PMIDs |
| 3754 | KCNF1 | ION CHANNEL, DRUGGABLE GENOME | blocker | CHEMBL2107762 | NERISPIRDINE | |
| 3754 | KCNF1 | ION CHANNEL, DRUGGABLE GENOME | blocker | CHEMBL1200728 | GUANIDINE HYDROCHLORIDE | |
| 3754 | KCNF1 | ION CHANNEL, DRUGGABLE GENOME | blocker | CHEMBL284348 | DALFAMPRIDINE | |
| 3754 | KCNF1 | ION CHANNEL, DRUGGABLE GENOME | blocker | CHEMBL113461 | TEDISAMIL |
| Page: 1 |

Copyright 2023-Present -The University of Texas Health Science Center at Houston |