
|
|||||
|
 | |
| |
| |
| |
| |
| |
|
Gene: KCNE4 |
Gene summary for KCNE4 |
| Gene information | Species | Human | Gene symbol | KCNE4 | Gene ID | 23704 |
| Gene name | potassium voltage-gated channel subfamily E regulatory subunit 4 | |
| Gene Alias | MIRP3 | |
| Cytomap | 2q36.1 | |
| Gene Type | protein-coding | GO ID | GO:0001508 | UniProtAcc | A5H1P5 |
Top |
Malignant transformation analysis |
| Identification of the aberrant gene expression in precancerous and cancerous lesions by comparing the gene expression of stem-like cells in diseased tissues with normal stem cells |
| Entrez ID | Symbol | Replicates | Species | Organ | Tissue | Adj P-value | Log2FC | Malignancy |
| 23704 | KCNE4 | GSM4909296 | Human | Breast | IDC | 3.38e-03 | 2.02e-01 | 0.1524 |
| 23704 | KCNE4 | GSM4909301 | Human | Breast | IDC | 6.83e-13 | 4.03e-01 | 0.1577 |
| 23704 | KCNE4 | GSM4909302 | Human | Breast | IDC | 2.88e-05 | 2.66e-01 | 0.1545 |
| 23704 | KCNE4 | GSM4909306 | Human | Breast | IDC | 8.57e-27 | 5.54e-01 | 0.1564 |
| 23704 | KCNE4 | GSM4909307 | Human | Breast | IDC | 1.32e-80 | 1.31e+00 | 0.1569 |
| 23704 | KCNE4 | GSM4909308 | Human | Breast | IDC | 7.91e-127 | 1.62e+00 | 0.158 |
| 23704 | KCNE4 | NCCBC2 | Human | Breast | DCIS | 9.15e-04 | 5.61e-01 | 0.1554 |
| 23704 | KCNE4 | NCCBC3 | Human | Breast | DCIS | 1.61e-03 | 2.37e-01 | 0.1198 |
| 23704 | KCNE4 | P3 | Human | Breast | IDC | 1.42e-12 | 8.68e-01 | 0.1542 |
| 23704 | KCNE4 | Pt13.b | Human | Liver | HCC | 3.86e-13 | 3.78e-01 | 0.0251 |
| 23704 | KCNE4 | S014 | Human | Liver | HCC | 7.28e-08 | 5.99e-01 | 0.2254 |
| 23704 | KCNE4 | S016 | Human | Liver | HCC | 1.45e-16 | 8.69e-01 | 0.2243 |
| 23704 | KCNE4 | ATC12 | Human | Thyroid | ATC | 2.61e-07 | 2.02e-01 | 0.34 |
| 23704 | KCNE4 | ATC13 | Human | Thyroid | ATC | 2.41e-48 | 1.22e+00 | 0.34 |
| 23704 | KCNE4 | ATC2 | Human | Thyroid | ATC | 2.07e-11 | 1.40e+00 | 0.34 |
| 23704 | KCNE4 | ATC4 | Human | Thyroid | ATC | 2.33e-08 | 2.80e-01 | 0.34 |
| 23704 | KCNE4 | ATC5 | Human | Thyroid | ATC | 9.36e-50 | 1.35e+00 | 0.34 |
| Page: 1 |
| Tissue | Expression Dynamics | Abbreviation |
| Breast |  | IDC: Invasive ductal carcinoma |
| DCIS: Ductal carcinoma in situ | ||
| Precancer(BRCA1-mut): Precancerous lesion from BRCA1 mutation carriers | ||
| Liver | 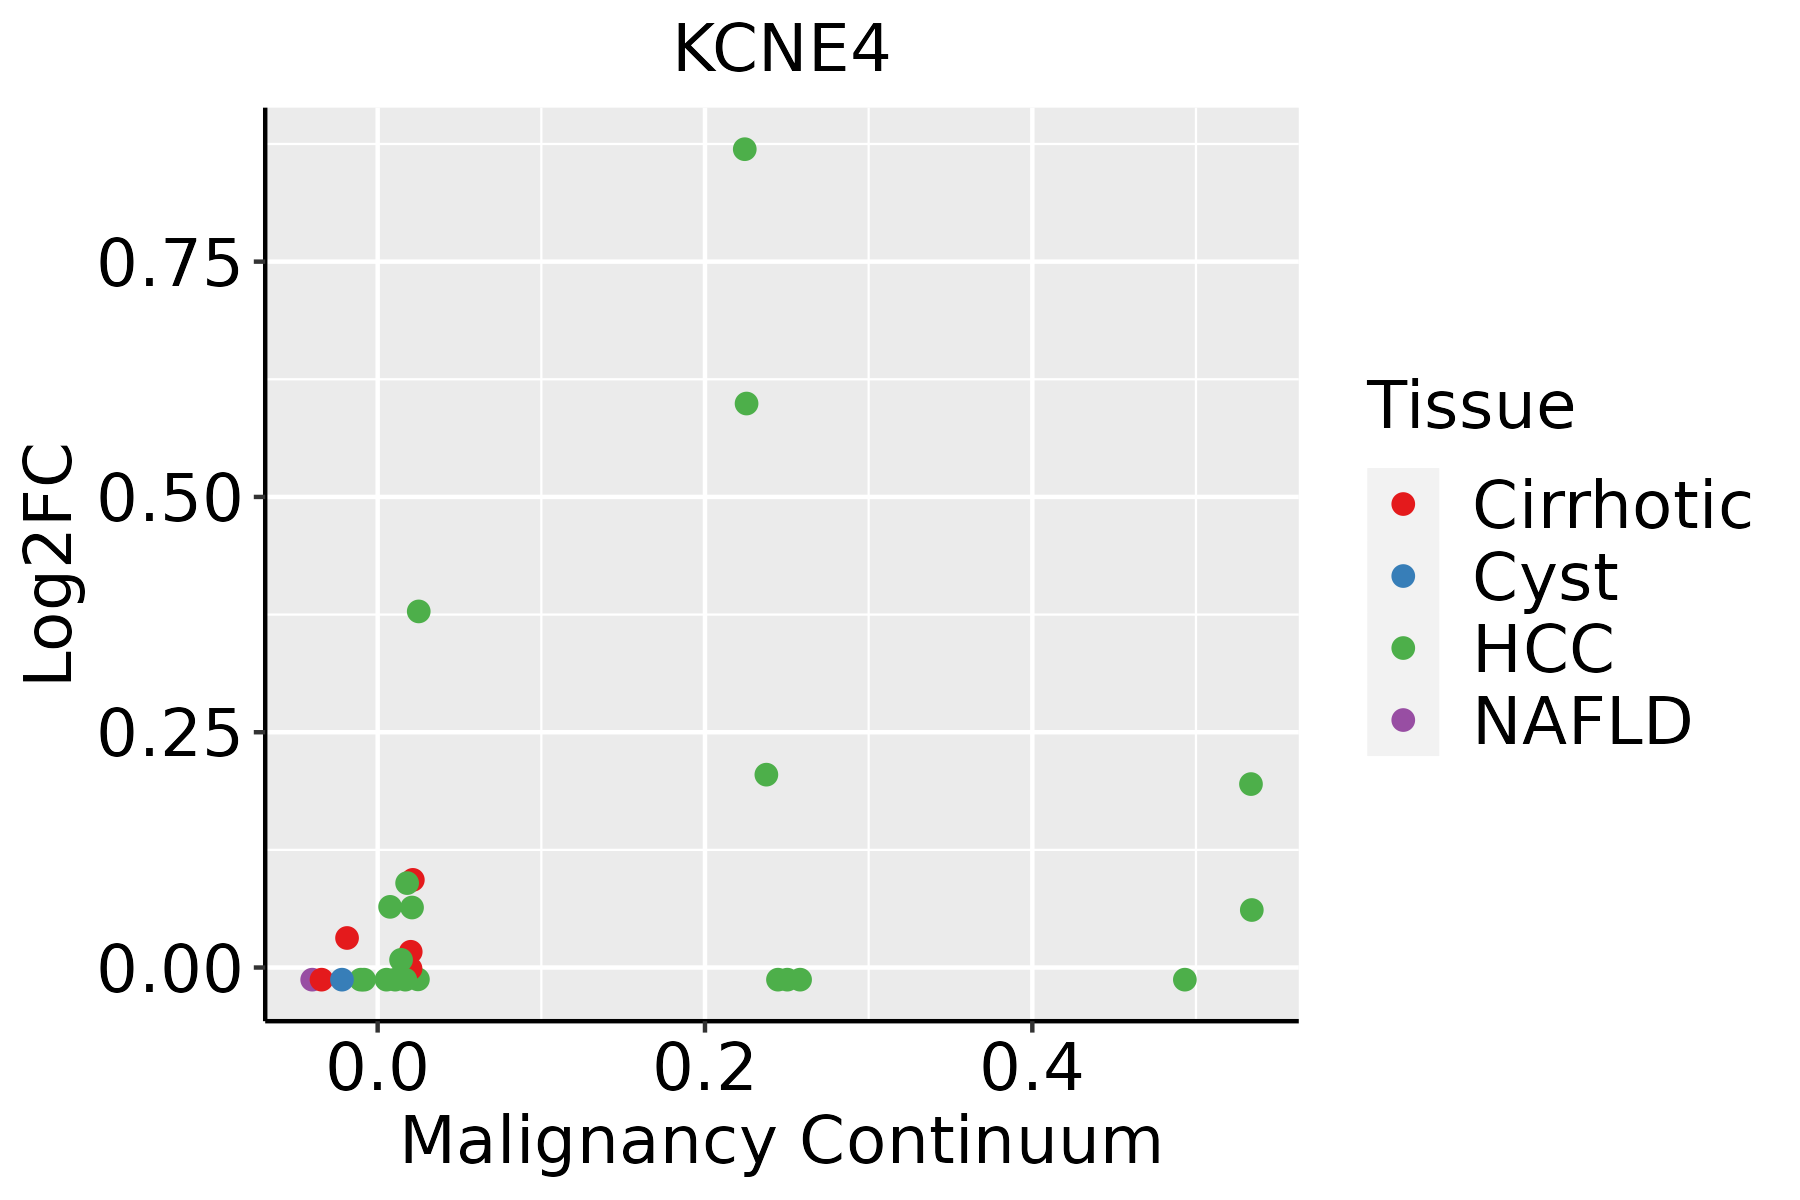 | HCC: Hepatocellular carcinoma |
| NAFLD: Non-alcoholic fatty liver disease | ||
| Thyroid | 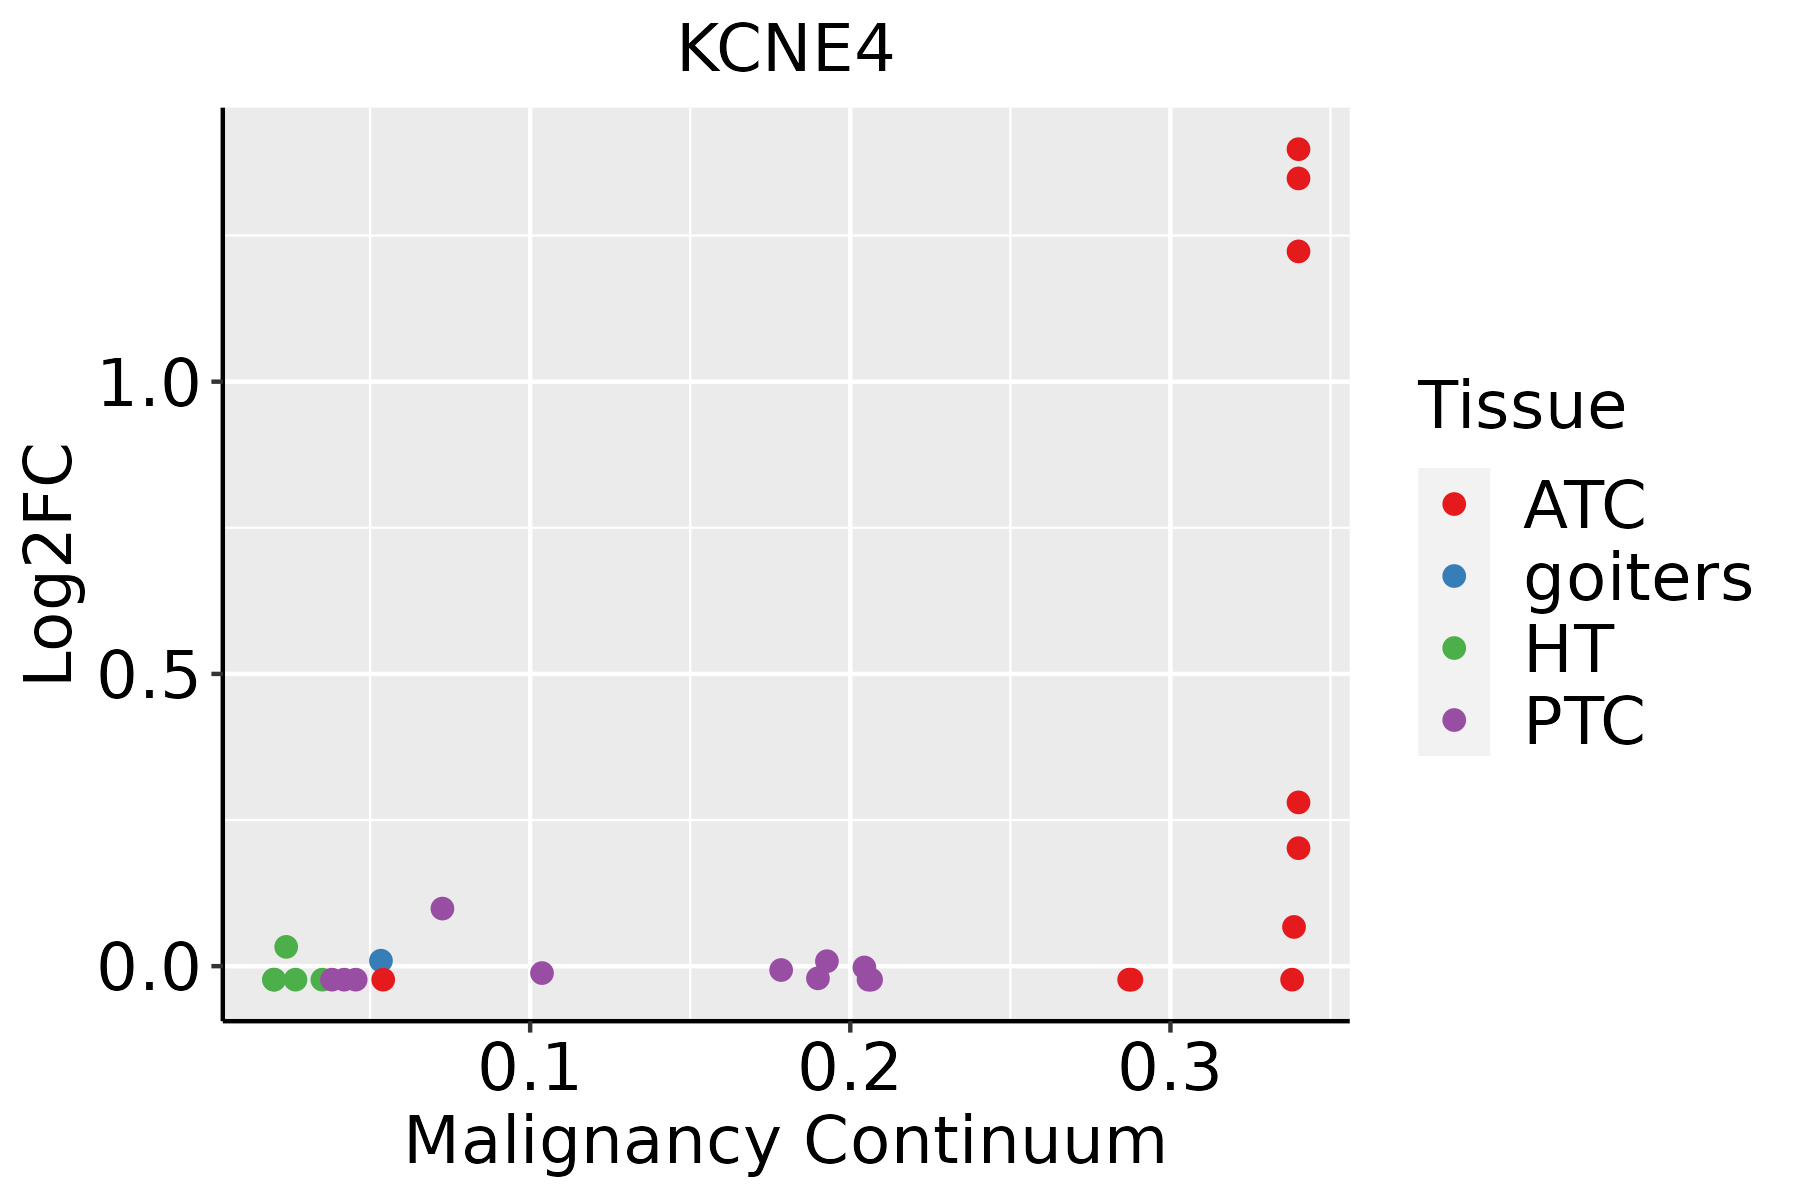 | ATC: Anaplastic thyroid cancer |
| HT: Hashimoto's thyroiditis | ||
| PTC: Papillary thyroid cancer |
| ∗log2FC in expression of this searched gene in stem-like cells from each diseased tissue sample relative to stem-like cells in normal samples in each tissue plotted against the malignancy continuum. Samples are colored based on if they are from different disease stage. |
Top |
Malignant transformation related pathway analysis |
| Find out the enriched GO biological processes and KEGG pathways involved in transition from healthy to precancer to cancer |
| Tissue | Disease Stage | Enriched GO biological Processes |
| Colorectum | AD |  |
| Colorectum | SER |  |
| Colorectum | MSS |  |
| Colorectum | MSI-H |  |
| Colorectum | FAP |  |
| ∗Top 15 enriched GO BP terms are showed in the bar plot of each disease state in each tissue. Each row represents a significant GO biological process which is colored according to the -log10(p.adjust). |
| Page: 1 2 3 4 5 6 7 8 9 |
| GO ID | Tissue | Disease Stage | Description | Gene Ratio | Bg Ratio | pvalue | p.adjust | Count |
| GO:001095913 | Breast | IDC | regulation of metal ion transport | 52/1434 | 406/18723 | 1.76e-04 | 2.97e-03 | 52 |
| GO:002289812 | Breast | IDC | regulation of transmembrane transporter activity | 36/1434 | 278/18723 | 1.35e-03 | 1.40e-02 | 36 |
| GO:00613373 | Breast | IDC | cardiac conduction | 16/1434 | 98/18723 | 3.06e-03 | 2.60e-02 | 16 |
| GO:00423912 | Breast | IDC | regulation of membrane potential | 49/1434 | 434/18723 | 4.04e-03 | 3.25e-02 | 49 |
| GO:00324125 | Breast | IDC | regulation of ion transmembrane transporter activity | 33/1434 | 267/18723 | 4.38e-03 | 3.40e-02 | 33 |
| GO:00324096 | Breast | IDC | regulation of transporter activity | 37/1434 | 310/18723 | 4.77e-03 | 3.66e-02 | 37 |
| GO:00860015 | Breast | IDC | cardiac muscle cell action potential | 13/1434 | 76/18723 | 4.81e-03 | 3.67e-02 | 13 |
| GO:00020271 | Breast | IDC | regulation of heart rate | 16/1434 | 103/18723 | 5.06e-03 | 3.79e-02 | 16 |
| GO:00030125 | Breast | IDC | muscle system process | 50/1434 | 452/18723 | 5.52e-03 | 4.05e-02 | 50 |
| GO:00015082 | Breast | IDC | action potential | 19/1434 | 134/18723 | 6.62e-03 | 4.62e-02 | 19 |
| GO:0070839 | Breast | IDC | metal ion export | 10/1434 | 54/18723 | 7.22e-03 | 4.96e-02 | 10 |
| GO:001095921 | Breast | DCIS | regulation of metal ion transport | 50/1390 | 406/18723 | 2.86e-04 | 4.22e-03 | 50 |
| GO:002289822 | Breast | DCIS | regulation of transmembrane transporter activity | 35/1390 | 278/18723 | 1.50e-03 | 1.51e-02 | 35 |
| GO:000301212 | Breast | DCIS | muscle system process | 50/1390 | 452/18723 | 3.02e-03 | 2.57e-02 | 50 |
| GO:003241212 | Breast | DCIS | regulation of ion transmembrane transporter activity | 32/1390 | 267/18723 | 4.97e-03 | 3.72e-02 | 32 |
| GO:003240912 | Breast | DCIS | regulation of transporter activity | 36/1390 | 310/18723 | 5.05e-03 | 3.74e-02 | 36 |
| GO:006133711 | Breast | DCIS | cardiac conduction | 15/1390 | 98/18723 | 5.65e-03 | 4.09e-02 | 15 |
| GO:00708391 | Breast | DCIS | metal ion export | 10/1390 | 54/18723 | 5.83e-03 | 4.18e-02 | 10 |
| GO:00423911 | Breast | DCIS | regulation of membrane potential | 47/1390 | 434/18723 | 5.87e-03 | 4.20e-02 | 47 |
| GO:005105114 | Thyroid | ATC | negative regulation of transport | 183/6293 | 470/18723 | 8.12e-03 | 3.13e-02 | 183 |
| Page: 1 |
| Pathway ID | Tissue | Disease Stage | Description | Gene Ratio | Bg Ratio | pvalue | p.adjust | qvalue | Count |
| Page: 1 |
Top |
Cell-cell communication analysis |
| Identification of potential cell-cell interactions between two cell types and their ligand-receptor pairs for different disease states |
| Ligand | Receptor | LRpair | Pathway | Tissue | Disease Stage |
| Page: 1 |
Top |
Single-cell gene regulatory network inference analysis |
| Find out the significant the regulons (TFs) and the target genes of each regulon across cell types for different disease states |
| TF | Cell Type | Tissue | Disease Stage | Target Gene | RSS | Regulon Activity |
| ∗The dot plots of a searched regulon are shown for all cell subpopulations in each disease state of each tissue based on the regulon specific score inferred using pySCENIC and by calculating the average expression. |
| Page: 1 |
Top |
Somatic mutation of malignant transformation related genes |
| Annotation of somatic variants for genes involved in malignant transformation |
| Hugo Symbol | Variant Class | Variant Classification | dbSNP RS | HGVSc | HGVSp | HGVSp Short | SWISSPROT | BIOTYPE | SIFT | PolyPhen | Tumor Sample Barcode | Tissue | Histology | Sex | Age | Stage | Therapy Types | Drugs | Outcome |
| KCNE4 | SNV | Missense_Mutation | c.574N>A | p.Glu192Lys | p.E192K | Q8WWG9 | protein_coding | deleterious(0) | probably_damaging(0.999) | TCGA-D8-A1J9-01 | Breast | breast invasive carcinoma | Female | <65 | I/II | Unknown | Unknown | SD | |
| KCNE4 | insertion | Frame_Shift_Ins | novel | c.563_564insTTGGGACAAACTGT | p.Ile189TrpfsTer54 | p.I189Wfs*54 | Q8WWG9 | protein_coding | TCGA-A8-A0A1-01 | Breast | breast invasive carcinoma | Female | >=65 | I/II | Hormone Therapy | tamoxiphen | SD | ||
| KCNE4 | SNV | Missense_Mutation | c.265N>C | p.Tyr89His | p.Y89H | Q8WWG9 | protein_coding | deleterious(0) | probably_damaging(0.999) | TCGA-CM-5861-01 | Colorectum | colon adenocarcinoma | Female | <65 | I/II | Unknown | Unknown | PD | |
| KCNE4 | SNV | Missense_Mutation | c.425N>T | p.Ser142Leu | p.S142L | Q8WWG9 | protein_coding | deleterious(0.01) | benign(0.331) | TCGA-QG-A5Z2-01 | Colorectum | colon adenocarcinoma | Male | <65 | I/II | Unknown | Unknown | SD | |
| KCNE4 | SNV | Missense_Mutation | c.548C>T | p.Pro183Leu | p.P183L | Q8WWG9 | protein_coding | deleterious(0) | probably_damaging(1) | TCGA-AG-4007-01 | Colorectum | rectum adenocarcinoma | Male | >=65 | III/IV | Unknown | Unknown | SD | |
| KCNE4 | SNV | Missense_Mutation | c.526N>A | p.Val176Met | p.V176M | Q8WWG9 | protein_coding | deleterious(0) | probably_damaging(0.953) | TCGA-A5-A0G2-01 | Endometrium | uterine corpus endometrioid carcinoma | Female | <65 | III/IV | Unknown | Unknown | SD | |
| KCNE4 | SNV | Missense_Mutation | novel | c.444N>T | p.Gln148His | p.Q148H | Q8WWG9 | protein_coding | deleterious(0.02) | benign(0.056) | TCGA-AP-A051-01 | Endometrium | uterine corpus endometrioid carcinoma | Female | >=65 | I/II | Unknown | Unknown | SD |
| KCNE4 | SNV | Missense_Mutation | c.199G>A | p.Ala67Thr | p.A67T | Q8WWG9 | protein_coding | tolerated(0.22) | benign(0.034) | TCGA-AP-A1E1-01 | Endometrium | uterine corpus endometrioid carcinoma | Female | >=65 | I/II | Unknown | Unknown | SD | |
| KCNE4 | SNV | Missense_Mutation | novel | c.182N>T | p.Thr61Met | p.T61M | Q8WWG9 | protein_coding | deleterious(0) | benign(0.424) | TCGA-AX-A06F-01 | Endometrium | uterine corpus endometrioid carcinoma | Female | <65 | III/IV | Chemotherapy | carboplatin | SD |
| KCNE4 | SNV | Missense_Mutation | novel | c.578G>A | p.Gly193Glu | p.G193E | Q8WWG9 | protein_coding | tolerated(0.37) | possibly_damaging(0.905) | TCGA-BG-A0VW-01 | Endometrium | uterine corpus endometrioid carcinoma | Female | >=65 | I/II | Unknown | Unknown | SD |
| Page: 1 2 3 |
Top |
Related drugs of malignant transformation related genes |
| Identification of chemicals and drugs interact with genes involved in malignant transfromation |
| (DGIdb 4.0) |
| Entrez ID | Symbol | Category | Interaction Types | Drug Claim Name | Drug Name | PMIDs |
| Page: 1 |

Copyright 2023-Present -The University of Texas Health Science Center at Houston |