
|
|||||
|
 | |
| |
| |
| |
| |
| |
|
Gene: KCNE3 |
Gene summary for KCNE3 |
| Gene information | Species | Human | Gene symbol | KCNE3 | Gene ID | 10008 |
| Gene name | potassium voltage-gated channel subfamily E regulatory subunit 3 | |
| Gene Alias | BRGDA6 | |
| Cytomap | 11q13.4 | |
| Gene Type | protein-coding | GO ID | GO:0001508 | UniProtAcc | Q6IAE6 |
Top |
Malignant transformation analysis |
| Identification of the aberrant gene expression in precancerous and cancerous lesions by comparing the gene expression of stem-like cells in diseased tissues with normal stem cells |
| Entrez ID | Symbol | Replicates | Species | Organ | Tissue | Adj P-value | Log2FC | Malignancy |
| 10008 | KCNE3 | LZE4T | Human | Esophagus | ESCC | 8.19e-03 | 1.73e-01 | 0.0811 |
| 10008 | KCNE3 | LZE7T | Human | Esophagus | ESCC | 2.93e-08 | 4.67e-01 | 0.0667 |
| 10008 | KCNE3 | LZE24T | Human | Esophagus | ESCC | 1.62e-07 | 2.03e-01 | 0.0596 |
| 10008 | KCNE3 | P2T-E | Human | Esophagus | ESCC | 8.84e-05 | 1.56e-01 | 0.1177 |
| 10008 | KCNE3 | P4T-E | Human | Esophagus | ESCC | 4.71e-29 | 9.01e-01 | 0.1323 |
| 10008 | KCNE3 | P8T-E | Human | Esophagus | ESCC | 1.11e-16 | 4.67e-01 | 0.0889 |
| 10008 | KCNE3 | P9T-E | Human | Esophagus | ESCC | 1.44e-12 | 4.26e-01 | 0.1131 |
| 10008 | KCNE3 | P15T-E | Human | Esophagus | ESCC | 4.00e-03 | 1.42e-01 | 0.1149 |
| 10008 | KCNE3 | P23T-E | Human | Esophagus | ESCC | 2.11e-33 | 1.10e+00 | 0.108 |
| 10008 | KCNE3 | P26T-E | Human | Esophagus | ESCC | 4.52e-02 | 1.38e-01 | 0.1276 |
| 10008 | KCNE3 | P27T-E | Human | Esophagus | ESCC | 4.82e-16 | 3.49e-01 | 0.1055 |
| 10008 | KCNE3 | P28T-E | Human | Esophagus | ESCC | 1.75e-25 | 6.97e-01 | 0.1149 |
| 10008 | KCNE3 | P30T-E | Human | Esophagus | ESCC | 3.70e-18 | 1.04e+00 | 0.137 |
| 10008 | KCNE3 | P39T-E | Human | Esophagus | ESCC | 4.69e-12 | 3.25e-01 | 0.0894 |
| 10008 | KCNE3 | P47T-E | Human | Esophagus | ESCC | 2.36e-05 | 3.08e-01 | 0.1067 |
| 10008 | KCNE3 | P48T-E | Human | Esophagus | ESCC | 9.01e-18 | 5.17e-01 | 0.0959 |
| 10008 | KCNE3 | P57T-E | Human | Esophagus | ESCC | 6.96e-06 | 1.91e-01 | 0.0926 |
| 10008 | KCNE3 | P62T-E | Human | Esophagus | ESCC | 1.02e-04 | 2.11e-01 | 0.1302 |
| 10008 | KCNE3 | P74T-E | Human | Esophagus | ESCC | 7.30e-06 | 3.21e-01 | 0.1479 |
| 10008 | KCNE3 | P75T-E | Human | Esophagus | ESCC | 1.43e-42 | 9.62e-01 | 0.1125 |
| Page: 1 2 3 |
| Tissue | Expression Dynamics | Abbreviation |
| Esophagus | 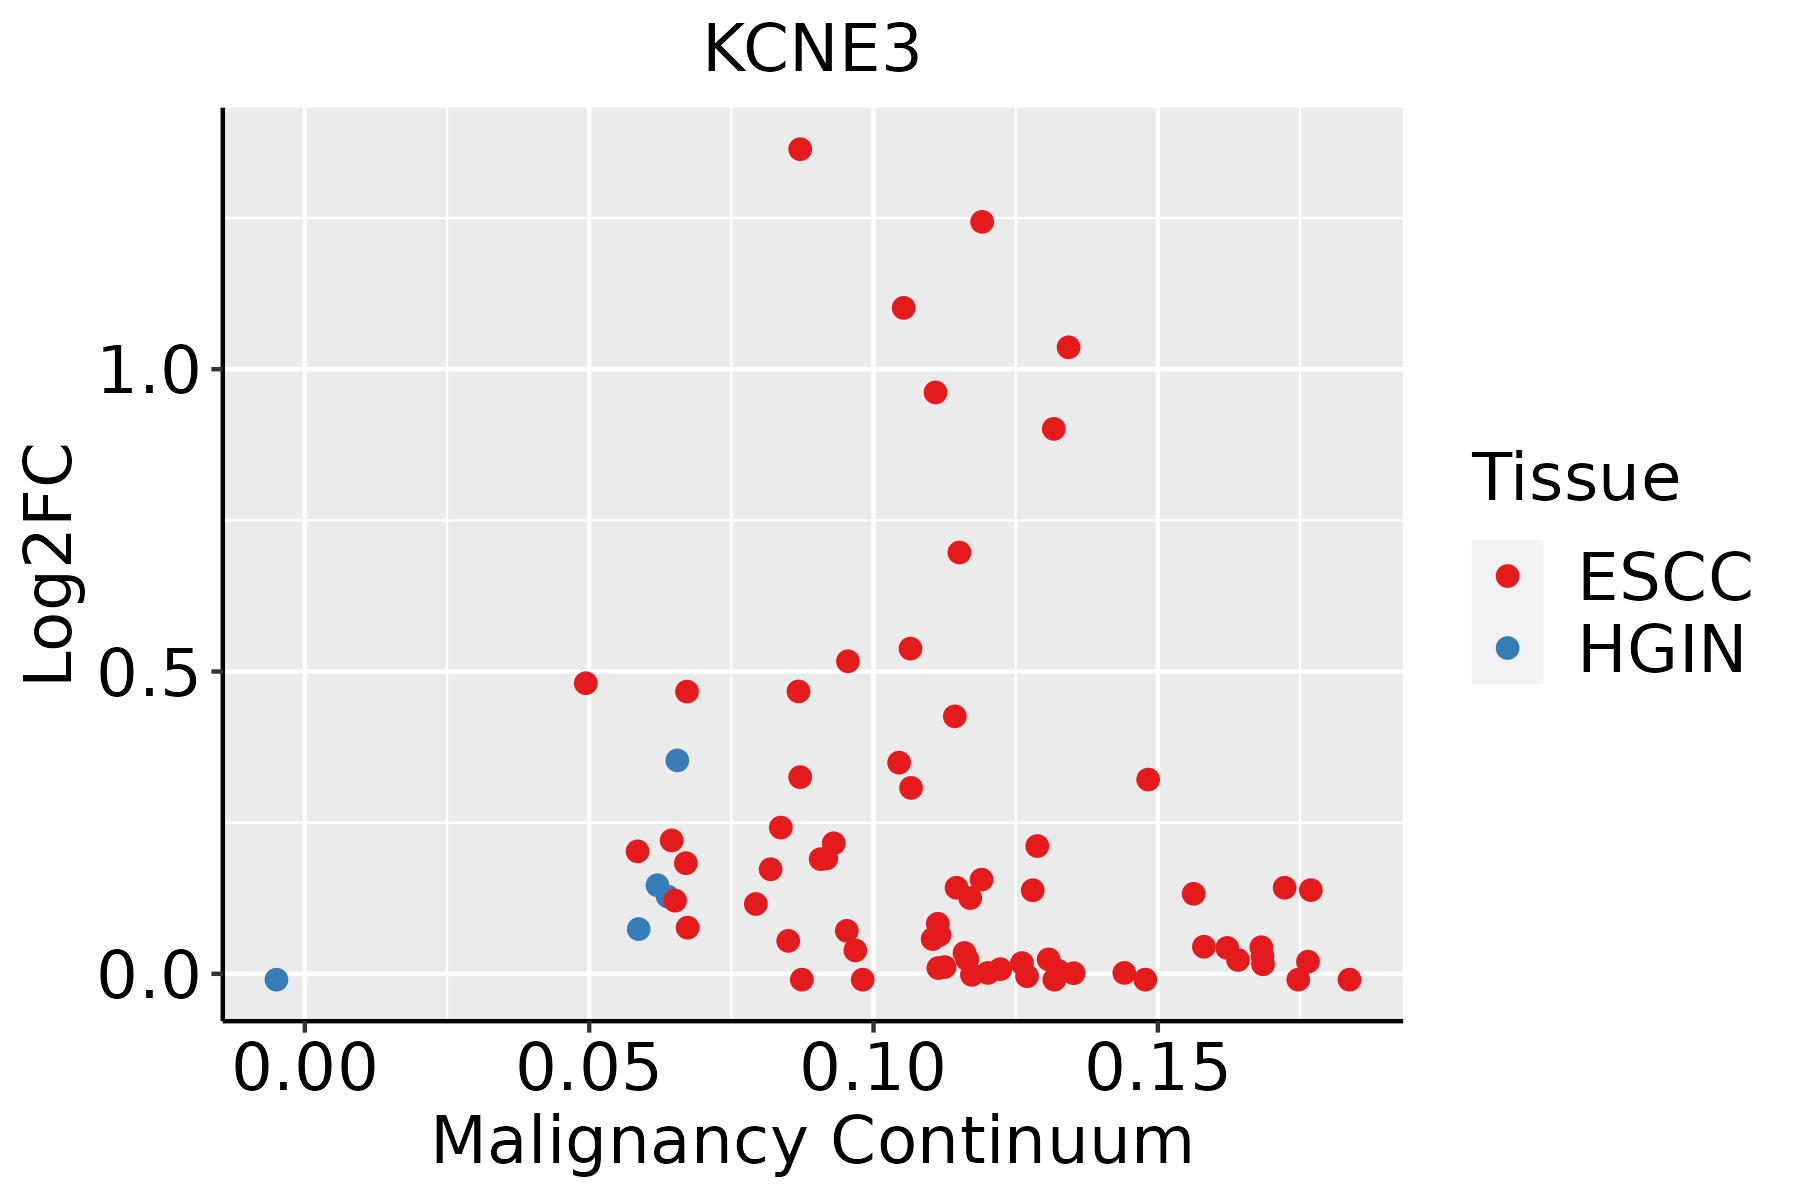 | ESCC: Esophageal squamous cell carcinoma |
| HGIN: High-grade intraepithelial neoplasias | ||
| LGIN: Low-grade intraepithelial neoplasias | ||
| GC | 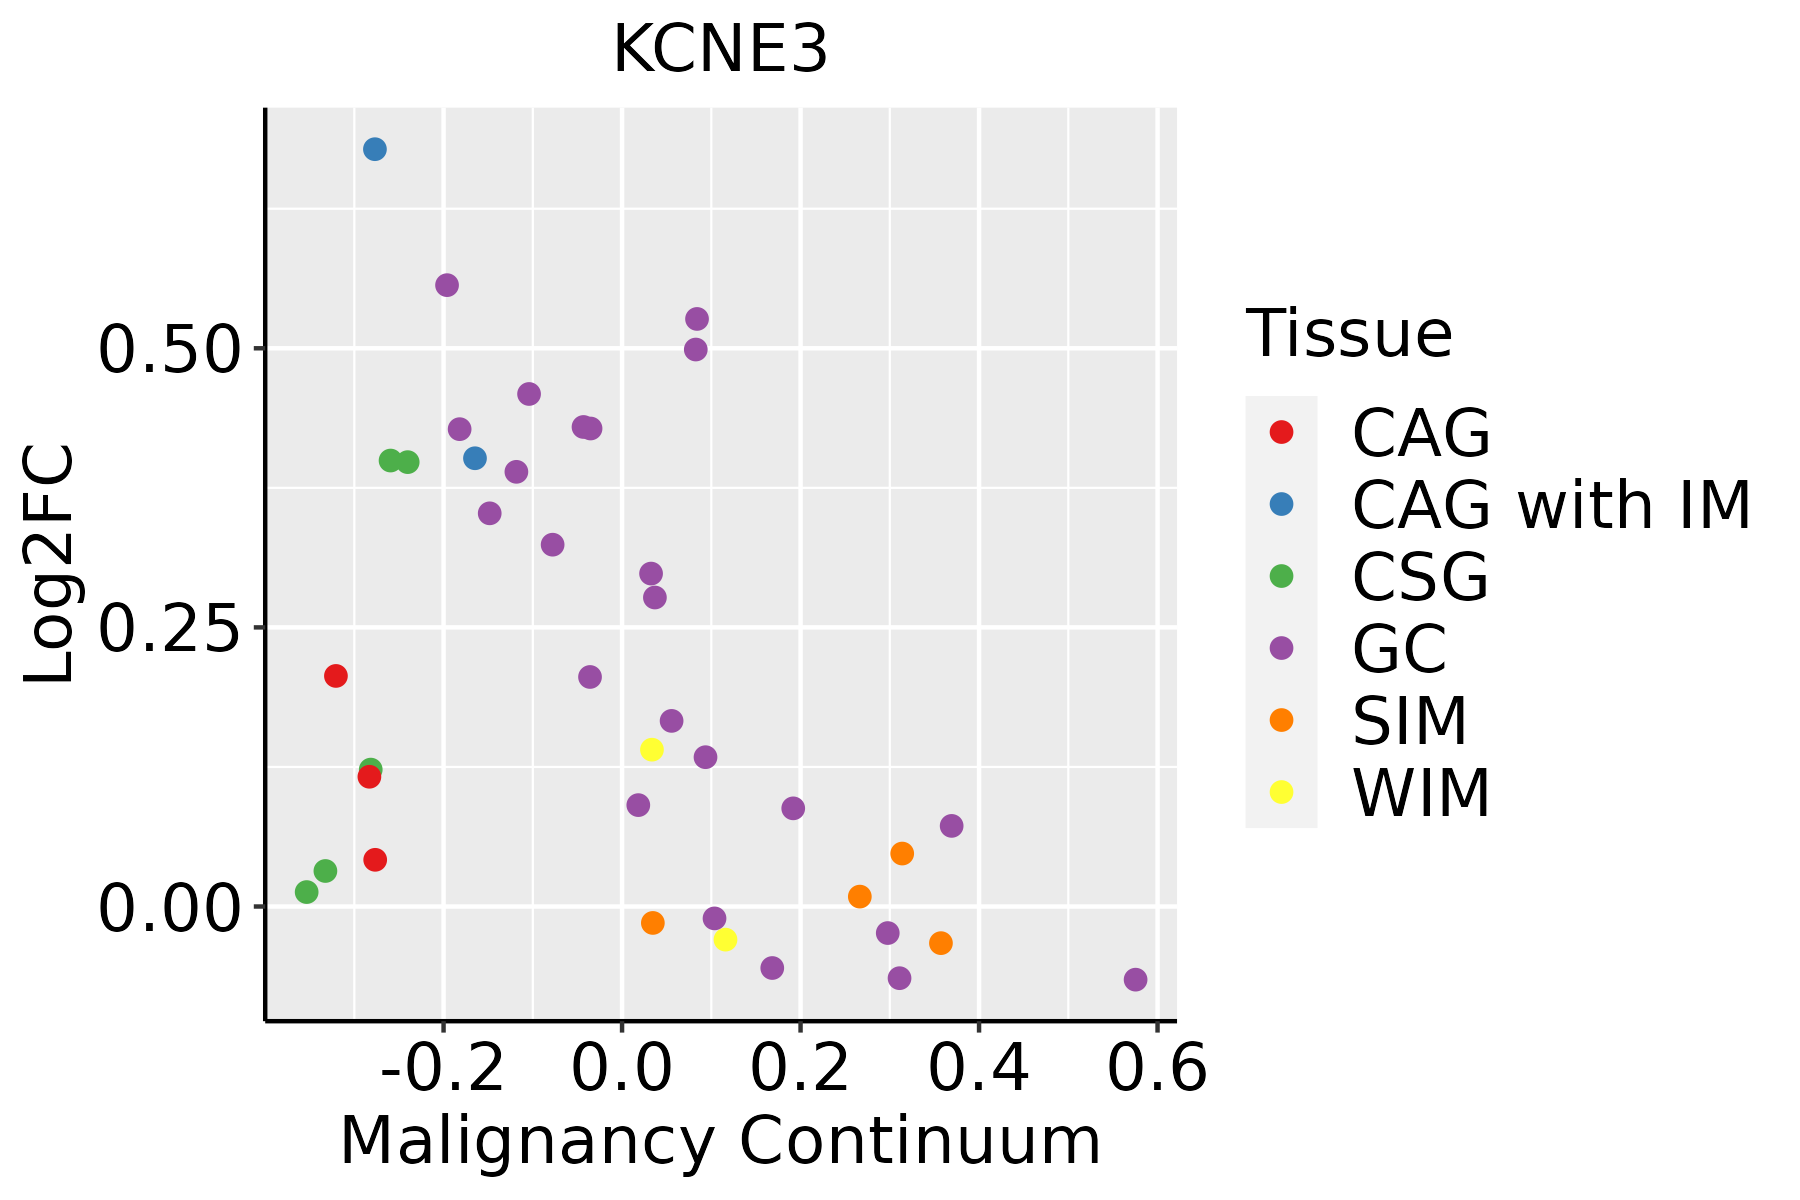 | CAG: Chronic atrophic gastritis |
| CAG with IM: Chronic atrophic gastritis with intestinal metaplasia | ||
| CSG: Chronic superficial gastritis | ||
| GC: Gastric cancer | ||
| SIM: Severe intestinal metaplasia | ||
| WIM: Wild intestinal metaplasia | ||
| Liver | 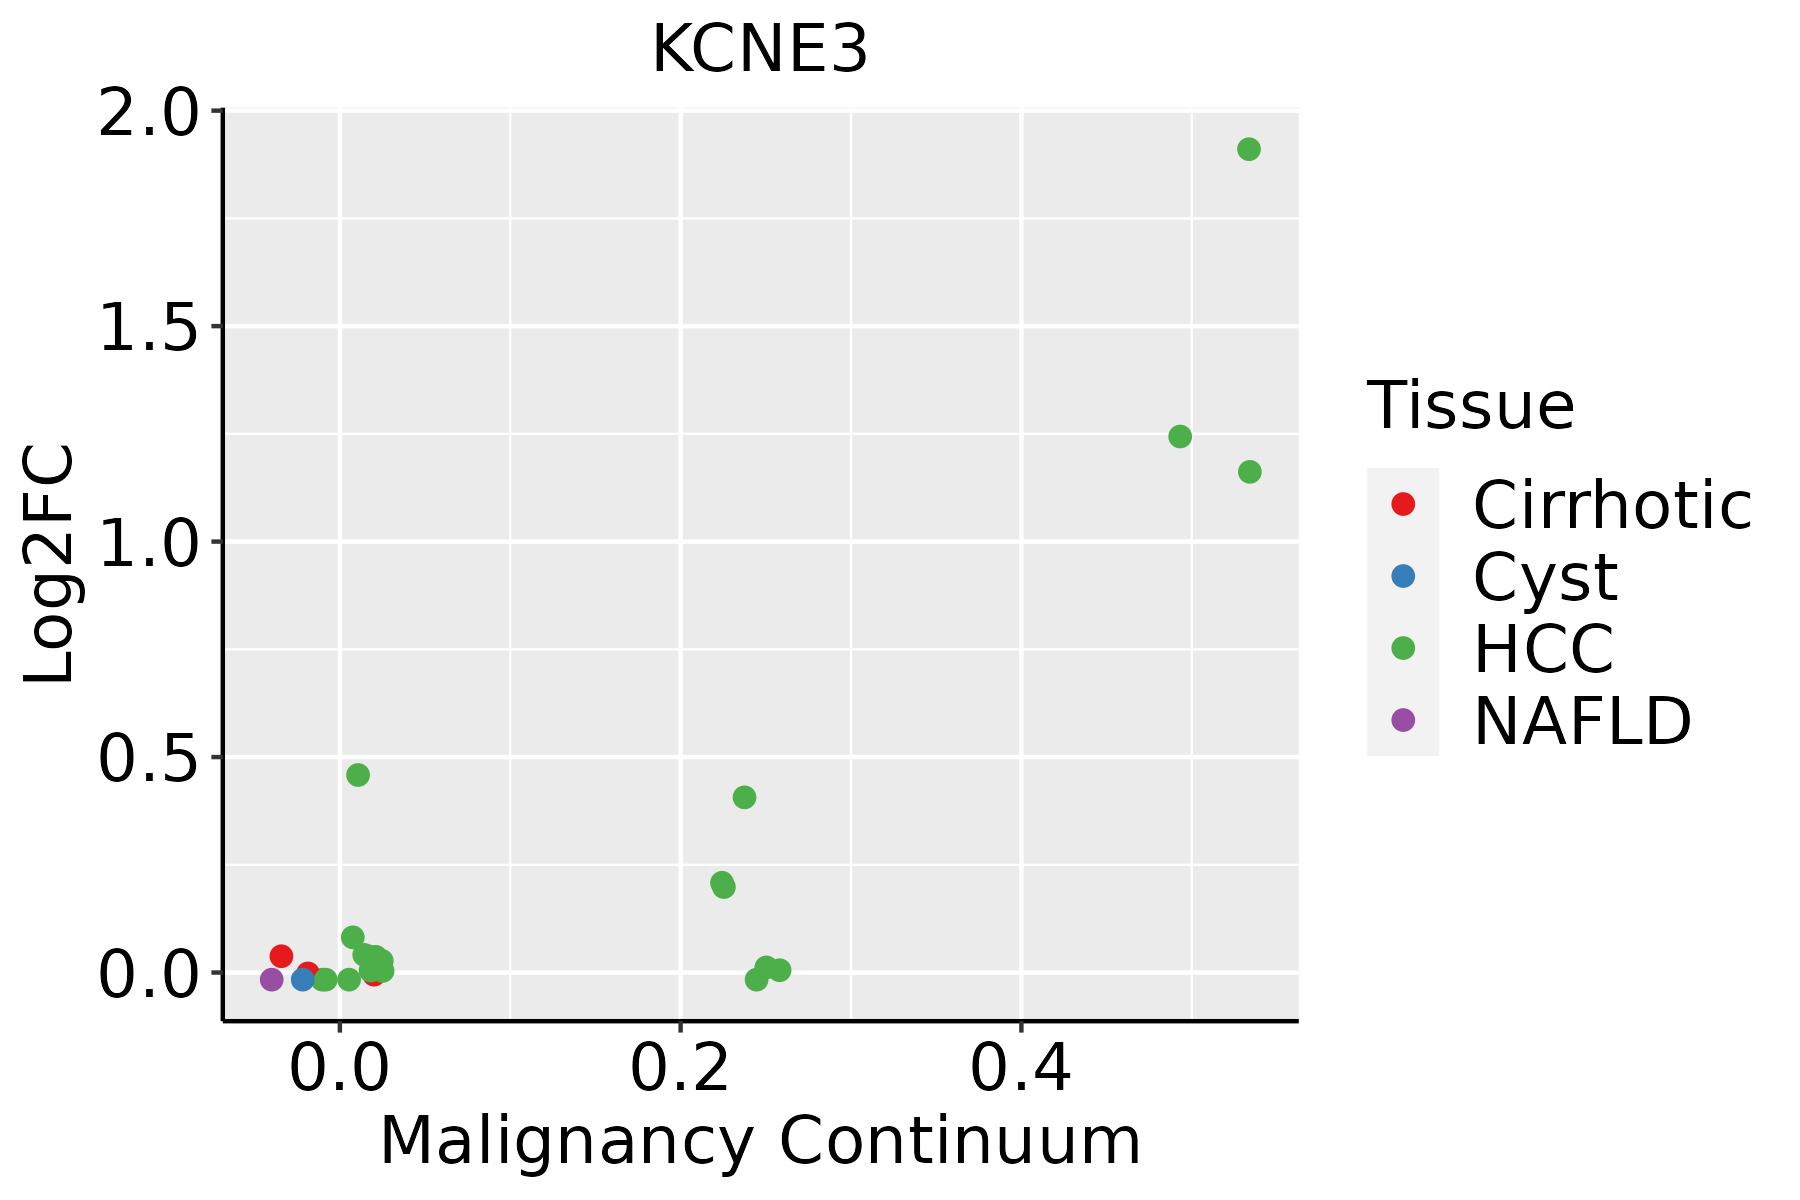 | HCC: Hepatocellular carcinoma |
| NAFLD: Non-alcoholic fatty liver disease |
| ∗log2FC in expression of this searched gene in stem-like cells from each diseased tissue sample relative to stem-like cells in normal samples in each tissue plotted against the malignancy continuum. Samples are colored based on if they are from different disease stage. |
Top |
Malignant transformation related pathway analysis |
| Find out the enriched GO biological processes and KEGG pathways involved in transition from healthy to precancer to cancer |
| Tissue | Disease Stage | Enriched GO biological Processes |
| Colorectum | AD |  |
| Colorectum | SER |  |
| Colorectum | MSS |  |
| Colorectum | MSI-H |  |
| Colorectum | FAP |  |
| ∗Top 15 enriched GO BP terms are showed in the bar plot of each disease state in each tissue. Each row represents a significant GO biological process which is colored according to the -log10(p.adjust). |
| Page: 1 2 3 4 5 6 7 8 9 |
| GO ID | Tissue | Disease Stage | Description | Gene Ratio | Bg Ratio | pvalue | p.adjust | Count |
| GO:00300485 | Stomach | GC | actin filament-based movement | 22/1159 | 127/18723 | 1.03e-05 | 3.42e-04 | 22 |
| GO:00109594 | Stomach | GC | regulation of metal ion transport | 39/1159 | 406/18723 | 4.34e-03 | 3.58e-02 | 39 |
| GO:00860033 | Stomach | GC | cardiac muscle cell contraction | 11/1159 | 73/18723 | 5.06e-03 | 4.00e-02 | 11 |
| GO:00702523 | Stomach | GC | actin-mediated cell contraction | 13/1159 | 97/18723 | 6.72e-03 | 4.89e-02 | 13 |
| GO:003004811 | Stomach | CAG with IM | actin filament-based movement | 20/1050 | 127/18723 | 2.61e-05 | 7.39e-04 | 20 |
| GO:008600311 | Stomach | CAG with IM | cardiac muscle cell contraction | 11/1050 | 73/18723 | 2.38e-03 | 2.37e-02 | 11 |
| GO:007025211 | Stomach | CAG with IM | actin-mediated cell contraction | 13/1050 | 97/18723 | 2.94e-03 | 2.77e-02 | 13 |
| GO:001095911 | Stomach | CAG with IM | regulation of metal ion transport | 36/1050 | 406/18723 | 4.52e-03 | 3.77e-02 | 36 |
| GO:003004821 | Stomach | CSG | actin filament-based movement | 20/1034 | 127/18723 | 2.09e-05 | 6.18e-04 | 20 |
| GO:008600321 | Stomach | CSG | cardiac muscle cell contraction | 11/1034 | 73/18723 | 2.11e-03 | 2.18e-02 | 11 |
| GO:007025221 | Stomach | CSG | actin-mediated cell contraction | 13/1034 | 97/18723 | 2.58e-03 | 2.50e-02 | 13 |
| GO:00109592 | Stomach | CSG | regulation of metal ion transport | 36/1034 | 406/18723 | 3.54e-03 | 3.18e-02 | 36 |
| Page: 1 |
| Pathway ID | Tissue | Disease Stage | Description | Gene Ratio | Bg Ratio | pvalue | p.adjust | qvalue | Count |
| Page: 1 |
Top |
Cell-cell communication analysis |
| Identification of potential cell-cell interactions between two cell types and their ligand-receptor pairs for different disease states |
| Ligand | Receptor | LRpair | Pathway | Tissue | Disease Stage |
| Page: 1 |
Top |
Single-cell gene regulatory network inference analysis |
| Find out the significant the regulons (TFs) and the target genes of each regulon across cell types for different disease states |
| TF | Cell Type | Tissue | Disease Stage | Target Gene | RSS | Regulon Activity |
| ∗The dot plots of a searched regulon are shown for all cell subpopulations in each disease state of each tissue based on the regulon specific score inferred using pySCENIC and by calculating the average expression. |
| Page: 1 |
Top |
Somatic mutation of malignant transformation related genes |
| Annotation of somatic variants for genes involved in malignant transformation |
| Hugo Symbol | Variant Class | Variant Classification | dbSNP RS | HGVSc | HGVSp | HGVSp Short | SWISSPROT | BIOTYPE | SIFT | PolyPhen | Tumor Sample Barcode | Tissue | Histology | Sex | Age | Stage | Therapy Types | Drugs | Outcome |
| KCNE3 | insertion | In_Frame_Ins | novel | c.46_47insTCTATCTTTTCCTGGGAAAAAATCCTTATGCACAAGGCTTCGGTCTAC | p.Ala16delinsValTyrLeuPheLeuGlyLysAsnProTyrAlaGlnGlyPheGlyLeuPro | p.A16delinsVYLFLGKNPYAQGFGLP | Q9Y6H6 | protein_coding | TCGA-A8-A093-01 | Breast | breast invasive carcinoma | Female | <65 | I/II | Hormone Therapy | tamoxiphen | SD | ||
| KCNE3 | SNV | Missense_Mutation | rs547194943 | c.20N>T | p.Thr7Met | p.T7M | Q9Y6H6 | protein_coding | tolerated_low_confidence(0.11) | benign(0.015) | TCGA-DS-A0VK-01 | Cervix | cervical & endocervical cancer | Female | <65 | I/II | Chemotherapy | carboplatin | PD |
| KCNE3 | SNV | Missense_Mutation | rs773287275 | c.49G>A | p.Val17Met | p.V17M | Q9Y6H6 | protein_coding | tolerated_low_confidence(0.22) | probably_damaging(0.996) | TCGA-EA-A3HS-01 | Cervix | cervical & endocervical cancer | Female | <65 | I/II | Unknown | Unknown | SD |
| KCNE3 | SNV | Missense_Mutation | c.22N>C | p.Glu8Gln | p.E8Q | Q9Y6H6 | protein_coding | deleterious_low_confidence(0.02) | benign(0.08) | TCGA-VS-A953-01 | Cervix | cervical & endocervical cancer | Female | <65 | I/II | Unknown | Unknown | PD | |
| KCNE3 | SNV | Missense_Mutation | novel | c.280N>A | p.Val94Met | p.V94M | Q9Y6H6 | protein_coding | tolerated(0.06) | benign(0.134) | TCGA-5M-AAT6-01 | Colorectum | colon adenocarcinoma | Female | <65 | III/IV | Unknown | Unknown | PD |
| KCNE3 | SNV | Missense_Mutation | rs773287275 | c.49N>A | p.Val17Met | p.V17M | Q9Y6H6 | protein_coding | tolerated_low_confidence(0.22) | probably_damaging(0.996) | TCGA-AJ-A3EK-01 | Endometrium | uterine corpus endometrioid carcinoma | Female | <65 | I/II | Chemotherapy | carboplatin | CR |
| KCNE3 | SNV | Missense_Mutation | novel | c.179N>G | p.Tyr60Cys | p.Y60C | Q9Y6H6 | protein_coding | deleterious(0) | probably_damaging(0.983) | TCGA-E6-A1LX-01 | Endometrium | uterine corpus endometrioid carcinoma | Female | <65 | I/II | Unknown | Unknown | SD |
| KCNE3 | SNV | Missense_Mutation | c.205G>C | p.Ala69Pro | p.A69P | Q9Y6H6 | protein_coding | deleterious(0.02) | probably_damaging(0.999) | TCGA-FV-A2QQ-01 | Liver | liver hepatocellular carcinoma | Male | >=65 | I/II | Unknown | Unknown | SD | |
| KCNE3 | SNV | Missense_Mutation | rs752253389 | c.126G>T | p.Gln42His | p.Q42H | Q9Y6H6 | protein_coding | tolerated(0.36) | benign(0.003) | TCGA-43-8118-01 | Lung | lung squamous cell carcinoma | Female | <65 | I/II | Chemotherapy | docetaxel | SD |
| KCNE3 | SNV | Missense_Mutation | c.170N>T | p.Ser57Phe | p.S57F | Q9Y6H6 | protein_coding | deleterious(0) | probably_damaging(0.967) | TCGA-90-A4ED-01 | Lung | lung squamous cell carcinoma | Male | >=65 | I/II | Unknown | Unknown | SD |
| Page: 1 2 |
Top |
Related drugs of malignant transformation related genes |
| Identification of chemicals and drugs interact with genes involved in malignant transfromation |
| (DGIdb 4.0) |
| Entrez ID | Symbol | Category | Interaction Types | Drug Claim Name | Drug Name | PMIDs |
| Page: 1 |

Copyright 2023-Present -The University of Texas Health Science Center at Houston |