
|
|||||
|
 | |
| |
| |
| |
| |
| |
|
Gene: KCNAB2 |
Gene summary for KCNAB2 |
| Gene information | Species | Human | Gene symbol | KCNAB2 | Gene ID | 8514 |
| Gene name | potassium voltage-gated channel subfamily A regulatory beta subunit 2 | |
| Gene Alias | AKR6A5 | |
| Cytomap | 1p36.31 | |
| Gene Type | protein-coding | GO ID | GO:0001508 | UniProtAcc | A0A024R4E3 |
Top |
Malignant transformation analysis |
| Identification of the aberrant gene expression in precancerous and cancerous lesions by comparing the gene expression of stem-like cells in diseased tissues with normal stem cells |
| Entrez ID | Symbol | Replicates | Species | Organ | Tissue | Adj P-value | Log2FC | Malignancy |
| 8514 | KCNAB2 | HCC2 | Human | Liver | HCC | 7.14e-06 | 3.12e+00 | 0.5341 |
| 8514 | KCNAB2 | S014 | Human | Liver | HCC | 1.43e-07 | 4.16e-01 | 0.2254 |
| 8514 | KCNAB2 | S015 | Human | Liver | HCC | 1.70e-07 | 5.72e-01 | 0.2375 |
| 8514 | KCNAB2 | S016 | Human | Liver | HCC | 6.14e-18 | 7.03e-01 | 0.2243 |
| 8514 | KCNAB2 | S028 | Human | Liver | HCC | 3.24e-04 | 3.16e-01 | 0.2503 |
| 8514 | KCNAB2 | S029 | Human | Liver | HCC | 1.49e-09 | 4.44e-01 | 0.2581 |
| Page: 1 |
| Tissue | Expression Dynamics | Abbreviation |
| Liver | 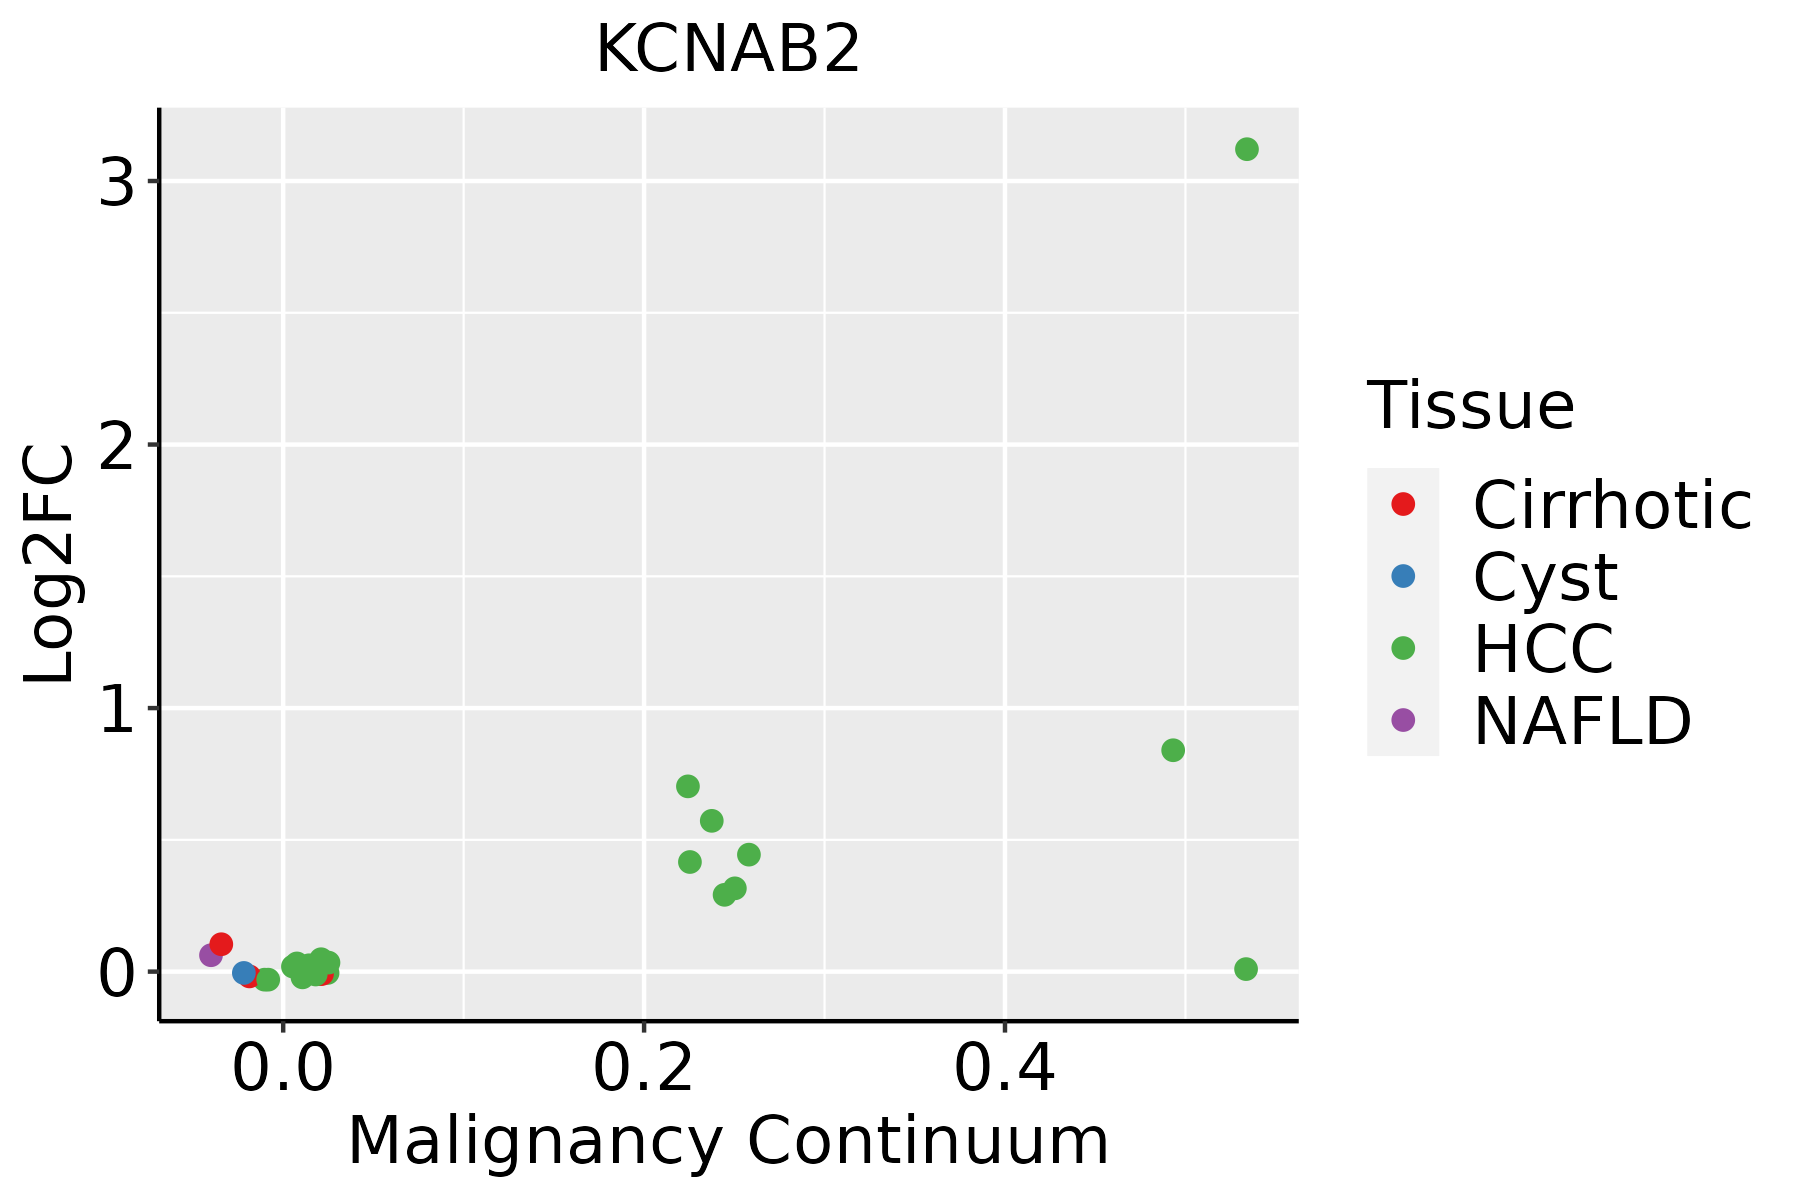 | HCC: Hepatocellular carcinoma |
| NAFLD: Non-alcoholic fatty liver disease |
| ∗log2FC in expression of this searched gene in stem-like cells from each diseased tissue sample relative to stem-like cells in normal samples in each tissue plotted against the malignancy continuum. Samples are colored based on if they are from different disease stage. |
Top |
Malignant transformation related pathway analysis |
| Find out the enriched GO biological processes and KEGG pathways involved in transition from healthy to precancer to cancer |
| Tissue | Disease Stage | Enriched GO biological Processes |
| Colorectum | AD |  |
| Colorectum | SER |  |
| Colorectum | MSS |  |
| Colorectum | MSI-H |  |
| Colorectum | FAP |  |
| ∗Top 15 enriched GO BP terms are showed in the bar plot of each disease state in each tissue. Each row represents a significant GO biological process which is colored according to the -log10(p.adjust). |
| Page: 1 2 3 4 5 6 7 8 9 |
| GO ID | Tissue | Disease Stage | Description | Gene Ratio | Bg Ratio | pvalue | p.adjust | Count |
| GO:0006739 | Liver | HCC | NADP metabolic process | 25/7958 | 35/18723 | 5.05e-04 | 3.29e-03 | 25 |
| Page: 1 |
| Pathway ID | Tissue | Disease Stage | Description | Gene Ratio | Bg Ratio | pvalue | p.adjust | qvalue | Count |
| Page: 1 |
Top |
Cell-cell communication analysis |
| Identification of potential cell-cell interactions between two cell types and their ligand-receptor pairs for different disease states |
| Ligand | Receptor | LRpair | Pathway | Tissue | Disease Stage |
| Page: 1 |
Top |
Single-cell gene regulatory network inference analysis |
| Find out the significant the regulons (TFs) and the target genes of each regulon across cell types for different disease states |
| TF | Cell Type | Tissue | Disease Stage | Target Gene | RSS | Regulon Activity |
| ∗The dot plots of a searched regulon are shown for all cell subpopulations in each disease state of each tissue based on the regulon specific score inferred using pySCENIC and by calculating the average expression. |
| Page: 1 |
Top |
Somatic mutation of malignant transformation related genes |
| Annotation of somatic variants for genes involved in malignant transformation |
| Hugo Symbol | Variant Class | Variant Classification | dbSNP RS | HGVSc | HGVSp | HGVSp Short | SWISSPROT | BIOTYPE | SIFT | PolyPhen | Tumor Sample Barcode | Tissue | Histology | Sex | Age | Stage | Therapy Types | Drugs | Outcome |
| KCNAB2 | SNV | Missense_Mutation | c.352G>A | p.Asp118Asn | p.D118N | Q13303 | protein_coding | deleterious(0) | probably_damaging(0.992) | TCGA-AN-A046-01 | Breast | breast invasive carcinoma | Female | >=65 | I/II | Unknown | Unknown | SD | |
| KCNAB2 | insertion | Frame_Shift_Ins | novel | c.1109_1110insG | p.Ala372GlyfsTer29 | p.A372Gfs*29 | Q13303 | protein_coding | TCGA-BH-A18U-01 | Breast | breast invasive carcinoma | Female | >=65 | III/IV | Unknown | Unknown | SD | ||
| KCNAB2 | SNV | Missense_Mutation | novel | c.374C>T | p.Ala125Val | p.A125V | Q13303 | protein_coding | deleterious(0.01) | benign(0.415) | TCGA-2W-A8YY-01 | Cervix | cervical & endocervical cancer | Female | <65 | I/II | Chemotherapy | cisplatin | CR |
| KCNAB2 | SNV | Missense_Mutation | c.707C>T | p.Ser236Leu | p.S236L | Q13303 | protein_coding | deleterious(0) | probably_damaging(1) | TCGA-Q1-A73O-01 | Cervix | cervical & endocervical cancer | Female | <65 | I/II | Chemotherapy | cisplatin | CR | |
| KCNAB2 | SNV | Missense_Mutation | c.991C>T | p.Arg331Trp | p.R331W | Q13303 | protein_coding | deleterious(0) | probably_damaging(0.986) | TCGA-A6-6650-01 | Colorectum | colon adenocarcinoma | Female | >=65 | I/II | Unknown | Unknown | SD | |
| KCNAB2 | SNV | Missense_Mutation | c.352N>A | p.Asp118Asn | p.D118N | Q13303 | protein_coding | deleterious(0) | probably_damaging(0.992) | TCGA-AA-3984-01 | Colorectum | colon adenocarcinoma | Female | <65 | I/II | Unknown | Unknown | SD | |
| KCNAB2 | SNV | Missense_Mutation | rs746056849 | c.856N>A | p.Val286Met | p.V286M | Q13303 | protein_coding | tolerated(0.06) | probably_damaging(0.982) | TCGA-AY-A54L-01 | Colorectum | colon adenocarcinoma | Female | >=65 | I/II | Unknown | Unknown | PD |
| KCNAB2 | SNV | Missense_Mutation | c.1196N>G | p.Ile399Ser | p.I399S | Q13303 | protein_coding | deleterious(0) | possibly_damaging(0.888) | TCGA-CA-6718-01 | Colorectum | colon adenocarcinoma | Male | <65 | I/II | Unknown | Unknown | PD | |
| KCNAB2 | SNV | Missense_Mutation | rs143302486 | c.1124N>T | p.Ala375Val | p.A375V | Q13303 | protein_coding | tolerated(0.79) | benign(0.009) | TCGA-G4-6320-01 | Colorectum | colon adenocarcinoma | Male | >=65 | III/IV | Chemotherapy | oxaliplatin | SD |
| KCNAB2 | SNV | Missense_Mutation | novel | c.1151N>T | p.Ala384Val | p.A384V | Q13303 | protein_coding | deleterious(0) | possibly_damaging(0.728) | TCGA-AJ-A3EL-01 | Endometrium | uterine corpus endometrioid carcinoma | Female | <65 | I/II | Unknown | Unknown | SD |
| Page: 1 2 3 4 |
Top |
Related drugs of malignant transformation related genes |
| Identification of chemicals and drugs interact with genes involved in malignant transfromation |
| (DGIdb 4.0) |
| Entrez ID | Symbol | Category | Interaction Types | Drug Claim Name | Drug Name | PMIDs |
| Page: 1 |

Copyright 2023-Present -The University of Texas Health Science Center at Houston |