
|
|||||
|
 | |
| |
| |
| |
| |
| |
|
Gene: KBTBD7 |
Gene summary for KBTBD7 |
| Gene information | Species | Human | Gene symbol | KBTBD7 | Gene ID | 84078 |
| Gene name | kelch repeat and BTB domain containing 7 | |
| Gene Alias | KBTBD7 | |
| Cytomap | 13q14.11 | |
| Gene Type | protein-coding | GO ID | GO:0000209 | UniProtAcc | Q8WVZ9 |
Top |
Malignant transformation analysis |
| Identification of the aberrant gene expression in precancerous and cancerous lesions by comparing the gene expression of stem-like cells in diseased tissues with normal stem cells |
| Entrez ID | Symbol | Replicates | Species | Organ | Tissue | Adj P-value | Log2FC | Malignancy |
| 84078 | KBTBD7 | LZE4T | Human | Esophagus | ESCC | 1.15e-07 | 3.04e-01 | 0.0811 |
| 84078 | KBTBD7 | LZE8T | Human | Esophagus | ESCC | 1.33e-07 | 3.25e-01 | 0.067 |
| 84078 | KBTBD7 | LZE20T | Human | Esophagus | ESCC | 6.47e-05 | 1.76e-01 | 0.0662 |
| 84078 | KBTBD7 | LZE22T | Human | Esophagus | ESCC | 1.36e-04 | 3.31e-01 | 0.068 |
| 84078 | KBTBD7 | LZE24T | Human | Esophagus | ESCC | 3.55e-04 | 8.90e-02 | 0.0596 |
| 84078 | KBTBD7 | LZE21T | Human | Esophagus | ESCC | 3.90e-02 | 3.34e-01 | 0.0655 |
| 84078 | KBTBD7 | P1T-E | Human | Esophagus | ESCC | 4.21e-04 | 2.99e-01 | 0.0875 |
| 84078 | KBTBD7 | P2T-E | Human | Esophagus | ESCC | 4.10e-18 | 2.75e-01 | 0.1177 |
| 84078 | KBTBD7 | P4T-E | Human | Esophagus | ESCC | 4.10e-20 | 4.71e-01 | 0.1323 |
| 84078 | KBTBD7 | P8T-E | Human | Esophagus | ESCC | 6.20e-11 | 2.43e-01 | 0.0889 |
| 84078 | KBTBD7 | P9T-E | Human | Esophagus | ESCC | 7.67e-17 | 4.47e-01 | 0.1131 |
| 84078 | KBTBD7 | P10T-E | Human | Esophagus | ESCC | 9.49e-20 | 3.35e-01 | 0.116 |
| 84078 | KBTBD7 | P11T-E | Human | Esophagus | ESCC | 2.11e-07 | 5.18e-01 | 0.1426 |
| 84078 | KBTBD7 | P12T-E | Human | Esophagus | ESCC | 1.53e-03 | 9.16e-02 | 0.1122 |
| 84078 | KBTBD7 | P15T-E | Human | Esophagus | ESCC | 1.34e-12 | 2.68e-01 | 0.1149 |
| 84078 | KBTBD7 | P16T-E | Human | Esophagus | ESCC | 5.22e-21 | 3.93e-01 | 0.1153 |
| 84078 | KBTBD7 | P17T-E | Human | Esophagus | ESCC | 1.74e-07 | 2.68e-01 | 0.1278 |
| 84078 | KBTBD7 | P20T-E | Human | Esophagus | ESCC | 2.17e-12 | 2.76e-01 | 0.1124 |
| 84078 | KBTBD7 | P21T-E | Human | Esophagus | ESCC | 5.09e-09 | 2.45e-01 | 0.1617 |
| 84078 | KBTBD7 | P22T-E | Human | Esophagus | ESCC | 1.20e-03 | 1.66e-01 | 0.1236 |
| Page: 1 2 3 4 |
| Tissue | Expression Dynamics | Abbreviation |
| Esophagus |  | ESCC: Esophageal squamous cell carcinoma |
| HGIN: High-grade intraepithelial neoplasias | ||
| LGIN: Low-grade intraepithelial neoplasias | ||
| Oral Cavity | 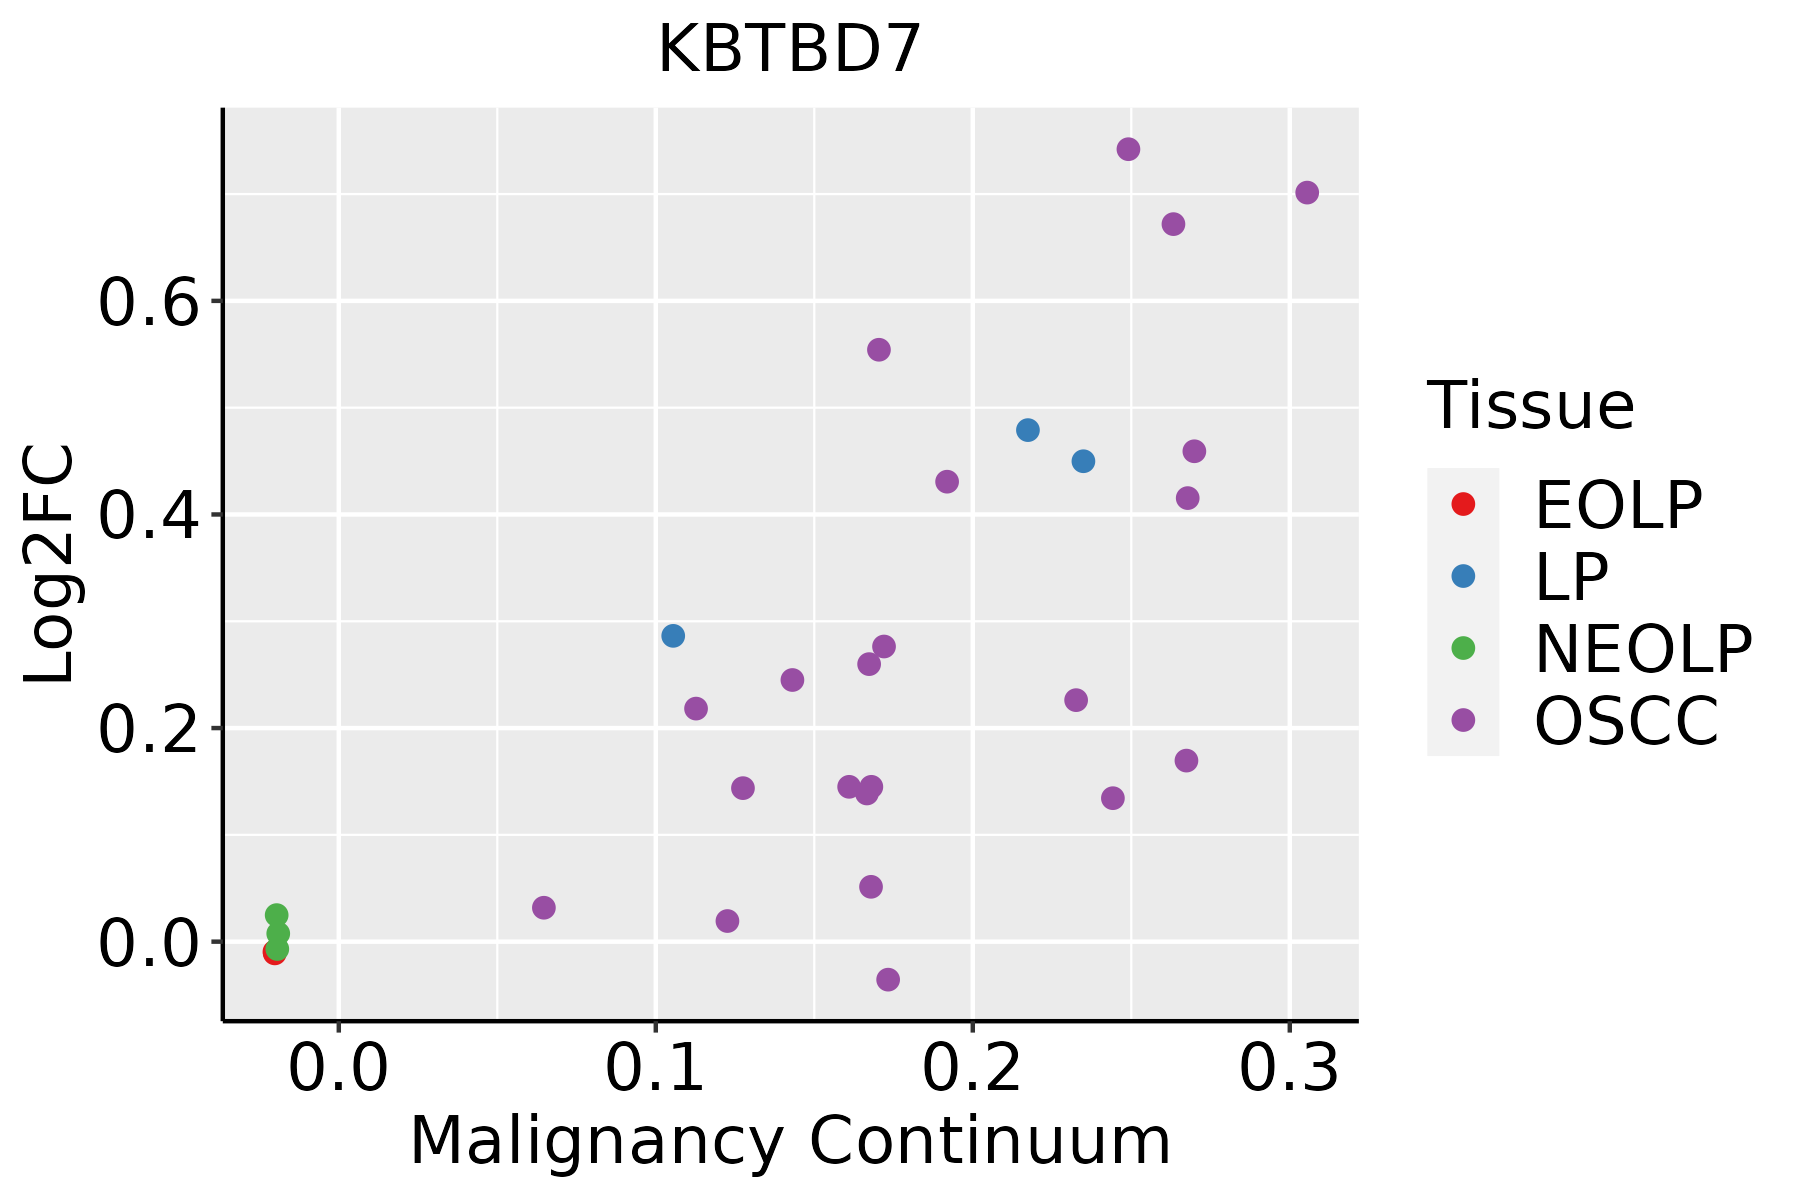 | EOLP: Erosive Oral lichen planus |
| LP: leukoplakia | ||
| NEOLP: Non-erosive oral lichen planus | ||
| OSCC: Oral squamous cell carcinoma |
| ∗log2FC in expression of this searched gene in stem-like cells from each diseased tissue sample relative to stem-like cells in normal samples in each tissue plotted against the malignancy continuum. Samples are colored based on if they are from different disease stage. |
Top |
Malignant transformation related pathway analysis |
| Find out the enriched GO biological processes and KEGG pathways involved in transition from healthy to precancer to cancer |
| Tissue | Disease Stage | Enriched GO biological Processes |
| Colorectum | AD |  |
| Colorectum | SER |  |
| Colorectum | MSS |  |
| Colorectum | MSI-H |  |
| Colorectum | FAP |  |
| ∗Top 15 enriched GO BP terms are showed in the bar plot of each disease state in each tissue. Each row represents a significant GO biological process which is colored according to the -log10(p.adjust). |
| Page: 1 2 3 4 5 6 7 8 9 |
| GO ID | Tissue | Disease Stage | Description | Gene Ratio | Bg Ratio | pvalue | p.adjust | Count |
| GO:0010498111 | Esophagus | ESCC | proteasomal protein catabolic process | 369/8552 | 490/18723 | 1.13e-41 | 1.80e-38 | 369 |
| GO:0043161111 | Esophagus | ESCC | proteasome-mediated ubiquitin-dependent protein catabolic process | 312/8552 | 412/18723 | 3.53e-36 | 4.48e-33 | 312 |
| GO:000020917 | Esophagus | ESCC | protein polyubiquitination | 170/8552 | 236/18723 | 1.40e-16 | 1.09e-14 | 170 |
| GO:007093617 | Esophagus | ESCC | protein K48-linked ubiquitination | 55/8552 | 65/18723 | 8.42e-11 | 2.58e-09 | 55 |
| GO:000726510 | Esophagus | ESCC | Ras protein signal transduction | 201/8552 | 337/18723 | 1.44e-07 | 2.30e-06 | 201 |
| GO:00166019 | Esophagus | ESCC | Rac protein signal transduction | 33/8552 | 42/18723 | 1.35e-05 | 1.23e-04 | 33 |
| GO:0035020 | Esophagus | ESCC | regulation of Rac protein signal transduction | 17/8552 | 21/18723 | 1.03e-03 | 5.19e-03 | 17 |
| GO:00465789 | Esophagus | ESCC | regulation of Ras protein signal transduction | 106/8552 | 189/18723 | 2.49e-03 | 1.08e-02 | 106 |
| GO:005105610 | Esophagus | ESCC | regulation of small GTPase mediated signal transduction | 157/8552 | 302/18723 | 1.55e-02 | 4.98e-02 | 157 |
| GO:001049820 | Oral cavity | OSCC | proteasomal protein catabolic process | 336/7305 | 490/18723 | 5.45e-41 | 8.63e-38 | 336 |
| GO:004316120 | Oral cavity | OSCC | proteasome-mediated ubiquitin-dependent protein catabolic process | 285/7305 | 412/18723 | 5.68e-36 | 5.99e-33 | 285 |
| GO:000020910 | Oral cavity | OSCC | protein polyubiquitination | 150/7305 | 236/18723 | 1.59e-14 | 9.27e-13 | 150 |
| GO:00709369 | Oral cavity | OSCC | protein K48-linked ubiquitination | 53/7305 | 65/18723 | 2.47e-12 | 1.02e-10 | 53 |
| GO:00072659 | Oral cavity | OSCC | Ras protein signal transduction | 185/7305 | 337/18723 | 1.95e-09 | 4.60e-08 | 185 |
| GO:00166018 | Oral cavity | OSCC | Rac protein signal transduction | 28/7305 | 42/18723 | 2.61e-04 | 1.67e-03 | 28 |
| GO:00465788 | Oral cavity | OSCC | regulation of Ras protein signal transduction | 90/7305 | 189/18723 | 9.58e-03 | 3.40e-02 | 90 |
| Page: 1 |
| Pathway ID | Tissue | Disease Stage | Description | Gene Ratio | Bg Ratio | pvalue | p.adjust | qvalue | Count |
| Page: 1 |
Top |
Cell-cell communication analysis |
| Identification of potential cell-cell interactions between two cell types and their ligand-receptor pairs for different disease states |
| Ligand | Receptor | LRpair | Pathway | Tissue | Disease Stage |
| Page: 1 |
Top |
Single-cell gene regulatory network inference analysis |
| Find out the significant the regulons (TFs) and the target genes of each regulon across cell types for different disease states |
| TF | Cell Type | Tissue | Disease Stage | Target Gene | RSS | Regulon Activity |
| ∗The dot plots of a searched regulon are shown for all cell subpopulations in each disease state of each tissue based on the regulon specific score inferred using pySCENIC and by calculating the average expression. |
| Page: 1 |
Top |
Somatic mutation of malignant transformation related genes |
| Annotation of somatic variants for genes involved in malignant transformation |
| Hugo Symbol | Variant Class | Variant Classification | dbSNP RS | HGVSc | HGVSp | HGVSp Short | SWISSPROT | BIOTYPE | SIFT | PolyPhen | Tumor Sample Barcode | Tissue | Histology | Sex | Age | Stage | Therapy Types | Drugs | Outcome |
| KBTBD7 | SNV | Missense_Mutation | novel | c.1367N>T | p.Cys456Phe | p.C456F | Q8WVZ9 | protein_coding | deleterious(0.03) | probably_damaging(0.989) | TCGA-AC-A5EH-01 | Breast | breast invasive carcinoma | Female | >=65 | I/II | Unknown | Unknown | SD |
| KBTBD7 | SNV | Missense_Mutation | c.1132C>G | p.His378Asp | p.H378D | Q8WVZ9 | protein_coding | tolerated(0.52) | benign(0) | TCGA-AC-A5XU-01 | Breast | breast invasive carcinoma | Female | >=65 | I/II | Hormone Therapy | letrozole | SD | |
| KBTBD7 | SNV | Missense_Mutation | novel | c.869N>G | p.Tyr290Cys | p.Y290C | Q8WVZ9 | protein_coding | deleterious(0.02) | possibly_damaging(0.781) | TCGA-D8-A1XK-01 | Breast | breast invasive carcinoma | Female | <65 | I/II | Chemotherapy | doxorubicine+cyclophosphamide | SD |
| KBTBD7 | SNV | Missense_Mutation | novel | c.1109C>A | p.Pro370Gln | p.P370Q | Q8WVZ9 | protein_coding | tolerated(0.13) | benign(0.36) | TCGA-GM-A2DL-01 | Breast | breast invasive carcinoma | Female | <65 | I/II | Hormone Therapy | tamoxiphen | CR |
| KBTBD7 | deletion | Frame_Shift_Del | novel | c.290delA | p.Lys97ArgfsTer16 | p.K97Rfs*16 | Q8WVZ9 | protein_coding | TCGA-D8-A27V-01 | Breast | breast invasive carcinoma | Female | <65 | I/II | Hormone Therapy | tamoxiphen | SD | ||
| KBTBD7 | SNV | Missense_Mutation | novel | c.710G>A | p.Arg237Gln | p.R237Q | Q8WVZ9 | protein_coding | tolerated(0.44) | benign(0.007) | TCGA-2W-A8YY-01 | Cervix | cervical & endocervical cancer | Female | <65 | I/II | Chemotherapy | cisplatin | CR |
| KBTBD7 | SNV | Missense_Mutation | rs751767633 | c.416C>T | p.Ala139Val | p.A139V | Q8WVZ9 | protein_coding | deleterious(0.05) | benign(0.272) | TCGA-2W-A8YY-01 | Cervix | cervical & endocervical cancer | Female | <65 | I/II | Chemotherapy | cisplatin | CR |
| KBTBD7 | SNV | Missense_Mutation | c.172G>A | p.Asp58Asn | p.D58N | Q8WVZ9 | protein_coding | deleterious(0) | probably_damaging(0.999) | TCGA-C5-A2LZ-01 | Cervix | cervical & endocervical cancer | Female | >=65 | III/IV | Unknown | Unknown | PD | |
| KBTBD7 | SNV | Missense_Mutation | novel | c.1957N>A | p.Asp653Asn | p.D653N | Q8WVZ9 | protein_coding | tolerated_low_confidence(0.43) | probably_damaging(0.994) | TCGA-C5-A3HE-01 | Cervix | cervical & endocervical cancer | Female | <65 | I/II | Unknown | Unknown | PD |
| KBTBD7 | SNV | Missense_Mutation | c.1405C>T | p.Pro469Ser | p.P469S | Q8WVZ9 | protein_coding | tolerated(0.13) | benign(0.047) | TCGA-IR-A3LA-01 | Cervix | cervical & endocervical cancer | Female | <65 | I/II | Chemotherapy | cisplatin | CR |
| Page: 1 2 3 4 5 6 7 8 9 10 |
Top |
Related drugs of malignant transformation related genes |
| Identification of chemicals and drugs interact with genes involved in malignant transfromation |
| (DGIdb 4.0) |
| Entrez ID | Symbol | Category | Interaction Types | Drug Claim Name | Drug Name | PMIDs |
| Page: 1 |

Copyright 2023-Present -The University of Texas Health Science Center at Houston |