
|
|||||
|
 | |
| |
| |
| |
| |
| |
|
Gene: KBTBD6 |
Gene summary for KBTBD6 |
| Gene information | Species | Human | Gene symbol | KBTBD6 | Gene ID | 89890 |
| Gene name | kelch repeat and BTB domain containing 6 | |
| Gene Alias | KBTBD6 | |
| Cytomap | 13q14.11 | |
| Gene Type | protein-coding | GO ID | GO:0000209 | UniProtAcc | Q86V97 |
Top |
Malignant transformation analysis |
| Identification of the aberrant gene expression in precancerous and cancerous lesions by comparing the gene expression of stem-like cells in diseased tissues with normal stem cells |
| Entrez ID | Symbol | Replicates | Species | Organ | Tissue | Adj P-value | Log2FC | Malignancy |
| 89890 | KBTBD6 | LZE4T | Human | Esophagus | ESCC | 5.67e-03 | 1.25e-01 | 0.0811 |
| 89890 | KBTBD6 | P2T-E | Human | Esophagus | ESCC | 3.64e-10 | 2.46e-01 | 0.1177 |
| 89890 | KBTBD6 | P4T-E | Human | Esophagus | ESCC | 4.13e-08 | 1.60e-01 | 0.1323 |
| 89890 | KBTBD6 | P8T-E | Human | Esophagus | ESCC | 1.76e-02 | 1.12e-01 | 0.0889 |
| 89890 | KBTBD6 | P9T-E | Human | Esophagus | ESCC | 2.62e-07 | 1.53e-01 | 0.1131 |
| 89890 | KBTBD6 | P10T-E | Human | Esophagus | ESCC | 1.05e-11 | 2.68e-01 | 0.116 |
| 89890 | KBTBD6 | P12T-E | Human | Esophagus | ESCC | 4.54e-07 | 9.85e-02 | 0.1122 |
| 89890 | KBTBD6 | P15T-E | Human | Esophagus | ESCC | 5.66e-13 | 2.09e-01 | 0.1149 |
| 89890 | KBTBD6 | P16T-E | Human | Esophagus | ESCC | 4.64e-15 | 1.96e-01 | 0.1153 |
| 89890 | KBTBD6 | P21T-E | Human | Esophagus | ESCC | 7.73e-05 | 7.69e-02 | 0.1617 |
| 89890 | KBTBD6 | P22T-E | Human | Esophagus | ESCC | 4.35e-02 | 6.45e-02 | 0.1236 |
| 89890 | KBTBD6 | P23T-E | Human | Esophagus | ESCC | 5.21e-08 | 1.47e-01 | 0.108 |
| 89890 | KBTBD6 | P24T-E | Human | Esophagus | ESCC | 5.56e-04 | 1.46e-01 | 0.1287 |
| 89890 | KBTBD6 | P26T-E | Human | Esophagus | ESCC | 8.52e-13 | 3.13e-01 | 0.1276 |
| 89890 | KBTBD6 | P27T-E | Human | Esophagus | ESCC | 3.39e-08 | 1.42e-01 | 0.1055 |
| 89890 | KBTBD6 | P28T-E | Human | Esophagus | ESCC | 2.61e-17 | 3.52e-01 | 0.1149 |
| 89890 | KBTBD6 | P30T-E | Human | Esophagus | ESCC | 2.19e-05 | 3.39e-01 | 0.137 |
| 89890 | KBTBD6 | P32T-E | Human | Esophagus | ESCC | 2.94e-02 | 9.10e-02 | 0.1666 |
| 89890 | KBTBD6 | P36T-E | Human | Esophagus | ESCC | 5.72e-06 | 1.82e-01 | 0.1187 |
| 89890 | KBTBD6 | P37T-E | Human | Esophagus | ESCC | 4.06e-06 | 1.53e-01 | 0.1371 |
| Page: 1 2 3 |
| Tissue | Expression Dynamics | Abbreviation |
| Esophagus |  | ESCC: Esophageal squamous cell carcinoma |
| HGIN: High-grade intraepithelial neoplasias | ||
| LGIN: Low-grade intraepithelial neoplasias | ||
| Liver | 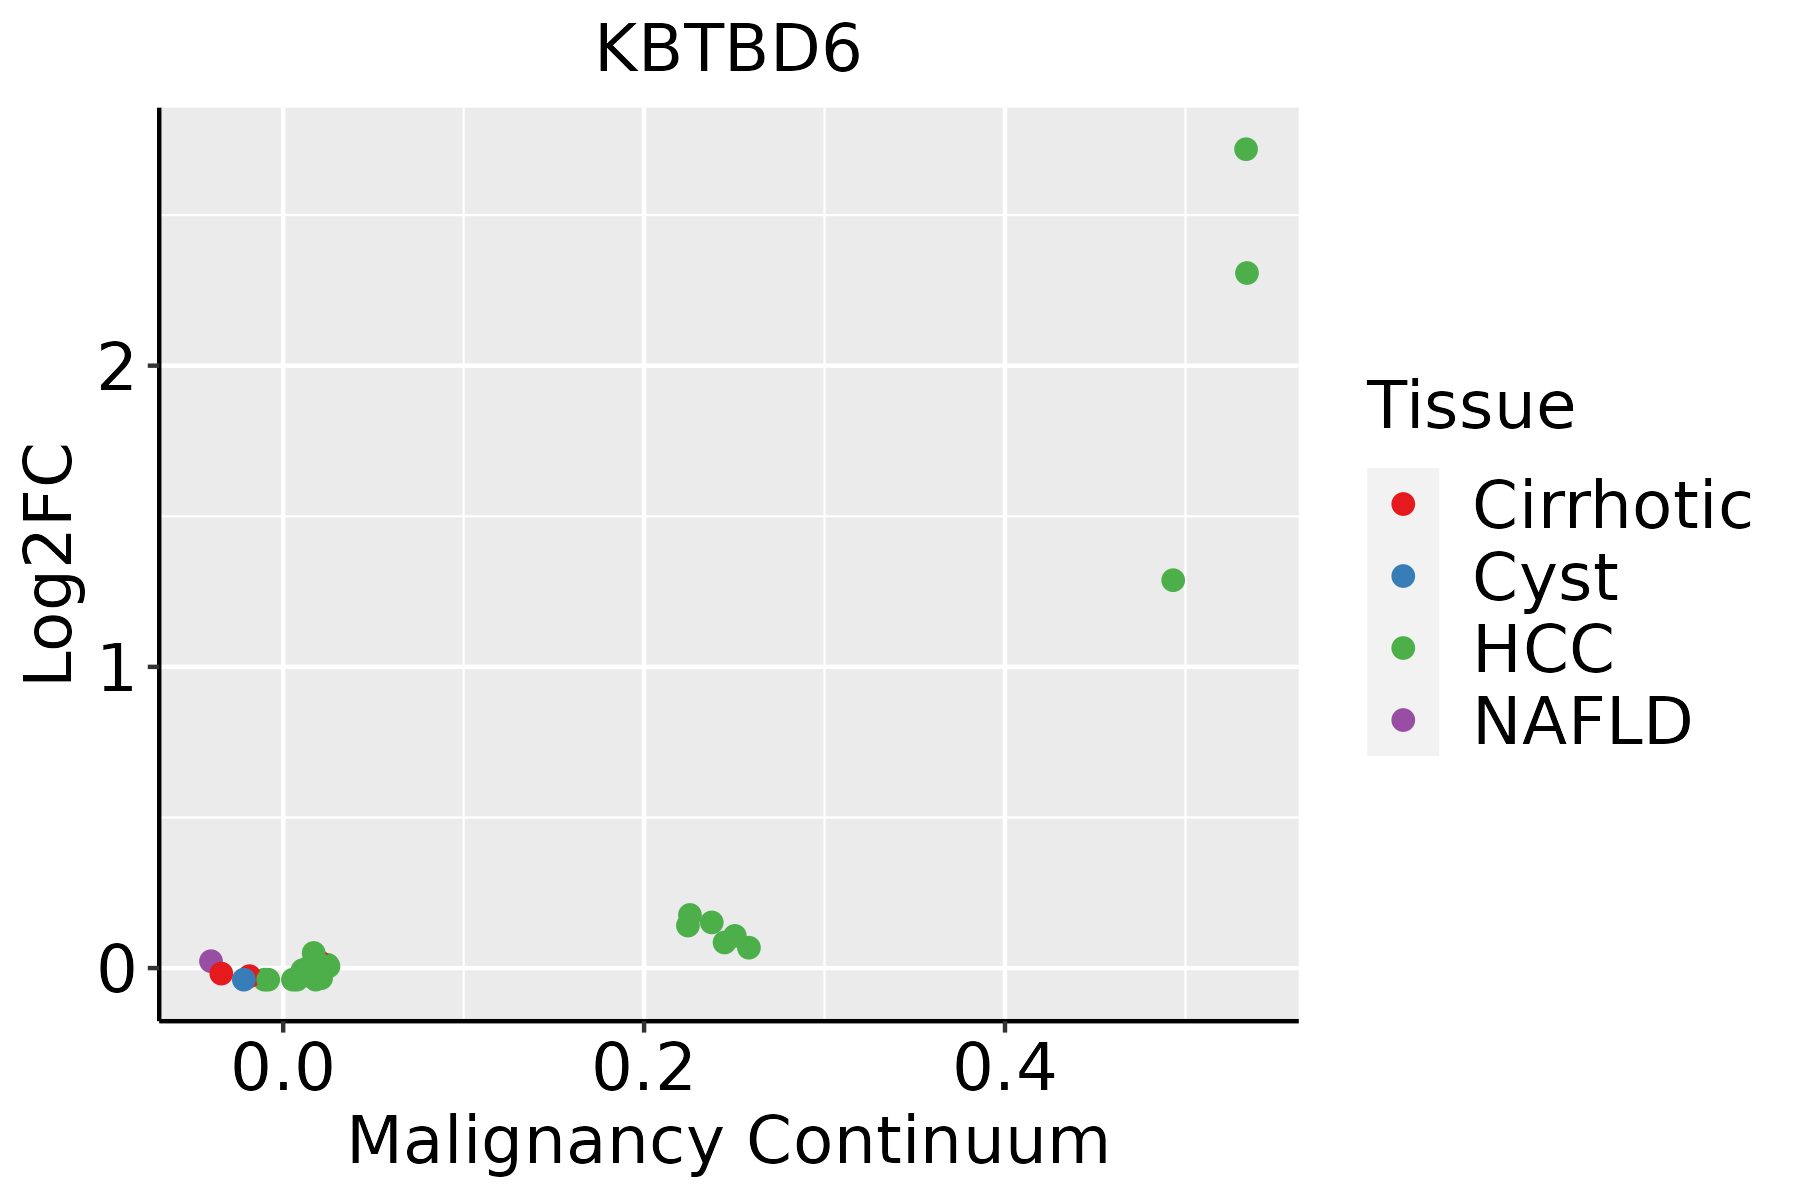 | HCC: Hepatocellular carcinoma |
| NAFLD: Non-alcoholic fatty liver disease |
| ∗log2FC in expression of this searched gene in stem-like cells from each diseased tissue sample relative to stem-like cells in normal samples in each tissue plotted against the malignancy continuum. Samples are colored based on if they are from different disease stage. |
Top |
Malignant transformation related pathway analysis |
| Find out the enriched GO biological processes and KEGG pathways involved in transition from healthy to precancer to cancer |
| Tissue | Disease Stage | Enriched GO biological Processes |
| Colorectum | AD |  |
| Colorectum | SER |  |
| Colorectum | MSS |  |
| Colorectum | MSI-H |  |
| Colorectum | FAP |  |
| ∗Top 15 enriched GO BP terms are showed in the bar plot of each disease state in each tissue. Each row represents a significant GO biological process which is colored according to the -log10(p.adjust). |
| Page: 1 2 3 4 5 6 7 8 9 |
| GO ID | Tissue | Disease Stage | Description | Gene Ratio | Bg Ratio | pvalue | p.adjust | Count |
| GO:0010498111 | Esophagus | ESCC | proteasomal protein catabolic process | 369/8552 | 490/18723 | 1.13e-41 | 1.80e-38 | 369 |
| GO:0043161111 | Esophagus | ESCC | proteasome-mediated ubiquitin-dependent protein catabolic process | 312/8552 | 412/18723 | 3.53e-36 | 4.48e-33 | 312 |
| GO:0035966111 | Esophagus | ESCC | response to topologically incorrect protein | 125/8552 | 159/18723 | 1.44e-17 | 1.27e-15 | 125 |
| GO:000020917 | Esophagus | ESCC | protein polyubiquitination | 170/8552 | 236/18723 | 1.40e-16 | 1.09e-14 | 170 |
| GO:0006986111 | Esophagus | ESCC | response to unfolded protein | 107/8552 | 137/18723 | 7.01e-15 | 3.87e-13 | 107 |
| GO:007093617 | Esophagus | ESCC | protein K48-linked ubiquitination | 55/8552 | 65/18723 | 8.42e-11 | 2.58e-09 | 55 |
| GO:000726510 | Esophagus | ESCC | Ras protein signal transduction | 201/8552 | 337/18723 | 1.44e-07 | 2.30e-06 | 201 |
| GO:00166019 | Esophagus | ESCC | Rac protein signal transduction | 33/8552 | 42/18723 | 1.35e-05 | 1.23e-04 | 33 |
| GO:0035020 | Esophagus | ESCC | regulation of Rac protein signal transduction | 17/8552 | 21/18723 | 1.03e-03 | 5.19e-03 | 17 |
| GO:00465789 | Esophagus | ESCC | regulation of Ras protein signal transduction | 106/8552 | 189/18723 | 2.49e-03 | 1.08e-02 | 106 |
| GO:005105610 | Esophagus | ESCC | regulation of small GTPase mediated signal transduction | 157/8552 | 302/18723 | 1.55e-02 | 4.98e-02 | 157 |
| GO:001049822 | Liver | HCC | proteasomal protein catabolic process | 351/7958 | 490/18723 | 6.92e-40 | 1.46e-36 | 351 |
| GO:004316122 | Liver | HCC | proteasome-mediated ubiquitin-dependent protein catabolic process | 299/7958 | 412/18723 | 7.82e-36 | 8.27e-33 | 299 |
| GO:003596612 | Liver | HCC | response to topologically incorrect protein | 123/7958 | 159/18723 | 2.60e-19 | 3.44e-17 | 123 |
| GO:000698612 | Liver | HCC | response to unfolded protein | 103/7958 | 137/18723 | 6.50e-15 | 4.48e-13 | 103 |
| GO:000020921 | Liver | HCC | protein polyubiquitination | 151/7958 | 236/18723 | 1.90e-11 | 7.59e-10 | 151 |
| GO:007093621 | Liver | HCC | protein K48-linked ubiquitination | 52/7958 | 65/18723 | 6.70e-10 | 2.11e-08 | 52 |
| GO:000726521 | Liver | HCC | Ras protein signal transduction | 187/7958 | 337/18723 | 8.89e-07 | 1.35e-05 | 187 |
| GO:001660121 | Liver | HCC | Rac protein signal transduction | 28/7958 | 42/18723 | 1.35e-03 | 7.26e-03 | 28 |
| GO:004657811 | Liver | HCC | regulation of Ras protein signal transduction | 100/7958 | 189/18723 | 2.42e-03 | 1.18e-02 | 100 |
| Page: 1 |
| Pathway ID | Tissue | Disease Stage | Description | Gene Ratio | Bg Ratio | pvalue | p.adjust | qvalue | Count |
| Page: 1 |
Top |
Cell-cell communication analysis |
| Identification of potential cell-cell interactions between two cell types and their ligand-receptor pairs for different disease states |
| Ligand | Receptor | LRpair | Pathway | Tissue | Disease Stage |
| Page: 1 |
Top |
Single-cell gene regulatory network inference analysis |
| Find out the significant the regulons (TFs) and the target genes of each regulon across cell types for different disease states |
| TF | Cell Type | Tissue | Disease Stage | Target Gene | RSS | Regulon Activity |
| ∗The dot plots of a searched regulon are shown for all cell subpopulations in each disease state of each tissue based on the regulon specific score inferred using pySCENIC and by calculating the average expression. |
| Page: 1 |
Top |
Somatic mutation of malignant transformation related genes |
| Annotation of somatic variants for genes involved in malignant transformation |
| Hugo Symbol | Variant Class | Variant Classification | dbSNP RS | HGVSc | HGVSp | HGVSp Short | SWISSPROT | BIOTYPE | SIFT | PolyPhen | Tumor Sample Barcode | Tissue | Histology | Sex | Age | Stage | Therapy Types | Drugs | Outcome |
| KBTBD6 | SNV | Missense_Mutation | c.1382N>T | p.Arg461Ile | p.R461I | Q86V97 | protein_coding | deleterious(0.01) | probably_damaging(0.953) | TCGA-AN-A046-01 | Breast | breast invasive carcinoma | Female | >=65 | I/II | Unknown | Unknown | SD | |
| KBTBD6 | SNV | Missense_Mutation | c.1891A>G | p.Thr631Ala | p.T631A | Q86V97 | protein_coding | tolerated_low_confidence(0.16) | benign(0.031) | TCGA-AO-A128-01 | Breast | breast invasive carcinoma | Female | <65 | I/II | Chemotherapy | doxorubicin | SD | |
| KBTBD6 | SNV | Missense_Mutation | c.1945N>A | p.Phe649Ile | p.F649I | Q86V97 | protein_coding | tolerated_low_confidence(0.14) | benign(0.058) | TCGA-D8-A1XK-01 | Breast | breast invasive carcinoma | Female | <65 | I/II | Chemotherapy | doxorubicine+cyclophosphamide | SD | |
| KBTBD6 | insertion | Frame_Shift_Ins | novel | c.901_902insATTA | p.Met301AsnfsTer6 | p.M301Nfs*6 | Q86V97 | protein_coding | TCGA-A8-A07R-01 | Breast | breast invasive carcinoma | Female | >=65 | III/IV | Ancillary | zoledronic | SD | ||
| KBTBD6 | insertion | Frame_Shift_Ins | rs774820321 | c.1326_1327insG | p.Arg443AlafsTer8 | p.R443Afs*8 | Q86V97 | protein_coding | TCGA-A8-A097-01 | Breast | breast invasive carcinoma | Female | >=65 | I/II | Hormone Therapy | tamoxiphen | SD | ||
| KBTBD6 | insertion | Frame_Shift_Ins | rs774820321 | c.1326_1327insG | p.Arg443AlafsTer8 | p.R443Afs*8 | Q86V97 | protein_coding | TCGA-AR-A0TY-01 | Breast | breast invasive carcinoma | Female | <65 | I/II | Unspecific | Paclitaxel | PD | ||
| KBTBD6 | deletion | Frame_Shift_Del | novel | c.398delN | p.Arg133LeufsTer32 | p.R133Lfs*32 | Q86V97 | protein_coding | TCGA-EW-A2FV-01 | Breast | breast invasive carcinoma | Female | <65 | III/IV | Chemotherapy | docetaxel | SD | ||
| KBTBD6 | SNV | Missense_Mutation | novel | c.566G>A | p.Arg189Gln | p.R189Q | Q86V97 | protein_coding | tolerated(0.06) | probably_damaging(0.916) | TCGA-2W-A8YY-01 | Cervix | cervical & endocervical cancer | Female | <65 | I/II | Chemotherapy | cisplatin | CR |
| KBTBD6 | SNV | Missense_Mutation | novel | c.49C>T | p.Arg17Cys | p.R17C | Q86V97 | protein_coding | deleterious_low_confidence(0) | possibly_damaging(0.869) | TCGA-2W-A8YY-01 | Cervix | cervical & endocervical cancer | Female | <65 | I/II | Chemotherapy | cisplatin | CR |
| KBTBD6 | insertion | Frame_Shift_Ins | novel | c.1837dupT | p.Cys613LeufsTer12 | p.C613Lfs*12 | Q86V97 | protein_coding | TCGA-2W-A8YY-01 | Cervix | cervical & endocervical cancer | Female | <65 | I/II | Chemotherapy | cisplatin | CR |
| Page: 1 2 3 4 5 6 7 8 9 10 |
Top |
Related drugs of malignant transformation related genes |
| Identification of chemicals and drugs interact with genes involved in malignant transfromation |
| (DGIdb 4.0) |
| Entrez ID | Symbol | Category | Interaction Types | Drug Claim Name | Drug Name | PMIDs |
| Page: 1 |

Copyright 2023-Present -The University of Texas Health Science Center at Houston |