
|
|||||
|
 | |
| |
| |
| |
| |
| |
|
Gene: KBTBD2 |
Gene summary for KBTBD2 |
| Gene information | Species | Human | Gene symbol | KBTBD2 | Gene ID | 25948 |
| Gene name | kelch repeat and BTB domain containing 2 | |
| Gene Alias | BKLHD1 | |
| Cytomap | 7p14.3 | |
| Gene Type | protein-coding | GO ID | GO:0005975 | UniProtAcc | A0A024RA38 |
Top |
Malignant transformation analysis |
| Identification of the aberrant gene expression in precancerous and cancerous lesions by comparing the gene expression of stem-like cells in diseased tissues with normal stem cells |
| Entrez ID | Symbol | Replicates | Species | Organ | Tissue | Adj P-value | Log2FC | Malignancy |
| 25948 | KBTBD2 | LZE4T | Human | Esophagus | ESCC | 8.85e-08 | 7.17e-02 | 0.0811 |
| 25948 | KBTBD2 | LZE7T | Human | Esophagus | ESCC | 1.56e-06 | 1.57e-01 | 0.0667 |
| 25948 | KBTBD2 | LZE8T | Human | Esophagus | ESCC | 3.09e-07 | 2.90e-02 | 0.067 |
| 25948 | KBTBD2 | LZE20T | Human | Esophagus | ESCC | 8.25e-06 | 7.95e-02 | 0.0662 |
| 25948 | KBTBD2 | LZE22D1 | Human | Esophagus | HGIN | 3.58e-02 | 2.22e-03 | 0.0595 |
| 25948 | KBTBD2 | LZE24T | Human | Esophagus | ESCC | 1.83e-13 | 1.69e-01 | 0.0596 |
| 25948 | KBTBD2 | LZE21T | Human | Esophagus | ESCC | 3.46e-02 | 2.17e-02 | 0.0655 |
| 25948 | KBTBD2 | LZE6T | Human | Esophagus | ESCC | 1.00e-02 | 2.76e-02 | 0.0845 |
| 25948 | KBTBD2 | P1T-E | Human | Esophagus | ESCC | 4.19e-02 | 3.19e-01 | 0.0875 |
| 25948 | KBTBD2 | P2T-E | Human | Esophagus | ESCC | 9.62e-12 | 2.55e-01 | 0.1177 |
| 25948 | KBTBD2 | P4T-E | Human | Esophagus | ESCC | 4.89e-07 | 8.11e-02 | 0.1323 |
| 25948 | KBTBD2 | P8T-E | Human | Esophagus | ESCC | 1.40e-11 | 1.90e-01 | 0.0889 |
| 25948 | KBTBD2 | P9T-E | Human | Esophagus | ESCC | 1.22e-10 | 2.24e-01 | 0.1131 |
| 25948 | KBTBD2 | P10T-E | Human | Esophagus | ESCC | 1.01e-15 | 1.35e-01 | 0.116 |
| 25948 | KBTBD2 | P11T-E | Human | Esophagus | ESCC | 3.47e-14 | 3.30e-01 | 0.1426 |
| 25948 | KBTBD2 | P12T-E | Human | Esophagus | ESCC | 3.76e-05 | 1.11e-01 | 0.1122 |
| 25948 | KBTBD2 | P15T-E | Human | Esophagus | ESCC | 4.58e-17 | 3.16e-01 | 0.1149 |
| 25948 | KBTBD2 | P16T-E | Human | Esophagus | ESCC | 1.29e-13 | 1.24e-01 | 0.1153 |
| 25948 | KBTBD2 | P17T-E | Human | Esophagus | ESCC | 2.45e-05 | 2.27e-01 | 0.1278 |
| 25948 | KBTBD2 | P20T-E | Human | Esophagus | ESCC | 1.33e-07 | 2.95e-02 | 0.1124 |
| Page: 1 2 3 4 5 |
| Tissue | Expression Dynamics | Abbreviation |
| Esophagus | 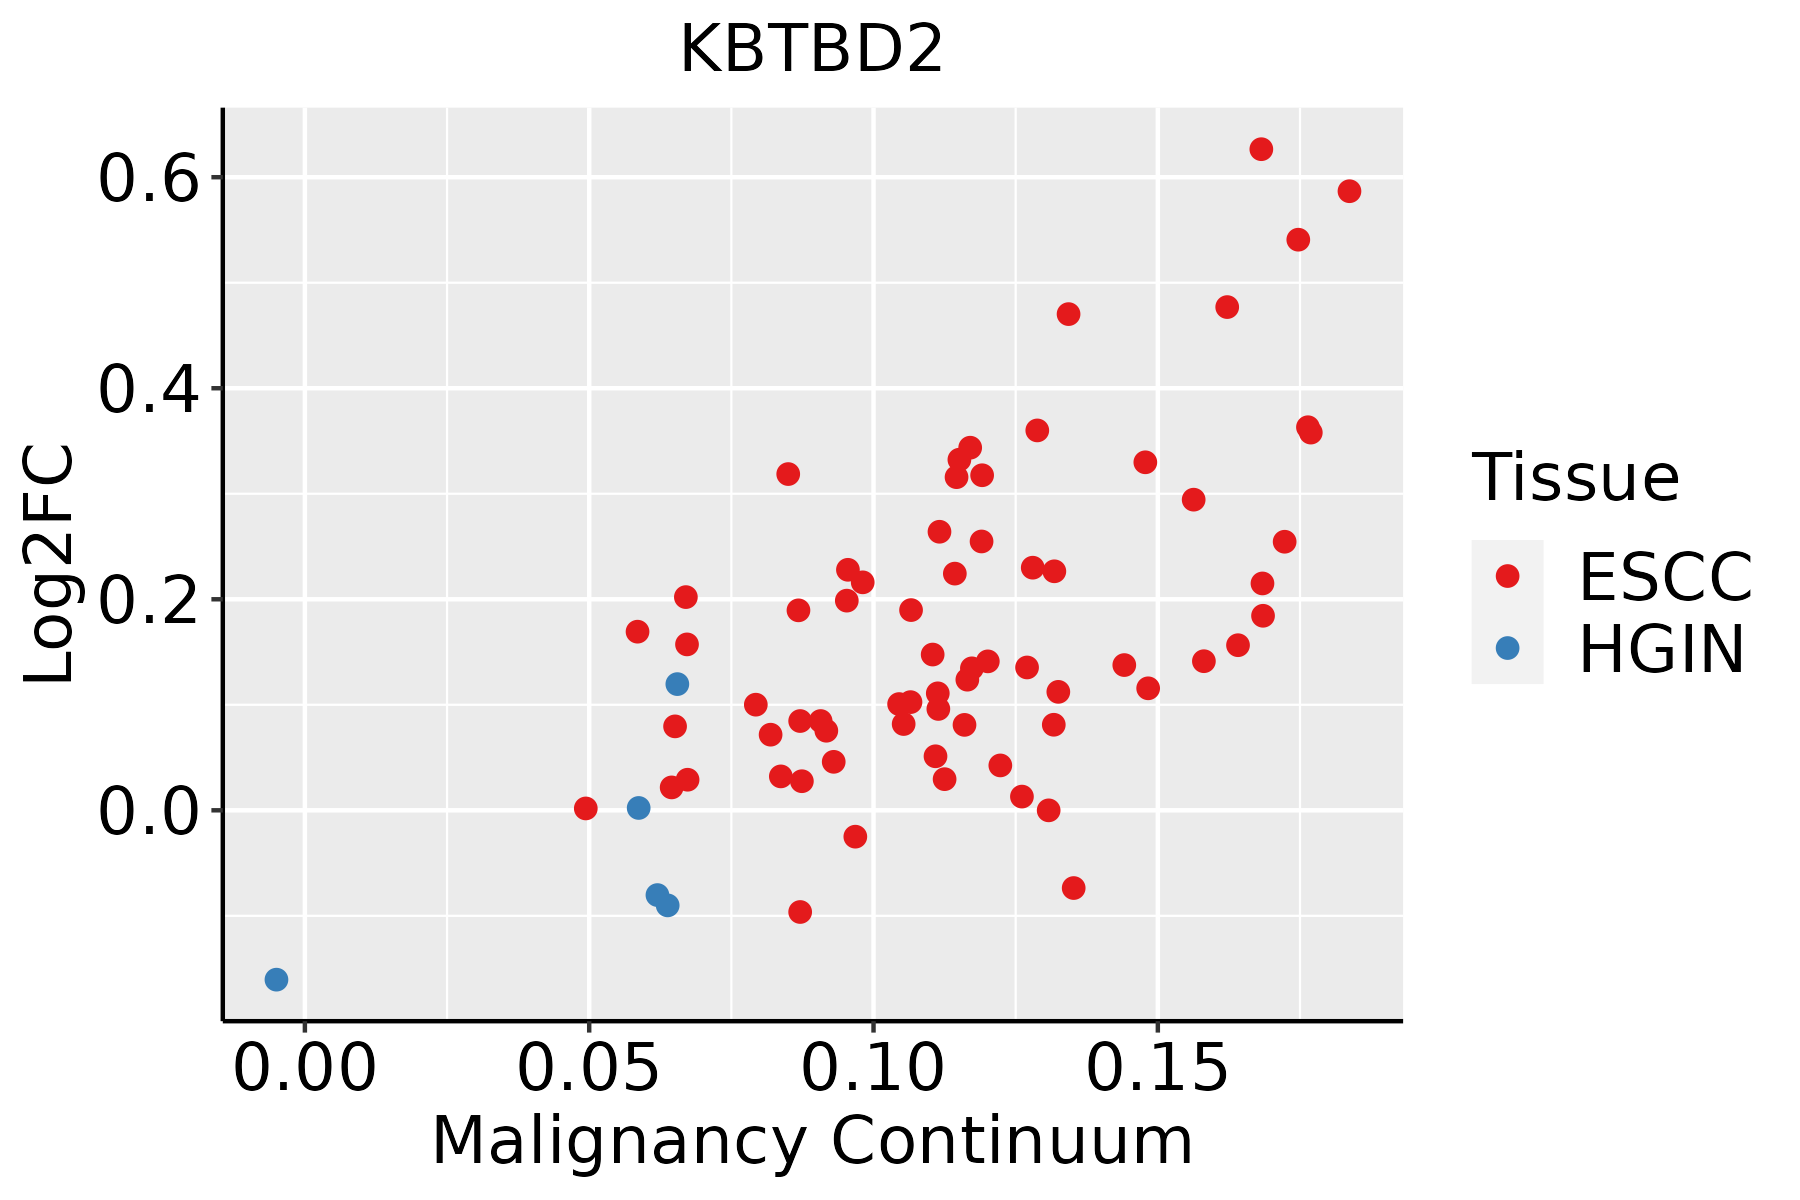 | ESCC: Esophageal squamous cell carcinoma |
| HGIN: High-grade intraepithelial neoplasias | ||
| LGIN: Low-grade intraepithelial neoplasias | ||
| Liver | 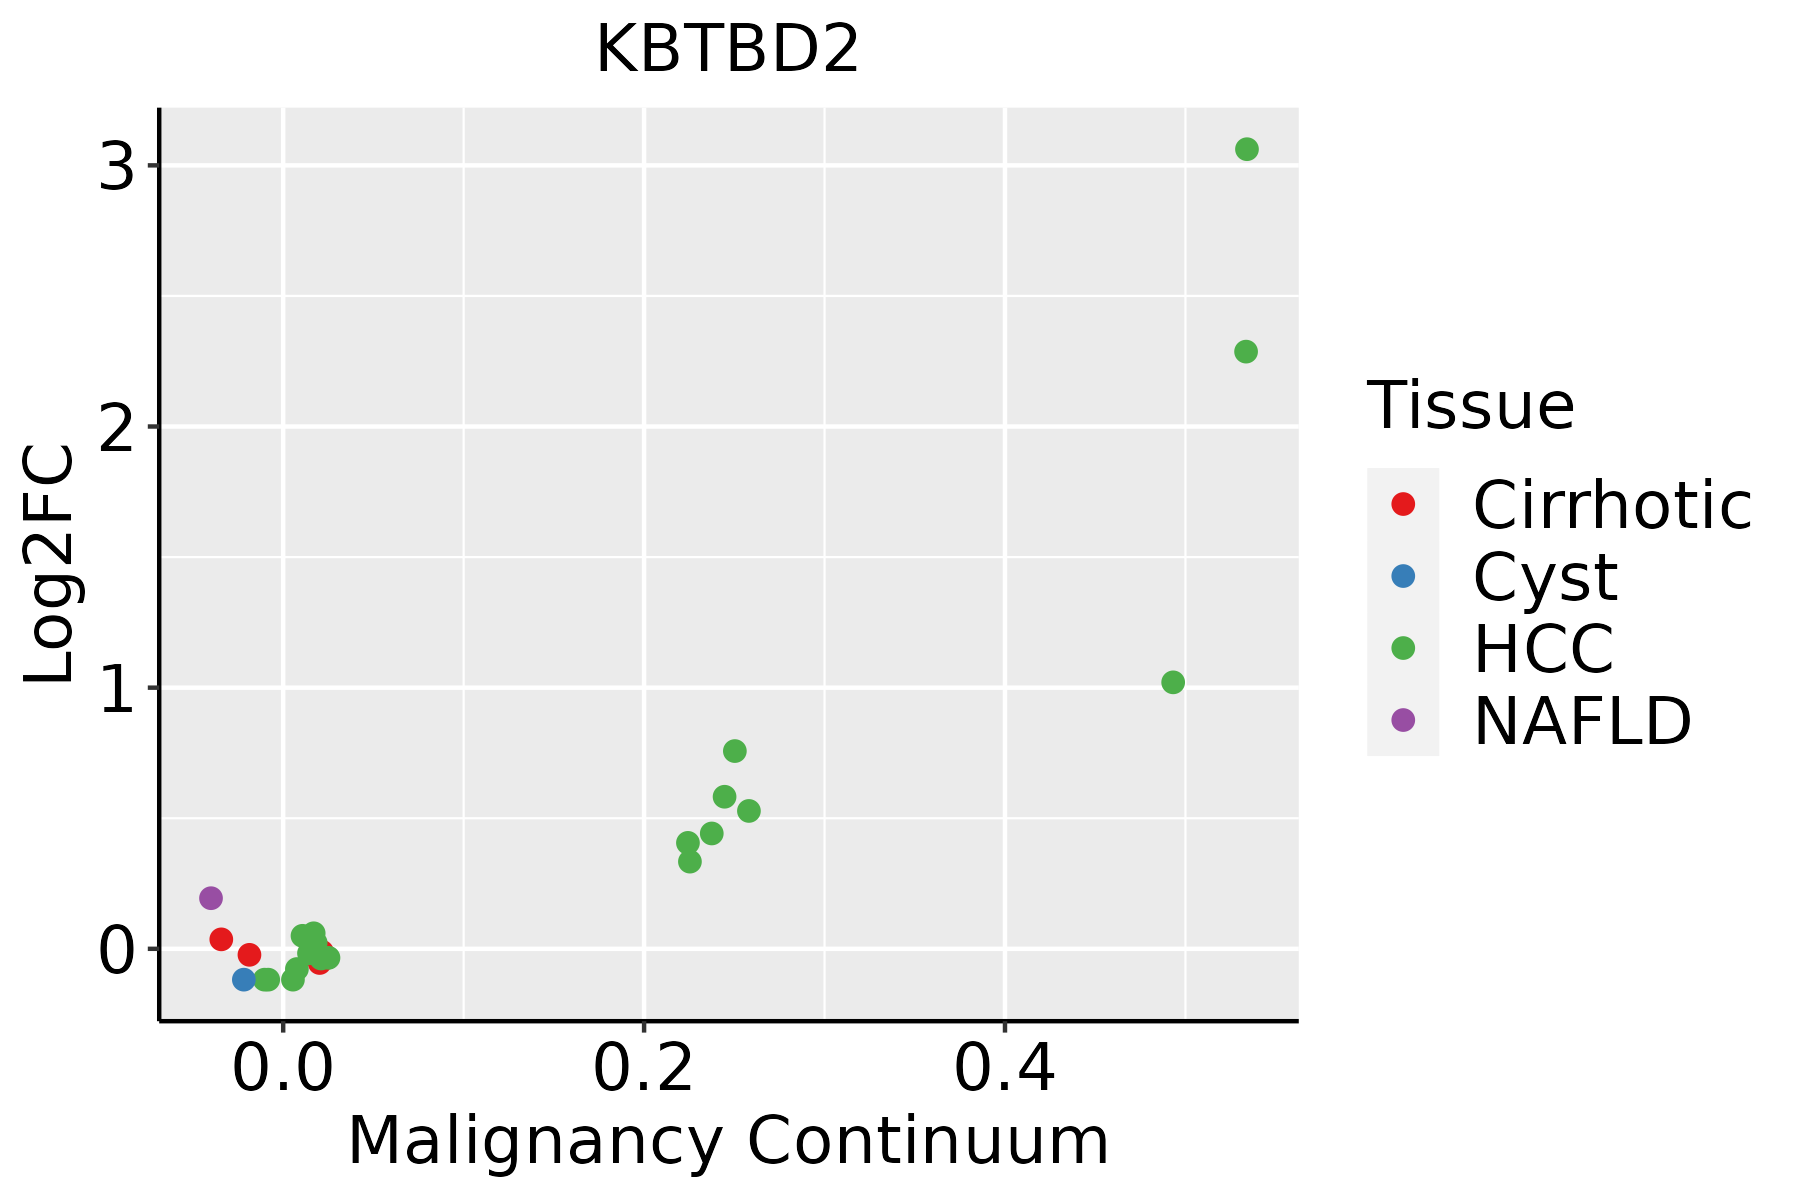 | HCC: Hepatocellular carcinoma |
| NAFLD: Non-alcoholic fatty liver disease | ||
| Oral Cavity |  | EOLP: Erosive Oral lichen planus |
| LP: leukoplakia | ||
| NEOLP: Non-erosive oral lichen planus | ||
| OSCC: Oral squamous cell carcinoma | ||
| Thyroid | 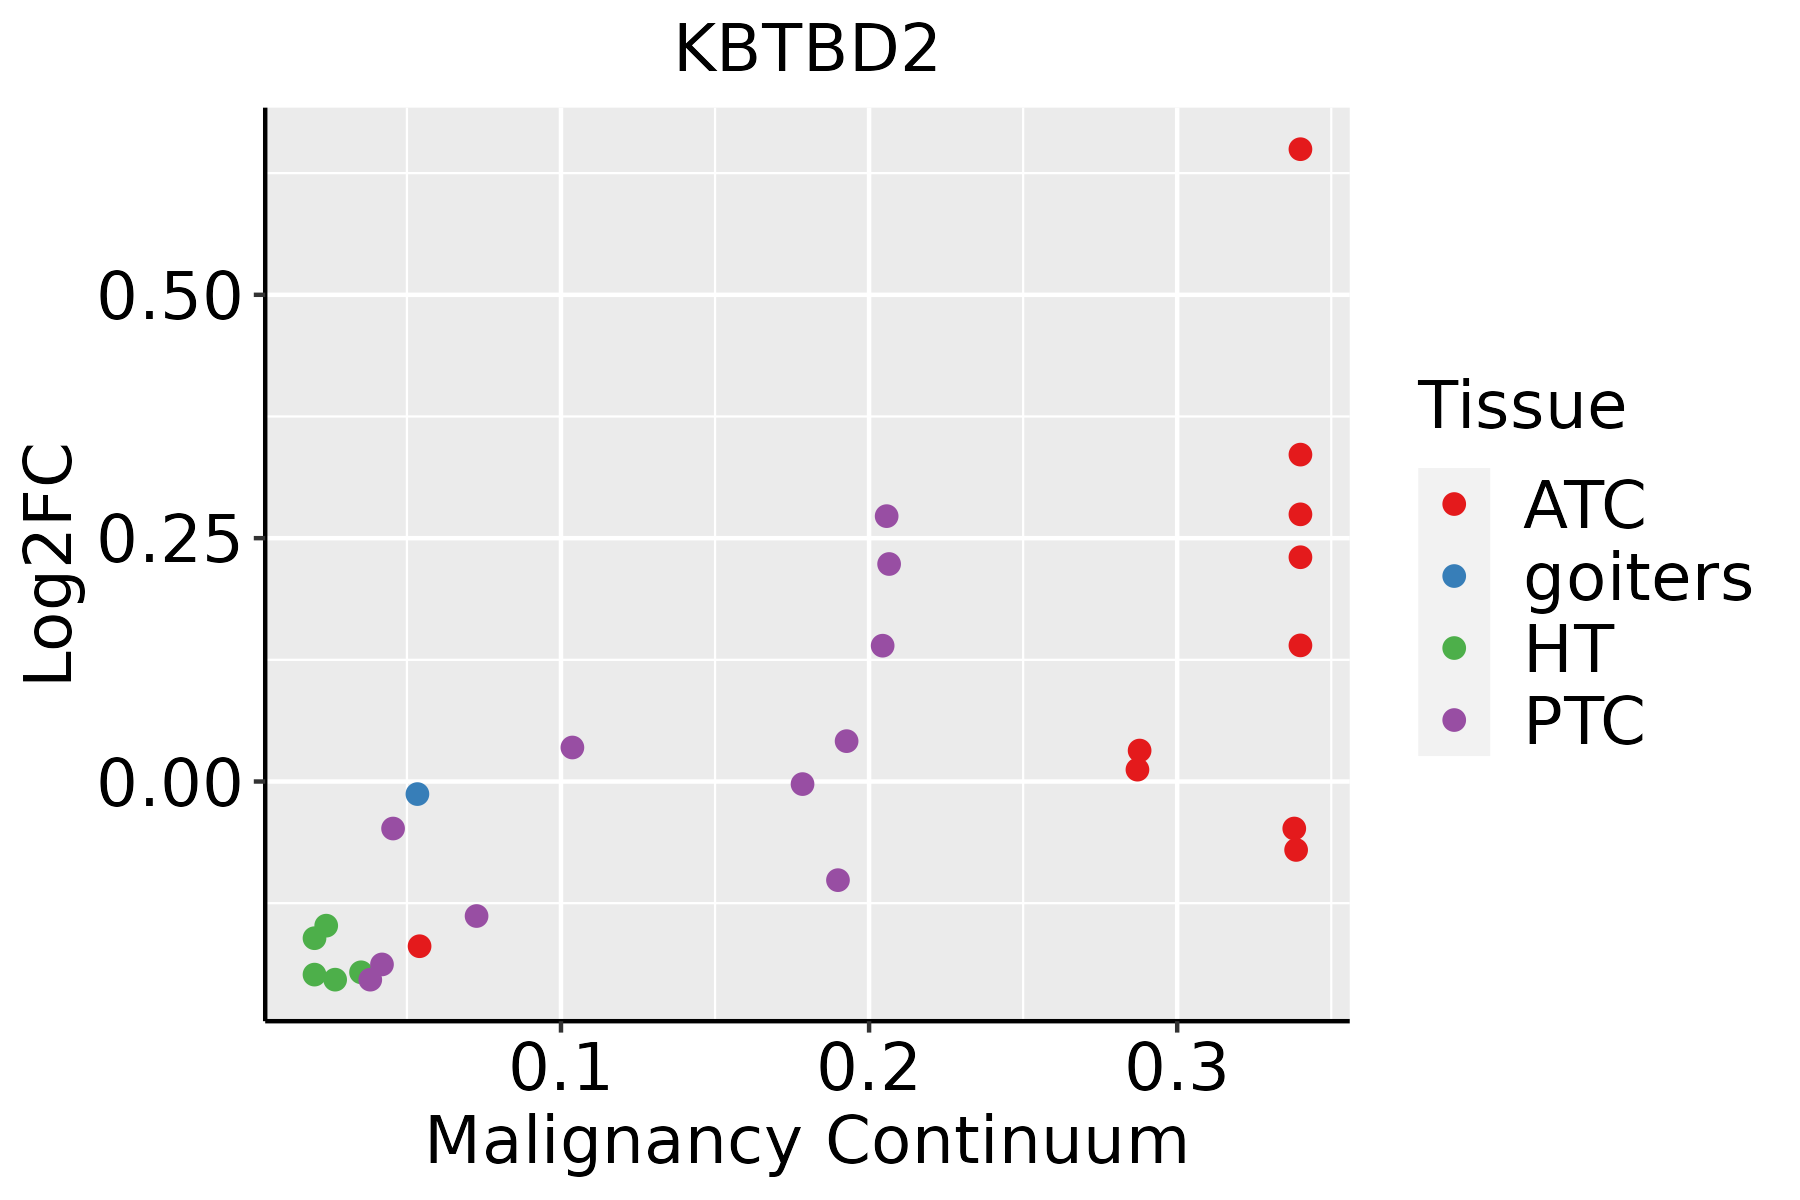 | ATC: Anaplastic thyroid cancer |
| HT: Hashimoto's thyroiditis | ||
| PTC: Papillary thyroid cancer |
| ∗log2FC in expression of this searched gene in stem-like cells from each diseased tissue sample relative to stem-like cells in normal samples in each tissue plotted against the malignancy continuum. Samples are colored based on if they are from different disease stage. |
Top |
Malignant transformation related pathway analysis |
| Find out the enriched GO biological processes and KEGG pathways involved in transition from healthy to precancer to cancer |
| Tissue | Disease Stage | Enriched GO biological Processes |
| Colorectum | AD |  |
| Colorectum | SER |  |
| Colorectum | MSS |  |
| Colorectum | MSI-H |  |
| Colorectum | FAP |  |
| ∗Top 15 enriched GO BP terms are showed in the bar plot of each disease state in each tissue. Each row represents a significant GO biological process which is colored according to the -log10(p.adjust). |
| Page: 1 2 3 4 5 6 7 8 9 |
| GO ID | Tissue | Disease Stage | Description | Gene Ratio | Bg Ratio | pvalue | p.adjust | Count |
| GO:004343420 | Esophagus | HGIN | response to peptide hormone | 79/2587 | 414/18723 | 1.60e-03 | 1.79e-02 | 79 |
| GO:00059969 | Esophagus | ESCC | monosaccharide metabolic process | 159/8552 | 257/18723 | 1.11e-07 | 1.81e-06 | 159 |
| GO:00193189 | Esophagus | ESCC | hexose metabolic process | 147/8552 | 237/18723 | 2.63e-07 | 3.94e-06 | 147 |
| GO:0043434111 | Esophagus | ESCC | response to peptide hormone | 234/8552 | 414/18723 | 4.93e-06 | 5.21e-05 | 234 |
| GO:003286818 | Esophagus | ESCC | response to insulin | 156/8552 | 264/18723 | 7.21e-06 | 7.20e-05 | 156 |
| GO:00060069 | Esophagus | ESCC | glucose metabolic process | 119/8552 | 196/18723 | 1.51e-05 | 1.36e-04 | 119 |
| GO:003286821 | Liver | HCC | response to insulin | 172/7958 | 264/18723 | 7.14e-14 | 4.23e-12 | 172 |
| GO:000599621 | Liver | HCC | monosaccharide metabolic process | 167/7958 | 257/18723 | 2.31e-13 | 1.25e-11 | 167 |
| GO:001931821 | Liver | HCC | hexose metabolic process | 155/7958 | 237/18723 | 7.63e-13 | 3.90e-11 | 155 |
| GO:004343422 | Liver | HCC | response to peptide hormone | 247/7958 | 414/18723 | 9.55e-13 | 4.77e-11 | 247 |
| GO:000600621 | Liver | HCC | glucose metabolic process | 128/7958 | 196/18723 | 8.60e-11 | 3.06e-09 | 128 |
| GO:004343419 | Oral cavity | OSCC | response to peptide hormone | 208/7305 | 414/18723 | 1.83e-06 | 2.35e-05 | 208 |
| GO:003286816 | Oral cavity | OSCC | response to insulin | 138/7305 | 264/18723 | 7.54e-06 | 8.15e-05 | 138 |
| GO:00059968 | Oral cavity | OSCC | monosaccharide metabolic process | 129/7305 | 257/18723 | 1.63e-04 | 1.13e-03 | 129 |
| GO:00193188 | Oral cavity | OSCC | hexose metabolic process | 118/7305 | 237/18723 | 4.53e-04 | 2.73e-03 | 118 |
| GO:00060068 | Oral cavity | OSCC | glucose metabolic process | 98/7305 | 196/18723 | 1.10e-03 | 5.63e-03 | 98 |
| GO:0043434110 | Oral cavity | LP | response to peptide hormone | 138/4623 | 414/18723 | 4.00e-05 | 5.87e-04 | 138 |
| GO:000599613 | Oral cavity | LP | monosaccharide metabolic process | 86/4623 | 257/18723 | 9.13e-04 | 7.79e-03 | 86 |
| GO:003286817 | Oral cavity | LP | response to insulin | 88/4623 | 264/18723 | 9.19e-04 | 7.82e-03 | 88 |
| GO:001931813 | Oral cavity | LP | hexose metabolic process | 78/4623 | 237/18723 | 2.55e-03 | 1.80e-02 | 78 |
| Page: 1 2 |
| Pathway ID | Tissue | Disease Stage | Description | Gene Ratio | Bg Ratio | pvalue | p.adjust | qvalue | Count |
| Page: 1 |
Top |
Cell-cell communication analysis |
| Identification of potential cell-cell interactions between two cell types and their ligand-receptor pairs for different disease states |
| Ligand | Receptor | LRpair | Pathway | Tissue | Disease Stage |
| Page: 1 |
Top |
Single-cell gene regulatory network inference analysis |
| Find out the significant the regulons (TFs) and the target genes of each regulon across cell types for different disease states |
| TF | Cell Type | Tissue | Disease Stage | Target Gene | RSS | Regulon Activity |
| ∗The dot plots of a searched regulon are shown for all cell subpopulations in each disease state of each tissue based on the regulon specific score inferred using pySCENIC and by calculating the average expression. |
| Page: 1 |
Top |
Somatic mutation of malignant transformation related genes |
| Annotation of somatic variants for genes involved in malignant transformation |
| Hugo Symbol | Variant Class | Variant Classification | dbSNP RS | HGVSc | HGVSp | HGVSp Short | SWISSPROT | BIOTYPE | SIFT | PolyPhen | Tumor Sample Barcode | Tissue | Histology | Sex | Age | Stage | Therapy Types | Drugs | Outcome |
| KBTBD2 | SNV | Missense_Mutation | c.574N>A | p.Glu192Lys | p.E192K | Q8IY47 | protein_coding | deleterious(0.01) | probably_damaging(0.989) | TCGA-C8-A275-01 | Breast | breast invasive carcinoma | Female | <65 | I/II | Unknown | Unknown | SD | |
| KBTBD2 | SNV | Missense_Mutation | c.1834G>C | p.Glu612Gln | p.E612Q | Q8IY47 | protein_coding | tolerated_low_confidence(0.09) | benign(0.354) | TCGA-D8-A1J8-01 | Breast | breast invasive carcinoma | Female | >=65 | I/II | Hormone Therapy | nolvadex | SD | |
| KBTBD2 | insertion | In_Frame_Ins | novel | c.594_595insCCATGGAAACCACCA | p.Ala198_Met199insProTrpLysProPro | p.A198_M199insPWKPP | Q8IY47 | protein_coding | TCGA-BH-A0HK-01 | Breast | breast invasive carcinoma | Female | >=65 | I/II | Hormone Therapy | arimidex | SD | ||
| KBTBD2 | insertion | In_Frame_Ins | novel | c.592_593insAAGAGT | p.Ala198delinsGluGluSer | p.A198delinsEES | Q8IY47 | protein_coding | TCGA-BH-A0HK-01 | Breast | breast invasive carcinoma | Female | >=65 | I/II | Hormone Therapy | arimidex | SD | ||
| KBTBD2 | SNV | Missense_Mutation | rs765986162 | c.1168G>A | p.Val390Ile | p.V390I | Q8IY47 | protein_coding | tolerated(0.33) | benign(0.098) | TCGA-2W-A8YY-01 | Cervix | cervical & endocervical cancer | Female | <65 | I/II | Chemotherapy | cisplatin | CR |
| KBTBD2 | SNV | Missense_Mutation | novel | c.660N>G | p.Ile220Met | p.I220M | Q8IY47 | protein_coding | deleterious(0) | benign(0.279) | TCGA-C5-A901-01 | Cervix | cervical & endocervical cancer | Female | <65 | I/II | Unknown | Unknown | SD |
| KBTBD2 | SNV | Missense_Mutation | c.183N>A | p.Met61Ile | p.M61I | Q8IY47 | protein_coding | tolerated(0.15) | probably_damaging(0.932) | TCGA-DG-A2KM-01 | Cervix | cervical & endocervical cancer | Female | <65 | I/II | Chemotherapy | cisplatin | SD | |
| KBTBD2 | SNV | Missense_Mutation | rs756027234 | c.580G>A | p.Val194Ile | p.V194I | Q8IY47 | protein_coding | deleterious(0) | probably_damaging(0.984) | TCGA-AA-3710-01 | Colorectum | colon adenocarcinoma | Female | >=65 | I/II | Unknown | Unknown | SD |
| KBTBD2 | SNV | Missense_Mutation | c.1293T>G | p.Ile431Met | p.I431M | Q8IY47 | protein_coding | deleterious(0) | possibly_damaging(0.655) | TCGA-CA-6717-01 | Colorectum | colon adenocarcinoma | Male | <65 | I/II | Chemotherapy | oxaliplatin | CR | |
| KBTBD2 | SNV | Missense_Mutation | c.1261T>C | p.Trp421Arg | p.W421R | Q8IY47 | protein_coding | tolerated(0.07) | probably_damaging(0.99) | TCGA-G4-6588-01 | Colorectum | colon adenocarcinoma | Female | <65 | I/II | Unknown | Unknown | SD |
| Page: 1 2 3 4 5 6 7 |
Top |
Related drugs of malignant transformation related genes |
| Identification of chemicals and drugs interact with genes involved in malignant transfromation |
| (DGIdb 4.0) |
| Entrez ID | Symbol | Category | Interaction Types | Drug Claim Name | Drug Name | PMIDs |
| Page: 1 |

Copyright 2023-Present -The University of Texas Health Science Center at Houston |