
|
|||||
|
 | |
| |
| |
| |
| |
| |
|
Gene: KATNBL1 |
Gene summary for KATNBL1 |
| Gene information | Species | Human | Gene symbol | KATNBL1 | Gene ID | 79768 |
| Gene name | katanin regulatory subunit B1 like 1 | |
| Gene Alias | C15orf29 | |
| Cytomap | 15q14 | |
| Gene Type | protein-coding | GO ID | GO:0006996 | UniProtAcc | A0A024R9P5 |
Top |
Malignant transformation analysis |
| Identification of the aberrant gene expression in precancerous and cancerous lesions by comparing the gene expression of stem-like cells in diseased tissues with normal stem cells |
| Entrez ID | Symbol | Replicates | Species | Organ | Tissue | Adj P-value | Log2FC | Malignancy |
| 79768 | KATNBL1 | HTA11_3410_2000001011 | Human | Colorectum | AD | 4.68e-09 | -4.97e-01 | 0.0155 |
| 79768 | KATNBL1 | HTA11_696_2000001011 | Human | Colorectum | AD | 1.24e-03 | -2.95e-01 | -0.1464 |
| 79768 | KATNBL1 | HTA11_866_3004761011 | Human | Colorectum | AD | 5.85e-04 | -3.96e-01 | 0.096 |
| 79768 | KATNBL1 | HTA11_7696_3000711011 | Human | Colorectum | AD | 1.22e-04 | -3.53e-01 | 0.0674 |
| 79768 | KATNBL1 | HTA11_99999970781_79442 | Human | Colorectum | MSS | 1.12e-12 | -4.18e-01 | 0.294 |
| 79768 | KATNBL1 | HTA11_99999971662_82457 | Human | Colorectum | MSS | 2.23e-15 | -4.73e-01 | 0.3859 |
| 79768 | KATNBL1 | HTA11_99999973899_84307 | Human | Colorectum | MSS | 4.77e-03 | -5.35e-01 | 0.2585 |
| 79768 | KATNBL1 | HTA11_99999974143_84620 | Human | Colorectum | MSS | 6.95e-11 | -4.40e-01 | 0.3005 |
| 79768 | KATNBL1 | F007 | Human | Colorectum | FAP | 1.04e-02 | -3.88e-01 | 0.1176 |
| 79768 | KATNBL1 | A015-C-203 | Human | Colorectum | FAP | 2.16e-27 | -4.40e-01 | -0.1294 |
| 79768 | KATNBL1 | A015-C-204 | Human | Colorectum | FAP | 3.14e-02 | -2.65e-01 | -0.0228 |
| 79768 | KATNBL1 | A002-C-201 | Human | Colorectum | FAP | 4.64e-09 | -3.09e-01 | 0.0324 |
| 79768 | KATNBL1 | A002-C-203 | Human | Colorectum | FAP | 2.58e-03 | -2.23e-01 | 0.2786 |
| 79768 | KATNBL1 | A001-C-119 | Human | Colorectum | FAP | 1.96e-04 | -3.40e-01 | -0.1557 |
| 79768 | KATNBL1 | A001-C-108 | Human | Colorectum | FAP | 2.07e-15 | -2.92e-01 | -0.0272 |
| 79768 | KATNBL1 | A002-C-205 | Human | Colorectum | FAP | 5.97e-17 | -4.54e-01 | -0.1236 |
| 79768 | KATNBL1 | A001-C-104 | Human | Colorectum | FAP | 2.15e-02 | -2.07e-01 | 0.0184 |
| 79768 | KATNBL1 | A015-C-006 | Human | Colorectum | FAP | 5.60e-12 | -4.87e-01 | -0.0994 |
| 79768 | KATNBL1 | A015-C-106 | Human | Colorectum | FAP | 7.80e-14 | -3.60e-01 | -0.0511 |
| 79768 | KATNBL1 | A002-C-114 | Human | Colorectum | FAP | 1.07e-11 | -3.74e-01 | -0.1561 |
| Page: 1 2 3 4 5 6 7 8 |
| Tissue | Expression Dynamics | Abbreviation |
| Colorectum (GSE201348) |  | FAP: Familial adenomatous polyposis |
| CRC: Colorectal cancer | ||
| Colorectum (HTA11) |  | AD: Adenomas |
| SER: Sessile serrated lesions | ||
| MSI-H: Microsatellite-high colorectal cancer | ||
| MSS: Microsatellite stable colorectal cancer | ||
| Esophagus |  | ESCC: Esophageal squamous cell carcinoma |
| HGIN: High-grade intraepithelial neoplasias | ||
| LGIN: Low-grade intraepithelial neoplasias | ||
| Oral Cavity |  | EOLP: Erosive Oral lichen planus |
| LP: leukoplakia | ||
| NEOLP: Non-erosive oral lichen planus | ||
| OSCC: Oral squamous cell carcinoma | ||
| Skin | 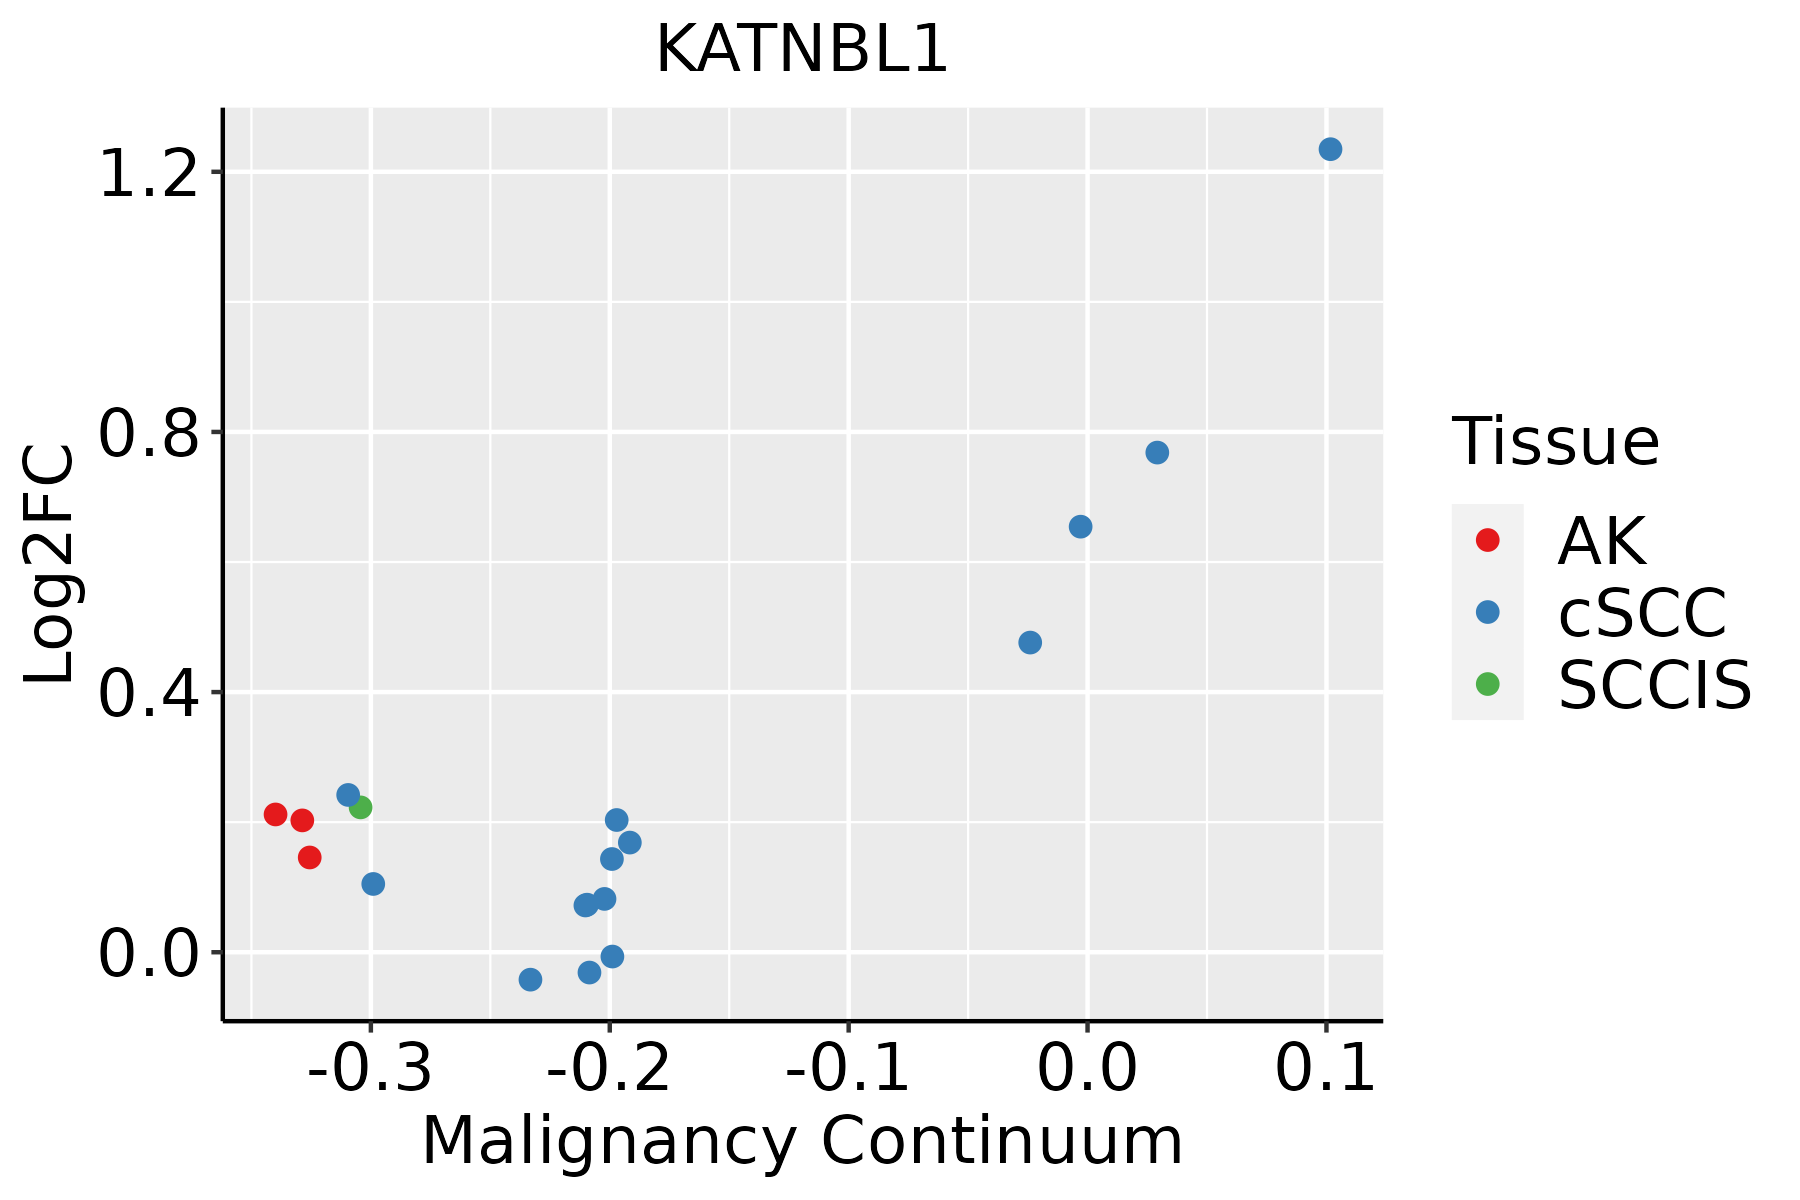 | AK: Actinic keratosis |
| cSCC: Cutaneous squamous cell carcinoma | ||
| SCCIS:squamous cell carcinoma in situ | ||
| Thyroid | 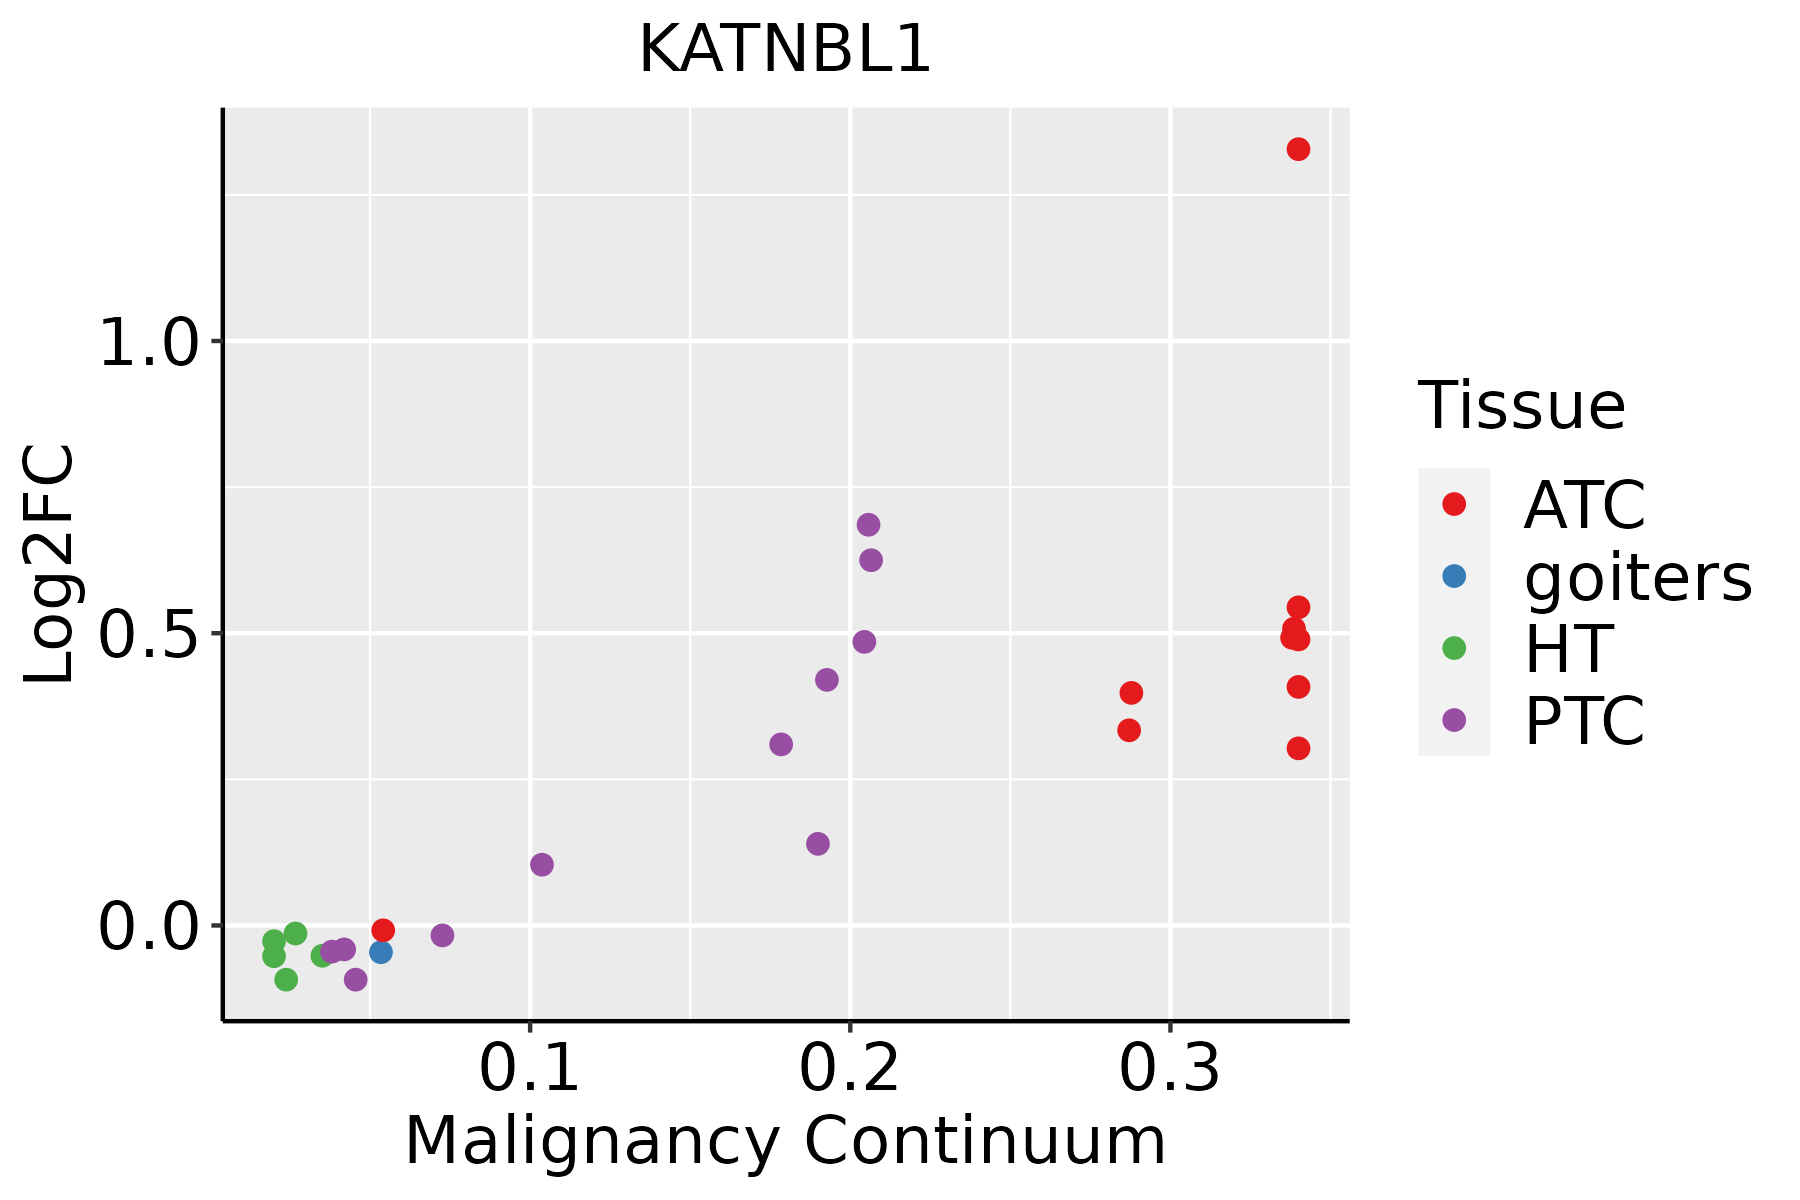 | ATC: Anaplastic thyroid cancer |
| HT: Hashimoto's thyroiditis | ||
| PTC: Papillary thyroid cancer |
| ∗log2FC in expression of this searched gene in stem-like cells from each diseased tissue sample relative to stem-like cells in normal samples in each tissue plotted against the malignancy continuum. Samples are colored based on if they are from different disease stage. |
Top |
Malignant transformation related pathway analysis |
| Find out the enriched GO biological processes and KEGG pathways involved in transition from healthy to precancer to cancer |
| Tissue | Disease Stage | Enriched GO biological Processes |
| Colorectum | AD |  |
| Colorectum | SER |  |
| Colorectum | MSS |  |
| Colorectum | MSI-H |  |
| Colorectum | FAP |  |
| ∗Top 15 enriched GO BP terms are showed in the bar plot of each disease state in each tissue. Each row represents a significant GO biological process which is colored according to the -log10(p.adjust). |
| Page: 1 2 3 4 5 6 7 8 9 |
| GO ID | Tissue | Disease Stage | Description | Gene Ratio | Bg Ratio | pvalue | p.adjust | Count |
| GO:0051495 | Colorectum | AD | positive regulation of cytoskeleton organization | 89/3918 | 226/18723 | 1.61e-10 | 1.56e-08 | 89 |
| GO:00514952 | Colorectum | MSS | positive regulation of cytoskeleton organization | 78/3467 | 226/18723 | 6.86e-09 | 4.32e-07 | 78 |
| GO:00514954 | Colorectum | FAP | positive regulation of cytoskeleton organization | 60/2622 | 226/18723 | 4.45e-07 | 2.37e-05 | 60 |
| GO:00514955 | Colorectum | CRC | positive regulation of cytoskeleton organization | 48/2078 | 226/18723 | 6.88e-06 | 2.61e-04 | 48 |
| GO:005149520 | Esophagus | ESCC | positive regulation of cytoskeleton organization | 147/8552 | 226/18723 | 2.93e-09 | 6.38e-08 | 147 |
| GO:005149518 | Oral cavity | OSCC | positive regulation of cytoskeleton organization | 135/7305 | 226/18723 | 1.98e-10 | 5.66e-09 | 135 |
| GO:005149532 | Oral cavity | NEOLP | positive regulation of cytoskeleton organization | 50/2005 | 226/18723 | 4.47e-07 | 1.35e-05 | 50 |
| GO:005149525 | Skin | AK | positive regulation of cytoskeleton organization | 42/1910 | 226/18723 | 9.07e-05 | 1.23e-03 | 42 |
| GO:0051495110 | Skin | cSCC | positive regulation of cytoskeleton organization | 86/4864 | 226/18723 | 4.08e-05 | 4.34e-04 | 86 |
| GO:005149526 | Thyroid | PTC | positive regulation of cytoskeleton organization | 121/5968 | 226/18723 | 1.04e-11 | 4.27e-10 | 121 |
| GO:0051495111 | Thyroid | ATC | positive regulation of cytoskeleton organization | 125/6293 | 226/18723 | 1.39e-11 | 5.08e-10 | 125 |
| Page: 1 |
| Pathway ID | Tissue | Disease Stage | Description | Gene Ratio | Bg Ratio | pvalue | p.adjust | qvalue | Count |
| Page: 1 |
Top |
Cell-cell communication analysis |
| Identification of potential cell-cell interactions between two cell types and their ligand-receptor pairs for different disease states |
| Ligand | Receptor | LRpair | Pathway | Tissue | Disease Stage |
| Page: 1 |
Top |
Single-cell gene regulatory network inference analysis |
| Find out the significant the regulons (TFs) and the target genes of each regulon across cell types for different disease states |
| TF | Cell Type | Tissue | Disease Stage | Target Gene | RSS | Regulon Activity |
| ∗The dot plots of a searched regulon are shown for all cell subpopulations in each disease state of each tissue based on the regulon specific score inferred using pySCENIC and by calculating the average expression. |
| Page: 1 |
Top |
Somatic mutation of malignant transformation related genes |
| Annotation of somatic variants for genes involved in malignant transformation |
| Hugo Symbol | Variant Class | Variant Classification | dbSNP RS | HGVSc | HGVSp | HGVSp Short | SWISSPROT | BIOTYPE | SIFT | PolyPhen | Tumor Sample Barcode | Tissue | Histology | Sex | Age | Stage | Therapy Types | Drugs | Outcome |
| KATNBL1 | SNV | Missense_Mutation | rs369374470 | c.356G>A | p.Arg119Gln | p.R119Q | Q9H079 | protein_coding | tolerated(0.2) | possibly_damaging(0.689) | TCGA-AN-A046-01 | Breast | breast invasive carcinoma | Female | >=65 | I/II | Unknown | Unknown | SD |
| KATNBL1 | SNV | Missense_Mutation | rs535651317 | c.115N>A | p.Glu39Lys | p.E39K | Q9H079 | protein_coding | deleterious(0.03) | benign(0.17) | TCGA-C8-A3M7-01 | Breast | breast invasive carcinoma | Female | <65 | III/IV | Unknown | Unknown | PD |
| KATNBL1 | insertion | Frame_Shift_Ins | novel | c.688_689insTATTTCATGT | p.Lys230IlefsTer6 | p.K230Ifs*6 | Q9H079 | protein_coding | TCGA-AC-A3QQ-01 | Breast | breast invasive carcinoma | Female | <65 | I/II | Unknown | Unknown | SD | ||
| KATNBL1 | SNV | Missense_Mutation | rs369840113 | c.212N>A | p.Arg71His | p.R71H | Q9H079 | protein_coding | tolerated(0.61) | benign(0) | TCGA-2W-A8YY-01 | Cervix | cervical & endocervical cancer | Female | <65 | I/II | Chemotherapy | cisplatin | CR |
| KATNBL1 | SNV | Missense_Mutation | c.776N>G | p.Ile259Ser | p.I259S | Q9H079 | protein_coding | tolerated(0.74) | benign(0.043) | TCGA-CA-6718-01 | Colorectum | colon adenocarcinoma | Male | <65 | I/II | Unknown | Unknown | PD | |
| KATNBL1 | SNV | Missense_Mutation | c.58N>A | p.His20Asn | p.H20N | Q9H079 | protein_coding | tolerated(0.48) | benign(0.003) | TCGA-AG-A002-01 | Colorectum | rectum adenocarcinoma | Male | <65 | I/II | Unknown | Unknown | SD | |
| KATNBL1 | deletion | Frame_Shift_Del | c.433delN | p.Ser145LeufsTer19 | p.S145Lfs*19 | Q9H079 | protein_coding | TCGA-AA-3710-01 | Colorectum | colon adenocarcinoma | Female | >=65 | I/II | Unknown | Unknown | SD | |||
| KATNBL1 | deletion | Frame_Shift_Del | c.433delN | p.Ser145LeufsTer19 | p.S145Lfs*19 | Q9H079 | protein_coding | TCGA-AA-3811-01 | Colorectum | colon adenocarcinoma | Female | >=65 | III/IV | Unknown | Unknown | PD | |||
| KATNBL1 | deletion | Frame_Shift_Del | c.433delN | p.Ser145LeufsTer19 | p.S145Lfs*19 | Q9H079 | protein_coding | TCGA-AA-3949-01 | Colorectum | colon adenocarcinoma | Female | >=65 | III/IV | Unknown | Unknown | SD | |||
| KATNBL1 | deletion | Frame_Shift_Del | c.433delT | p.Ser145LeufsTer19 | p.S145Lfs*19 | Q9H079 | protein_coding | TCGA-G4-6309-01 | Colorectum | colon adenocarcinoma | Female | <65 | III/IV | Chemotherapy | xeloda | PD |
| Page: 1 2 3 4 |
Top |
Related drugs of malignant transformation related genes |
| Identification of chemicals and drugs interact with genes involved in malignant transfromation |
| (DGIdb 4.0) |
| Entrez ID | Symbol | Category | Interaction Types | Drug Claim Name | Drug Name | PMIDs |
| Page: 1 |

Copyright 2023-Present -The University of Texas Health Science Center at Houston |