
|
|||||
|
 | |
| |
| |
| |
| |
| |
|
Gene: KATNB1 |
Gene summary for KATNB1 |
| Gene information | Species | Human | Gene symbol | KATNB1 | Gene ID | 10300 |
| Gene name | katanin regulatory subunit B1 | |
| Gene Alias | KAT | |
| Cytomap | 16q21 | |
| Gene Type | protein-coding | GO ID | GO:0000070 | UniProtAcc | Q9BVA0 |
Top |
Malignant transformation analysis |
| Identification of the aberrant gene expression in precancerous and cancerous lesions by comparing the gene expression of stem-like cells in diseased tissues with normal stem cells |
| Entrez ID | Symbol | Replicates | Species | Organ | Tissue | Adj P-value | Log2FC | Malignancy |
| 10300 | KATNB1 | LZE7T | Human | Esophagus | ESCC | 1.59e-04 | 2.62e-01 | 0.0667 |
| 10300 | KATNB1 | LZE8T | Human | Esophagus | ESCC | 1.92e-05 | 1.89e-01 | 0.067 |
| 10300 | KATNB1 | LZE24T | Human | Esophagus | ESCC | 1.99e-08 | 3.20e-01 | 0.0596 |
| 10300 | KATNB1 | P1T-E | Human | Esophagus | ESCC | 2.31e-04 | 2.73e-01 | 0.0875 |
| 10300 | KATNB1 | P2T-E | Human | Esophagus | ESCC | 1.23e-14 | 2.54e-01 | 0.1177 |
| 10300 | KATNB1 | P4T-E | Human | Esophagus | ESCC | 1.77e-11 | 3.35e-01 | 0.1323 |
| 10300 | KATNB1 | P8T-E | Human | Esophagus | ESCC | 2.61e-12 | 1.74e-01 | 0.0889 |
| 10300 | KATNB1 | P10T-E | Human | Esophagus | ESCC | 3.98e-13 | 1.17e-01 | 0.116 |
| 10300 | KATNB1 | P11T-E | Human | Esophagus | ESCC | 1.12e-07 | 2.86e-01 | 0.1426 |
| 10300 | KATNB1 | P12T-E | Human | Esophagus | ESCC | 5.23e-05 | 7.47e-02 | 0.1122 |
| 10300 | KATNB1 | P15T-E | Human | Esophagus | ESCC | 2.83e-06 | 8.88e-02 | 0.1149 |
| 10300 | KATNB1 | P16T-E | Human | Esophagus | ESCC | 3.50e-06 | 1.42e-01 | 0.1153 |
| 10300 | KATNB1 | P20T-E | Human | Esophagus | ESCC | 2.58e-14 | 3.25e-01 | 0.1124 |
| 10300 | KATNB1 | P21T-E | Human | Esophagus | ESCC | 4.59e-16 | 3.34e-01 | 0.1617 |
| 10300 | KATNB1 | P22T-E | Human | Esophagus | ESCC | 1.36e-11 | 1.99e-01 | 0.1236 |
| 10300 | KATNB1 | P23T-E | Human | Esophagus | ESCC | 4.34e-04 | 1.99e-01 | 0.108 |
| 10300 | KATNB1 | P24T-E | Human | Esophagus | ESCC | 3.85e-11 | 1.95e-01 | 0.1287 |
| 10300 | KATNB1 | P26T-E | Human | Esophagus | ESCC | 1.17e-12 | 2.73e-01 | 0.1276 |
| 10300 | KATNB1 | P27T-E | Human | Esophagus | ESCC | 2.27e-10 | 2.00e-01 | 0.1055 |
| 10300 | KATNB1 | P28T-E | Human | Esophagus | ESCC | 1.80e-03 | 1.25e-01 | 0.1149 |
| Page: 1 2 3 4 |
| Tissue | Expression Dynamics | Abbreviation |
| Esophagus |  | ESCC: Esophageal squamous cell carcinoma |
| HGIN: High-grade intraepithelial neoplasias | ||
| LGIN: Low-grade intraepithelial neoplasias | ||
| Oral Cavity | 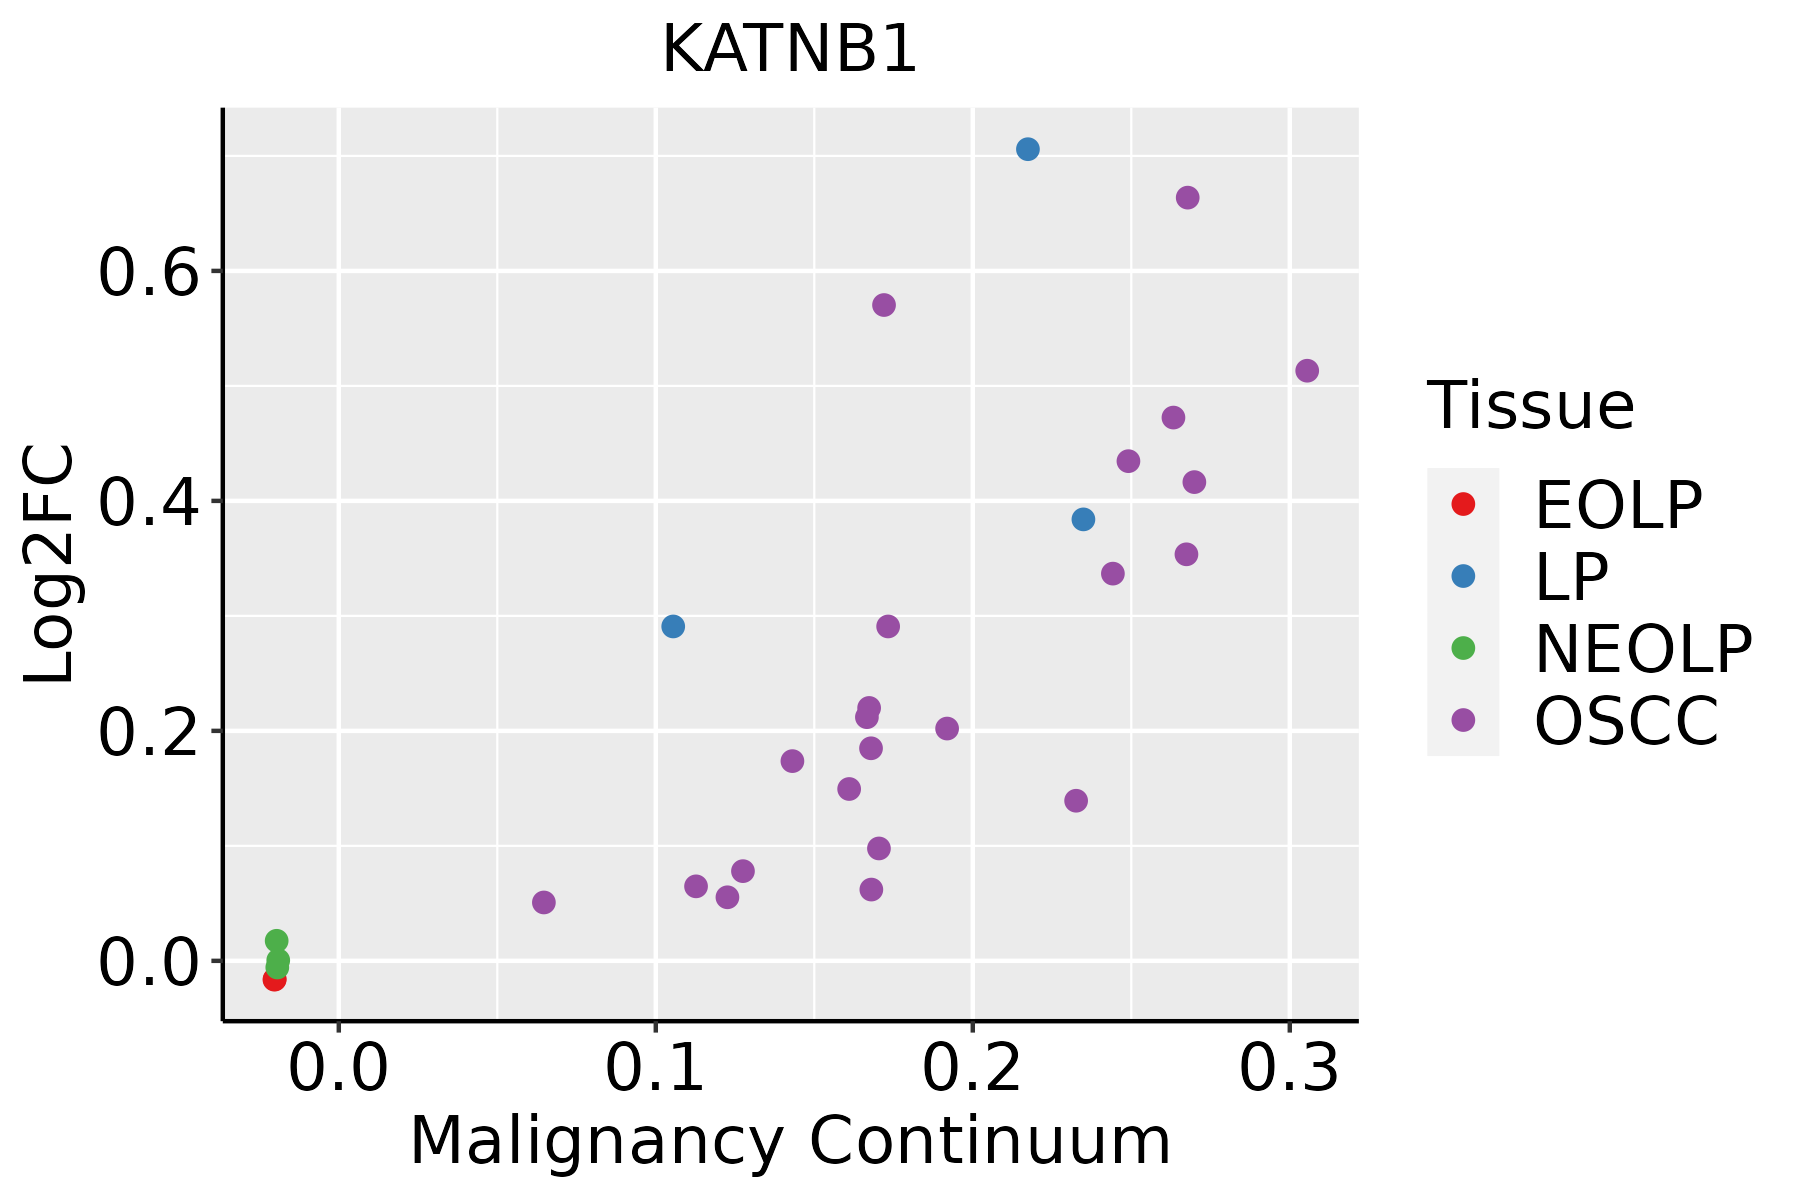 | EOLP: Erosive Oral lichen planus |
| LP: leukoplakia | ||
| NEOLP: Non-erosive oral lichen planus | ||
| OSCC: Oral squamous cell carcinoma |
| ∗log2FC in expression of this searched gene in stem-like cells from each diseased tissue sample relative to stem-like cells in normal samples in each tissue plotted against the malignancy continuum. Samples are colored based on if they are from different disease stage. |
Top |
Malignant transformation related pathway analysis |
| Find out the enriched GO biological processes and KEGG pathways involved in transition from healthy to precancer to cancer |
| Tissue | Disease Stage | Enriched GO biological Processes |
| Colorectum | AD |  |
| Colorectum | SER |  |
| Colorectum | MSS |  |
| Colorectum | MSI-H |  |
| Colorectum | FAP |  |
| ∗Top 15 enriched GO BP terms are showed in the bar plot of each disease state in each tissue. Each row represents a significant GO biological process which is colored according to the -log10(p.adjust). |
| Page: 1 2 3 4 5 6 7 8 9 |
| GO ID | Tissue | Disease Stage | Description | Gene Ratio | Bg Ratio | pvalue | p.adjust | Count |
| GO:014001414 | Esophagus | ESCC | mitotic nuclear division | 218/8552 | 287/18723 | 6.17e-26 | 1.78e-23 | 218 |
| GO:0022411111 | Esophagus | ESCC | cellular component disassembly | 305/8552 | 443/18723 | 1.94e-23 | 4.57e-21 | 305 |
| GO:0006605111 | Esophagus | ESCC | protein targeting | 229/8552 | 314/18723 | 4.93e-23 | 1.01e-20 | 229 |
| GO:005165617 | Esophagus | ESCC | establishment of organelle localization | 273/8552 | 390/18723 | 9.13e-23 | 1.81e-20 | 273 |
| GO:000007011 | Esophagus | ESCC | mitotic sister chromatid segregation | 138/8552 | 168/18723 | 1.37e-22 | 2.63e-20 | 138 |
| GO:00008194 | Esophagus | ESCC | sister chromatid segregation | 157/8552 | 202/18723 | 8.41e-21 | 1.33e-18 | 157 |
| GO:000705911 | Esophagus | ESCC | chromosome segregation | 238/8552 | 346/18723 | 1.72e-18 | 1.82e-16 | 238 |
| GO:00482853 | Esophagus | ESCC | organelle fission | 301/8552 | 488/18723 | 4.64e-13 | 2.12e-11 | 301 |
| GO:00988133 | Esophagus | ESCC | nuclear chromosome segregation | 187/8552 | 281/18723 | 1.00e-12 | 4.36e-11 | 187 |
| GO:005130311 | Esophagus | ESCC | establishment of chromosome localization | 67/8552 | 80/18723 | 1.92e-12 | 8.09e-11 | 67 |
| GO:005000011 | Esophagus | ESCC | chromosome localization | 68/8552 | 82/18723 | 3.37e-12 | 1.32e-10 | 68 |
| GO:00002802 | Esophagus | ESCC | nuclear division | 270/8552 | 439/18723 | 1.17e-11 | 4.24e-10 | 270 |
| GO:003298416 | Esophagus | ESCC | protein-containing complex disassembly | 151/8552 | 224/18723 | 3.45e-11 | 1.15e-09 | 151 |
| GO:1902905111 | Esophagus | ESCC | positive regulation of supramolecular fiber organization | 142/8552 | 209/18723 | 5.51e-11 | 1.76e-09 | 142 |
| GO:1902903111 | Esophagus | ESCC | regulation of supramolecular fiber organization | 237/8552 | 383/18723 | 9.06e-11 | 2.75e-09 | 237 |
| GO:0010639110 | Esophagus | ESCC | negative regulation of organelle organization | 215/8552 | 348/18723 | 8.20e-10 | 2.01e-08 | 215 |
| GO:005149520 | Esophagus | ESCC | positive regulation of cytoskeleton organization | 147/8552 | 226/18723 | 2.93e-09 | 6.38e-08 | 147 |
| GO:00705078 | Esophagus | ESCC | regulation of microtubule cytoskeleton organization | 99/8552 | 148/18723 | 1.43e-07 | 2.29e-06 | 99 |
| GO:003134616 | Esophagus | ESCC | positive regulation of cell projection organization | 201/8552 | 353/18723 | 1.19e-05 | 1.11e-04 | 201 |
| GO:00311128 | Esophagus | ESCC | positive regulation of microtubule polymerization or depolymerization | 29/8552 | 37/18723 | 4.97e-05 | 3.86e-04 | 29 |
| Page: 1 2 3 4 |
| Pathway ID | Tissue | Disease Stage | Description | Gene Ratio | Bg Ratio | pvalue | p.adjust | qvalue | Count |
| Page: 1 |
Top |
Cell-cell communication analysis |
| Identification of potential cell-cell interactions between two cell types and their ligand-receptor pairs for different disease states |
| Ligand | Receptor | LRpair | Pathway | Tissue | Disease Stage |
| Page: 1 |
Top |
Single-cell gene regulatory network inference analysis |
| Find out the significant the regulons (TFs) and the target genes of each regulon across cell types for different disease states |
| TF | Cell Type | Tissue | Disease Stage | Target Gene | RSS | Regulon Activity |
| ∗The dot plots of a searched regulon are shown for all cell subpopulations in each disease state of each tissue based on the regulon specific score inferred using pySCENIC and by calculating the average expression. |
| Page: 1 |
Top |
Somatic mutation of malignant transformation related genes |
| Annotation of somatic variants for genes involved in malignant transformation |
| Hugo Symbol | Variant Class | Variant Classification | dbSNP RS | HGVSc | HGVSp | HGVSp Short | SWISSPROT | BIOTYPE | SIFT | PolyPhen | Tumor Sample Barcode | Tissue | Histology | Sex | Age | Stage | Therapy Types | Drugs | Outcome |
| KATNB1 | SNV | Missense_Mutation | rs371850267 | c.100N>T | p.Arg34Trp | p.R34W | Q9BVA0 | protein_coding | deleterious(0) | probably_damaging(0.999) | TCGA-BH-A0HF-01 | Breast | breast invasive carcinoma | Female | >=65 | I/II | Hormone Therapy | arimidex | SD |
| KATNB1 | SNV | Missense_Mutation | c.829N>A | p.Asp277Asn | p.D277N | Q9BVA0 | protein_coding | deleterious(0.01) | probably_damaging(0.995) | TCGA-E2-A1B4-01 | Breast | breast invasive carcinoma | Female | >=65 | III/IV | Hormone Therapy | arimidex | SD | |
| KATNB1 | SNV | Missense_Mutation | c.1390G>C | p.Gly464Arg | p.G464R | Q9BVA0 | protein_coding | deleterious(0) | probably_damaging(0.999) | TCGA-E9-A1N9-01 | Breast | breast invasive carcinoma | Female | <65 | I/II | Chemotherapy | doxorubicin | SD | |
| KATNB1 | insertion | Frame_Shift_Ins | novel | c.92_93insGATGTGCAGAAACAGGAAGAAAATCGTGAAGTCTAAAGGTAGGAAGGACAGG | p.Ser32MetfsTer28 | p.S32Mfs*28 | Q9BVA0 | protein_coding | TCGA-B6-A0IK-01 | Breast | breast invasive carcinoma | Female | <65 | III/IV | Unknown | Unknown | PD | ||
| KATNB1 | deletion | Frame_Shift_Del | novel | c.1636delC | p.Gln546ArgfsTer37 | p.Q546Rfs*37 | Q9BVA0 | protein_coding | TCGA-D8-A27V-01 | Breast | breast invasive carcinoma | Female | <65 | I/II | Hormone Therapy | tamoxiphen | SD | ||
| KATNB1 | deletion | Frame_Shift_Del | novel | c.1788delG | p.Met596IlefsTer41 | p.M596Ifs*41 | Q9BVA0 | protein_coding | TCGA-D8-A27V-01 | Breast | breast invasive carcinoma | Female | <65 | I/II | Hormone Therapy | tamoxiphen | SD | ||
| KATNB1 | SNV | Missense_Mutation | rs782162027 | c.1003C>T | p.Arg335Cys | p.R335C | Q9BVA0 | protein_coding | deleterious(0) | probably_damaging(0.972) | TCGA-2W-A8YY-01 | Cervix | cervical & endocervical cancer | Female | <65 | I/II | Chemotherapy | cisplatin | CR |
| KATNB1 | SNV | Missense_Mutation | rs782431692 | c.251C>T | p.Ser84Leu | p.S84L | Q9BVA0 | protein_coding | deleterious(0) | probably_damaging(0.997) | TCGA-EA-A3HU-01 | Cervix | cervical & endocervical cancer | Female | <65 | I/II | Unknown | Unknown | SD |
| KATNB1 | SNV | Missense_Mutation | rs11555150 | c.1730N>T | p.Thr577Met | p.T577M | Q9BVA0 | protein_coding | deleterious(0) | probably_damaging(0.999) | TCGA-VS-A9UC-01 | Cervix | cervical & endocervical cancer | Female | <65 | I/II | Chemotherapy | cisplatin | SD |
| KATNB1 | SNV | Missense_Mutation | rs11555150 | c.1730N>T | p.Thr577Met | p.T577M | Q9BVA0 | protein_coding | deleterious(0) | probably_damaging(0.999) | TCGA-AA-3492-01 | Colorectum | colon adenocarcinoma | Female | >=65 | I/II | Unknown | Unknown | SD |
| Page: 1 2 3 4 5 6 |
Top |
Related drugs of malignant transformation related genes |
| Identification of chemicals and drugs interact with genes involved in malignant transfromation |
| (DGIdb 4.0) |
| Entrez ID | Symbol | Category | Interaction Types | Drug Claim Name | Drug Name | PMIDs |
| Page: 1 |

Copyright 2023-Present -The University of Texas Health Science Center at Houston |