
|
|||||
|
 | |
| |
| |
| |
| |
| |
|
Gene: KAT8 |
Gene summary for KAT8 |
| Gene information | Species | Human | Gene symbol | KAT8 | Gene ID | 84148 |
| Gene name | lysine acetyltransferase 8 | |
| Gene Alias | LIGOWS | |
| Cytomap | 16p11.2 | |
| Gene Type | protein-coding | GO ID | GO:0002376 | UniProtAcc | Q9H7Z6 |
Top |
Malignant transformation analysis |
| Identification of the aberrant gene expression in precancerous and cancerous lesions by comparing the gene expression of stem-like cells in diseased tissues with normal stem cells |
| Entrez ID | Symbol | Replicates | Species | Organ | Tissue | Adj P-value | Log2FC | Malignancy |
| 84148 | KAT8 | LZE4T | Human | Esophagus | ESCC | 2.37e-03 | 7.93e-02 | 0.0811 |
| 84148 | KAT8 | LZE8T | Human | Esophagus | ESCC | 2.12e-04 | 8.20e-02 | 0.067 |
| 84148 | KAT8 | LZE20T | Human | Esophagus | ESCC | 1.31e-03 | 2.50e-01 | 0.0662 |
| 84148 | KAT8 | LZE21D1 | Human | Esophagus | HGIN | 1.87e-02 | 2.35e-01 | 0.0632 |
| 84148 | KAT8 | LZE22D1 | Human | Esophagus | HGIN | 6.17e-06 | 2.11e-01 | 0.0595 |
| 84148 | KAT8 | LZE22T | Human | Esophagus | ESCC | 1.58e-07 | 3.27e-01 | 0.068 |
| 84148 | KAT8 | LZE24T | Human | Esophagus | ESCC | 5.09e-29 | 9.38e-01 | 0.0596 |
| 84148 | KAT8 | LZE21T | Human | Esophagus | ESCC | 1.36e-05 | 3.25e-01 | 0.0655 |
| 84148 | KAT8 | P1T-E | Human | Esophagus | ESCC | 1.37e-09 | 6.48e-01 | 0.0875 |
| 84148 | KAT8 | P2T-E | Human | Esophagus | ESCC | 3.35e-70 | 1.21e+00 | 0.1177 |
| 84148 | KAT8 | P4T-E | Human | Esophagus | ESCC | 2.86e-12 | 4.03e-01 | 0.1323 |
| 84148 | KAT8 | P5T-E | Human | Esophagus | ESCC | 2.16e-20 | 3.60e-01 | 0.1327 |
| 84148 | KAT8 | P8T-E | Human | Esophagus | ESCC | 2.46e-42 | 6.16e-01 | 0.0889 |
| 84148 | KAT8 | P9T-E | Human | Esophagus | ESCC | 6.15e-15 | 2.70e-01 | 0.1131 |
| 84148 | KAT8 | P10T-E | Human | Esophagus | ESCC | 1.10e-22 | 3.59e-01 | 0.116 |
| 84148 | KAT8 | P11T-E | Human | Esophagus | ESCC | 8.50e-12 | 3.91e-01 | 0.1426 |
| 84148 | KAT8 | P12T-E | Human | Esophagus | ESCC | 6.04e-68 | 1.09e+00 | 0.1122 |
| 84148 | KAT8 | P15T-E | Human | Esophagus | ESCC | 3.09e-36 | 7.39e-01 | 0.1149 |
| 84148 | KAT8 | P16T-E | Human | Esophagus | ESCC | 7.95e-41 | 6.18e-01 | 0.1153 |
| 84148 | KAT8 | P17T-E | Human | Esophagus | ESCC | 4.59e-04 | 3.80e-01 | 0.1278 |
| Page: 1 2 3 4 5 6 |
| Tissue | Expression Dynamics | Abbreviation |
| Esophagus | 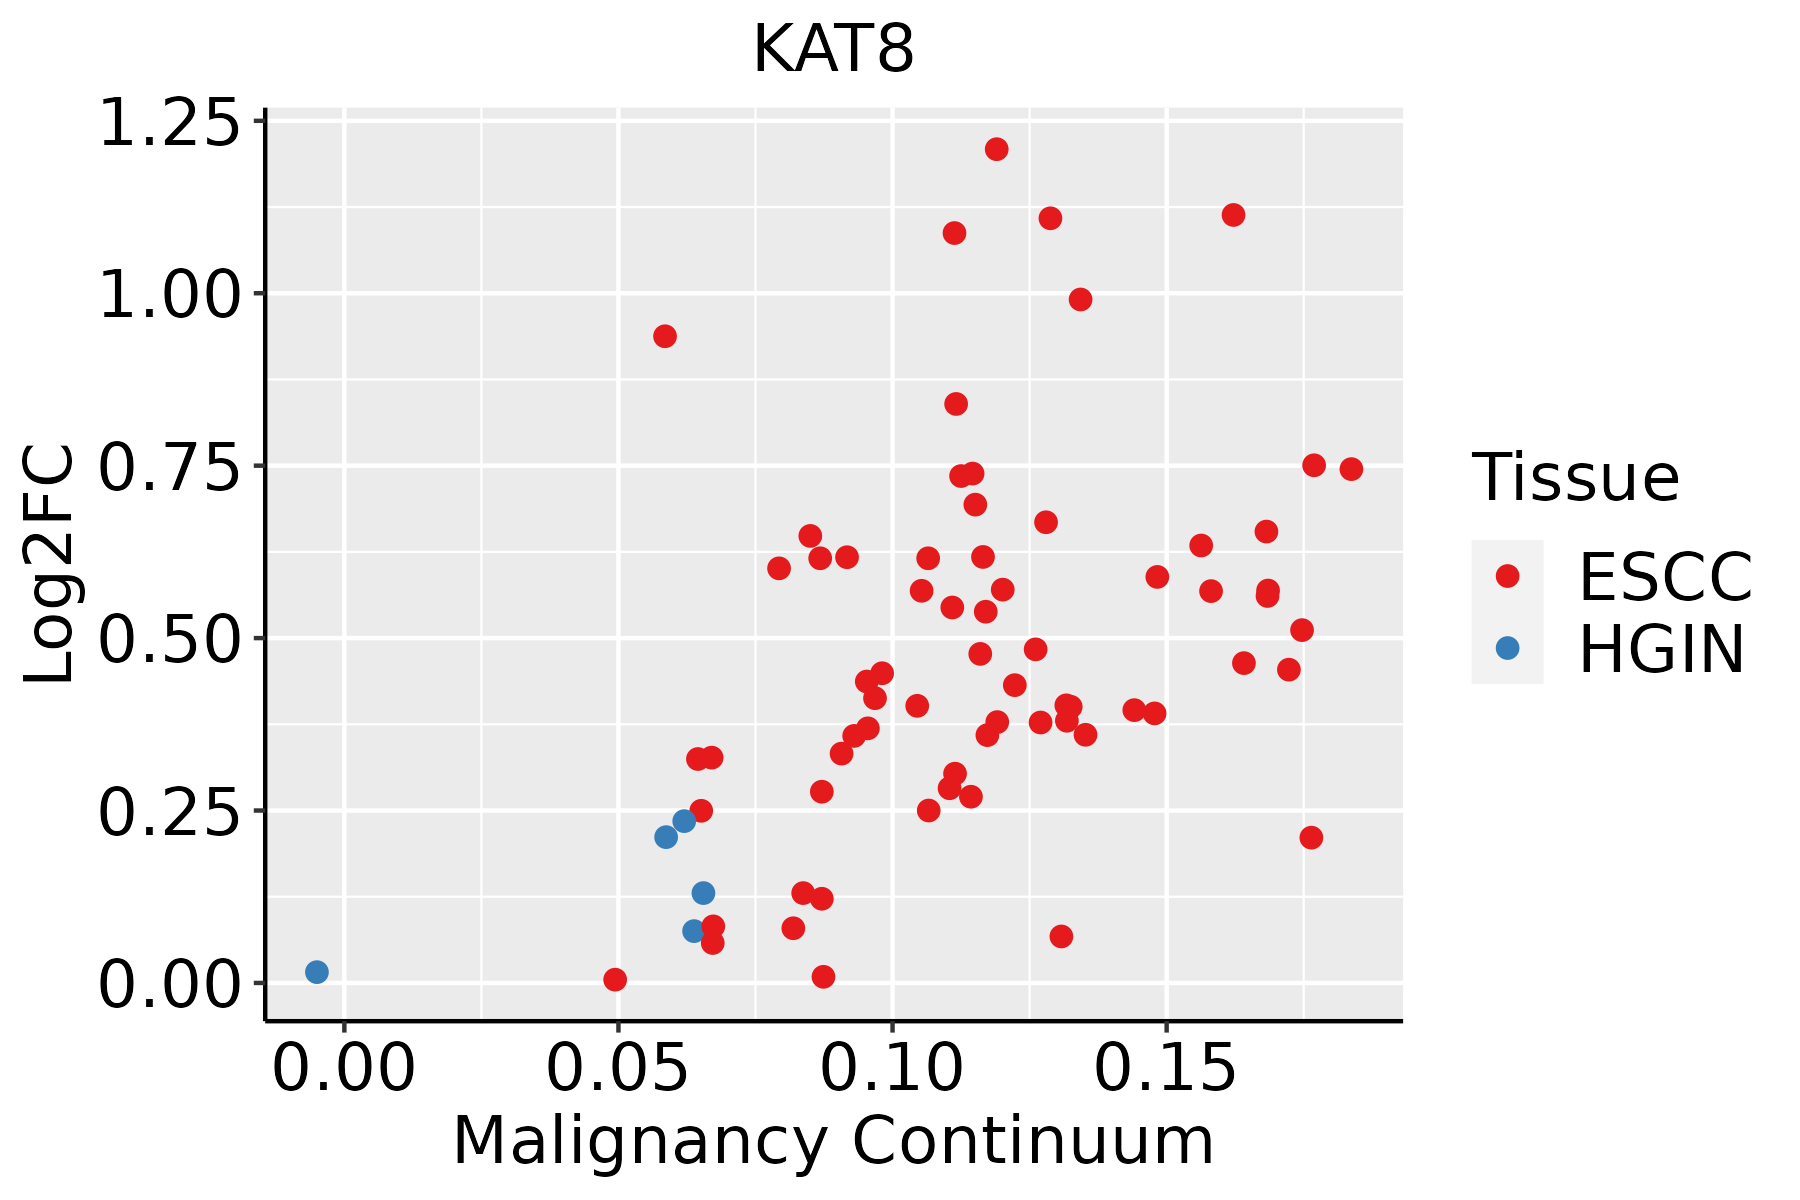 | ESCC: Esophageal squamous cell carcinoma |
| HGIN: High-grade intraepithelial neoplasias | ||
| LGIN: Low-grade intraepithelial neoplasias | ||
| Liver | 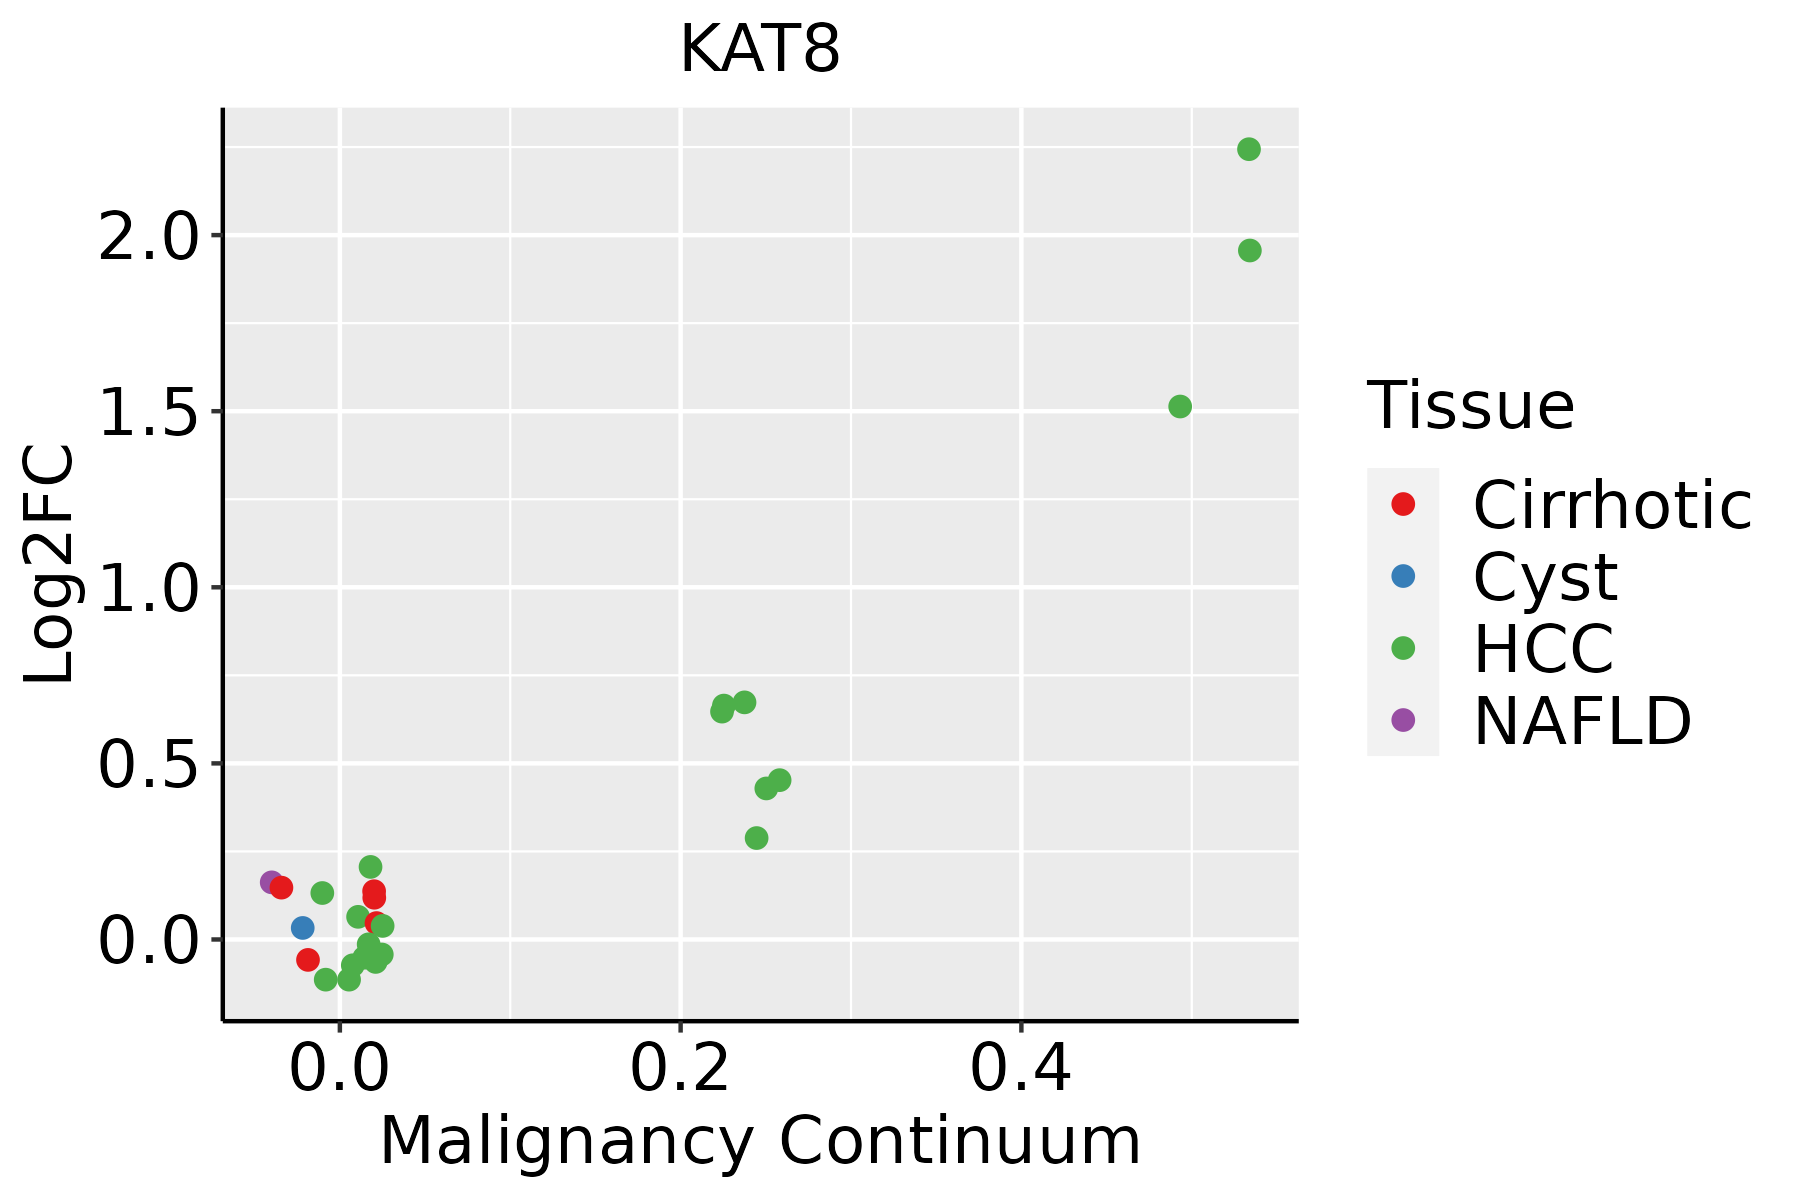 | HCC: Hepatocellular carcinoma |
| NAFLD: Non-alcoholic fatty liver disease | ||
| Oral Cavity | 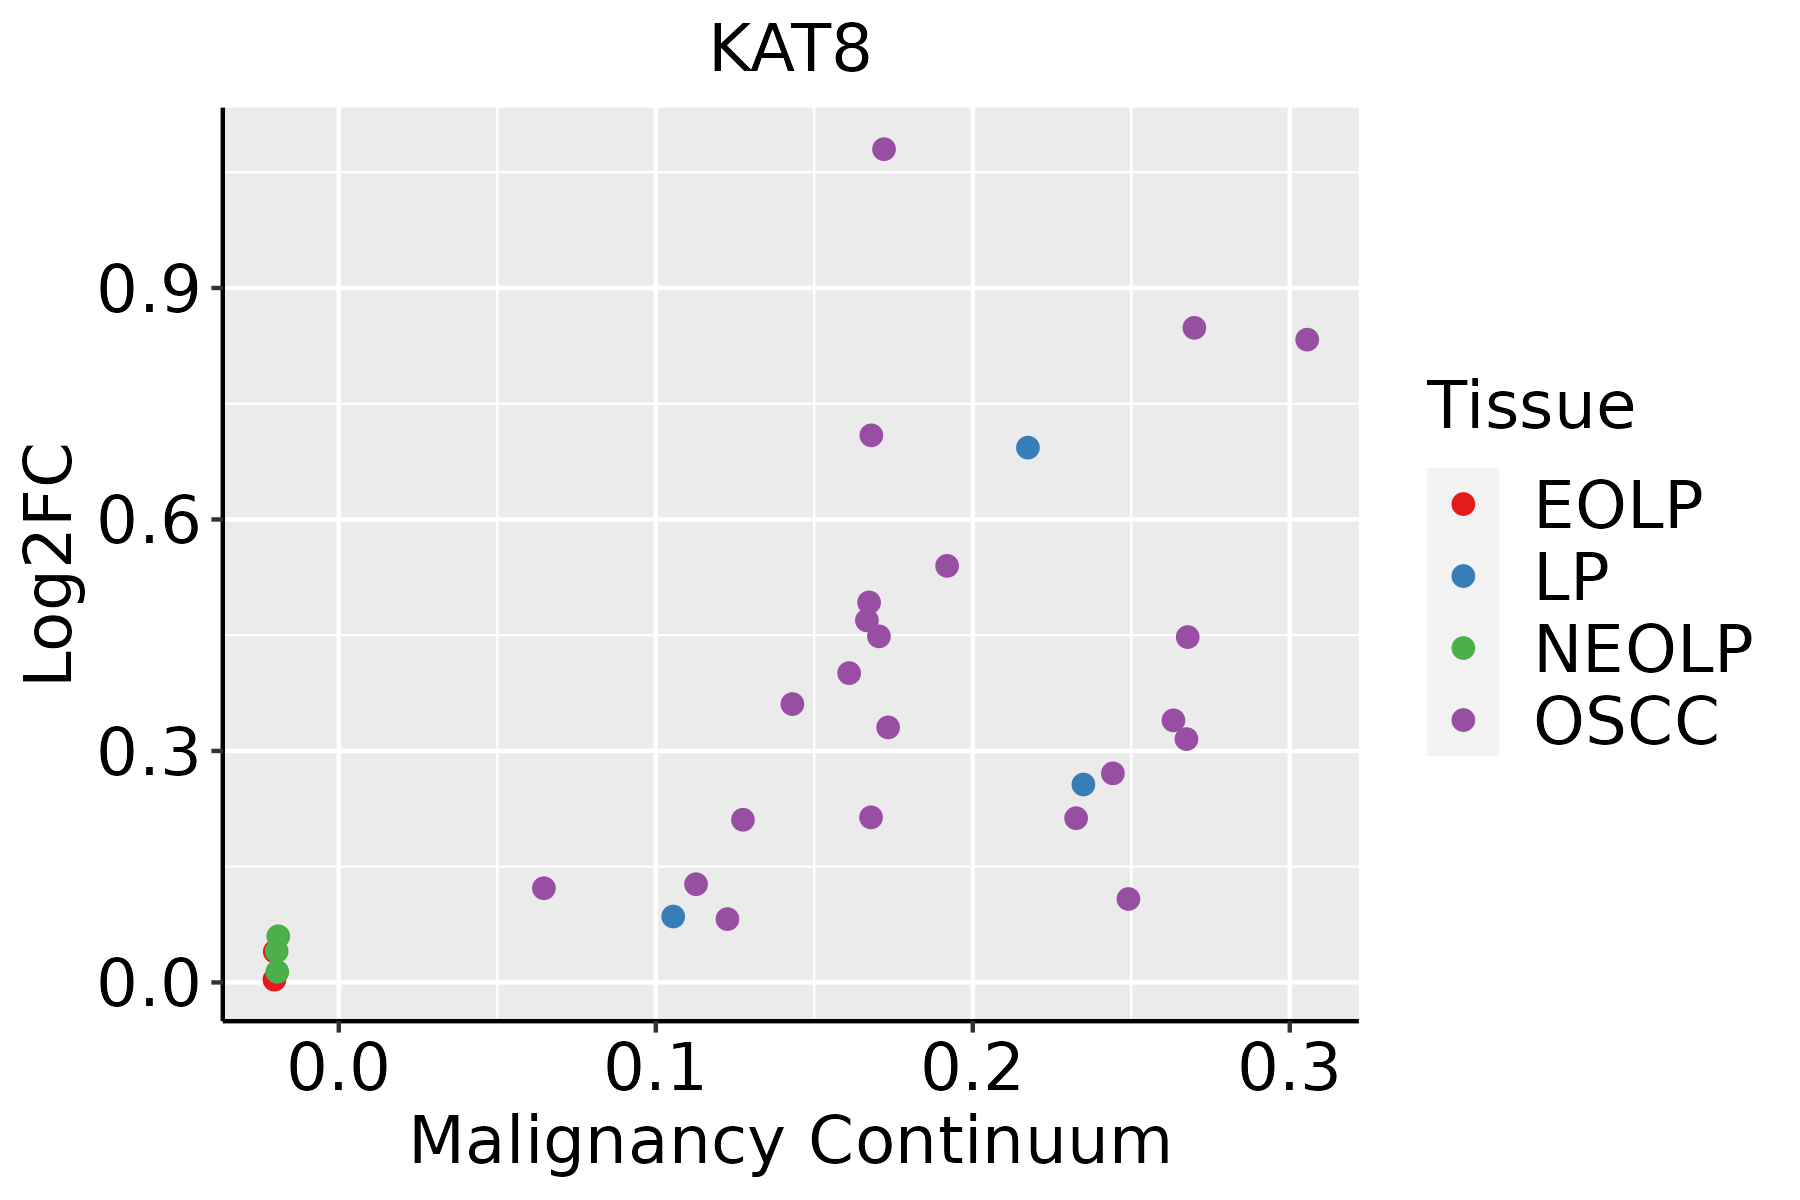 | EOLP: Erosive Oral lichen planus |
| LP: leukoplakia | ||
| NEOLP: Non-erosive oral lichen planus | ||
| OSCC: Oral squamous cell carcinoma | ||
| Thyroid | 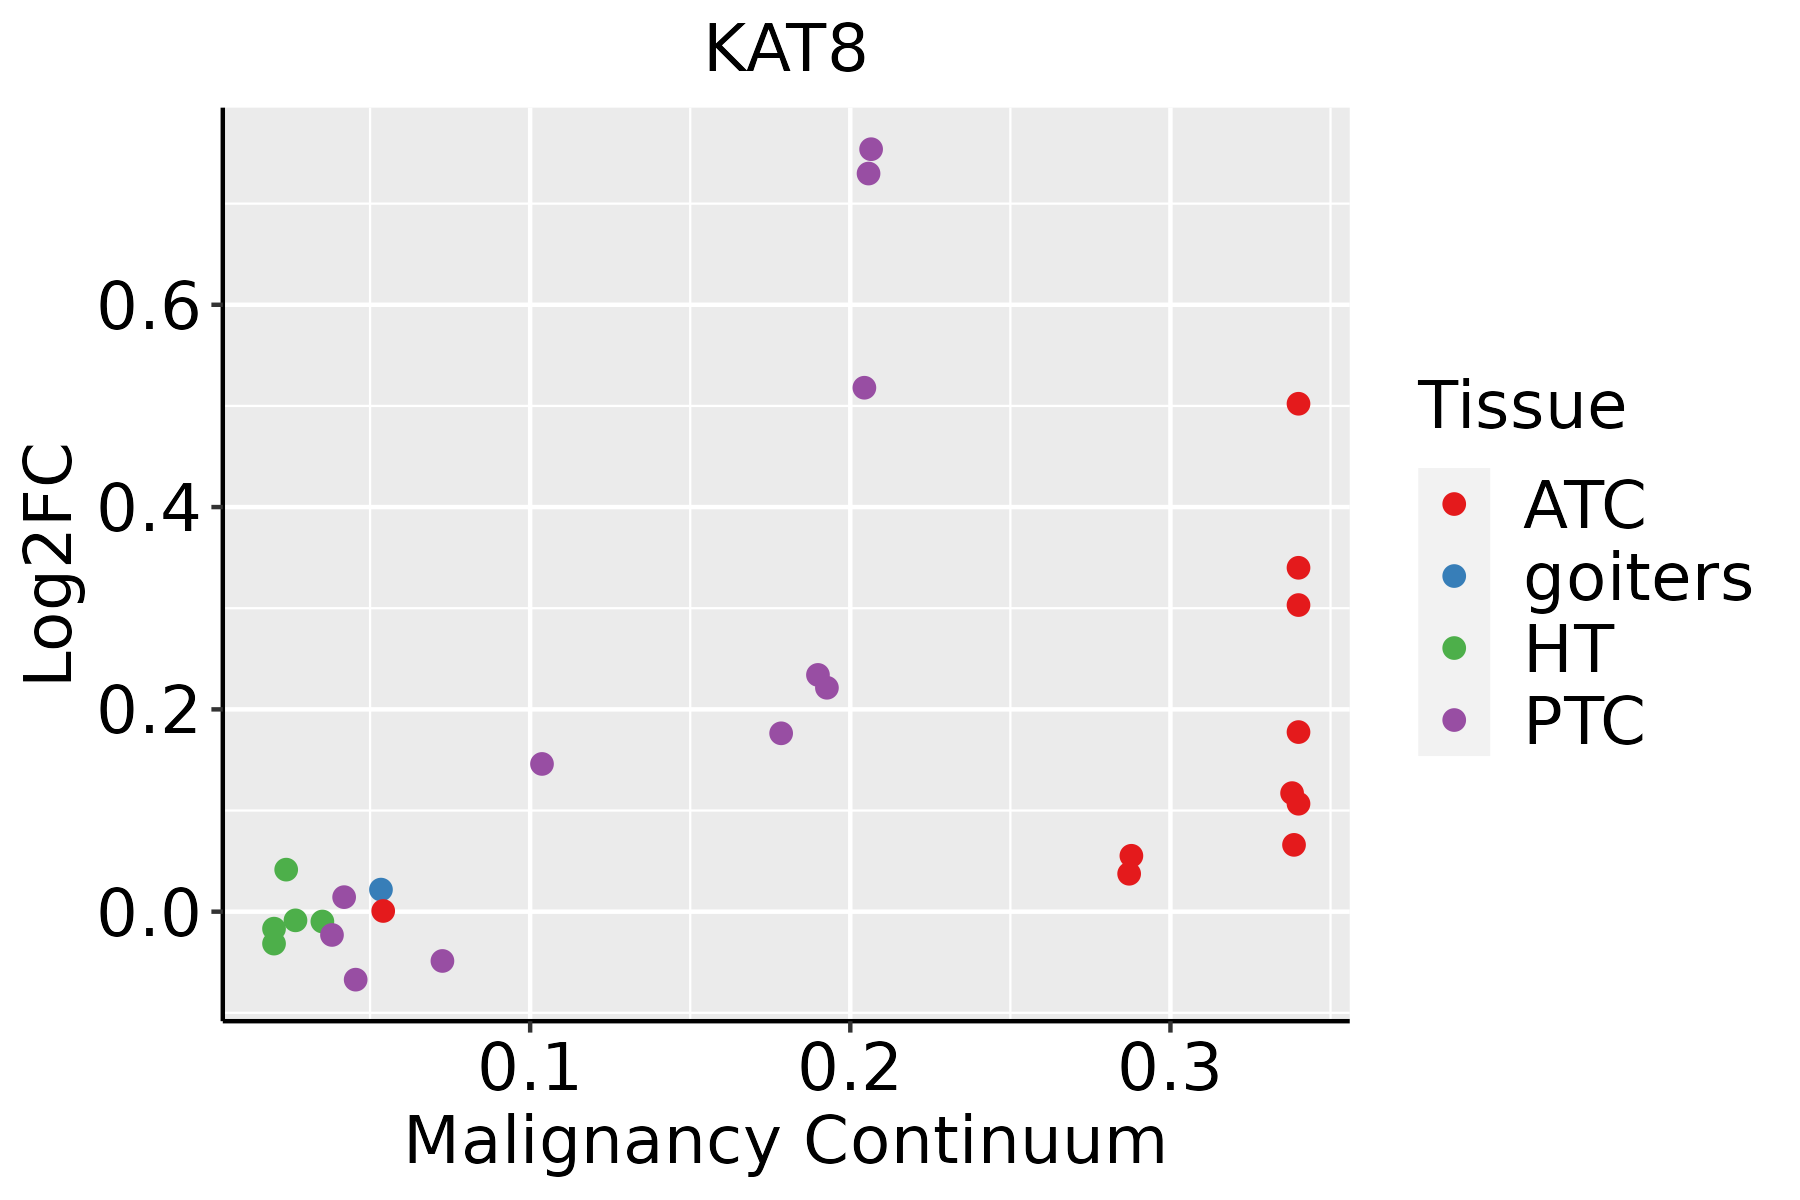 | ATC: Anaplastic thyroid cancer |
| HT: Hashimoto's thyroiditis | ||
| PTC: Papillary thyroid cancer |
| ∗log2FC in expression of this searched gene in stem-like cells from each diseased tissue sample relative to stem-like cells in normal samples in each tissue plotted against the malignancy continuum. Samples are colored based on if they are from different disease stage. |
Top |
Malignant transformation related pathway analysis |
| Find out the enriched GO biological processes and KEGG pathways involved in transition from healthy to precancer to cancer |
| Tissue | Disease Stage | Enriched GO biological Processes |
| Colorectum | AD |  |
| Colorectum | SER |  |
| Colorectum | MSS |  |
| Colorectum | MSI-H |  |
| Colorectum | FAP |  |
| ∗Top 15 enriched GO BP terms are showed in the bar plot of each disease state in each tissue. Each row represents a significant GO biological process which is colored according to the -log10(p.adjust). |
| Page: 1 2 3 4 5 6 7 8 9 |
| GO ID | Tissue | Disease Stage | Description | Gene Ratio | Bg Ratio | pvalue | p.adjust | Count |
| GO:001050616 | Esophagus | HGIN | regulation of autophagy | 84/2587 | 317/18723 | 1.39e-09 | 1.08e-07 | 84 |
| GO:00182057 | Esophagus | HGIN | peptidyl-lysine modification | 88/2587 | 376/18723 | 2.99e-07 | 1.39e-05 | 88 |
| GO:003009927 | Esophagus | HGIN | myeloid cell differentiation | 83/2587 | 381/18723 | 1.26e-05 | 3.52e-04 | 83 |
| GO:00165708 | Esophagus | HGIN | histone modification | 92/2587 | 463/18723 | 1.70e-04 | 3.30e-03 | 92 |
| GO:00064735 | Esophagus | HGIN | protein acetylation | 45/2587 | 201/18723 | 6.17e-04 | 8.58e-03 | 45 |
| GO:00439844 | Esophagus | HGIN | histone H4-K16 acetylation | 9/2587 | 20/18723 | 7.18e-04 | 9.60e-03 | 9 |
| GO:00183945 | Esophagus | HGIN | peptidyl-lysine acetylation | 39/2587 | 169/18723 | 7.46e-04 | 9.90e-03 | 39 |
| GO:00435435 | Esophagus | HGIN | protein acylation | 51/2587 | 243/18723 | 1.33e-03 | 1.57e-02 | 51 |
| GO:00439675 | Esophagus | HGIN | histone H4 acetylation | 19/2587 | 67/18723 | 1.39e-03 | 1.63e-02 | 19 |
| GO:00064755 | Esophagus | HGIN | internal protein amino acid acetylation | 36/2587 | 160/18723 | 1.87e-03 | 2.01e-02 | 36 |
| GO:00183935 | Esophagus | HGIN | internal peptidyl-lysine acetylation | 35/2587 | 158/18723 | 2.82e-03 | 2.75e-02 | 35 |
| GO:001657015 | Esophagus | ESCC | histone modification | 323/8552 | 463/18723 | 2.61e-26 | 7.88e-24 | 323 |
| GO:001820514 | Esophagus | ESCC | peptidyl-lysine modification | 259/8552 | 376/18723 | 3.90e-20 | 5.26e-18 | 259 |
| GO:001050617 | Esophagus | ESCC | regulation of autophagy | 220/8552 | 317/18723 | 6.72e-18 | 6.36e-16 | 220 |
| GO:001839413 | Esophagus | ESCC | peptidyl-lysine acetylation | 123/8552 | 169/18723 | 6.58e-13 | 2.94e-11 | 123 |
| GO:004354313 | Esophagus | ESCC | protein acylation | 165/8552 | 243/18723 | 1.69e-12 | 7.14e-11 | 165 |
| GO:000647313 | Esophagus | ESCC | protein acetylation | 140/8552 | 201/18723 | 4.37e-12 | 1.69e-10 | 140 |
| GO:001839313 | Esophagus | ESCC | internal peptidyl-lysine acetylation | 114/8552 | 158/18723 | 1.16e-11 | 4.24e-10 | 114 |
| GO:000647513 | Esophagus | ESCC | internal protein amino acid acetylation | 115/8552 | 160/18723 | 1.43e-11 | 5.08e-10 | 115 |
| GO:00165735 | Esophagus | ESCC | histone acetylation | 110/8552 | 152/18723 | 1.95e-11 | 6.81e-10 | 110 |
| Page: 1 2 3 4 5 6 |
| Pathway ID | Tissue | Disease Stage | Description | Gene Ratio | Bg Ratio | pvalue | p.adjust | qvalue | Count |
| Page: 1 |
Top |
Cell-cell communication analysis |
| Identification of potential cell-cell interactions between two cell types and their ligand-receptor pairs for different disease states |
| Ligand | Receptor | LRpair | Pathway | Tissue | Disease Stage |
| Page: 1 |
Top |
Single-cell gene regulatory network inference analysis |
| Find out the significant the regulons (TFs) and the target genes of each regulon across cell types for different disease states |
| TF | Cell Type | Tissue | Disease Stage | Target Gene | RSS | Regulon Activity |
| ∗The dot plots of a searched regulon are shown for all cell subpopulations in each disease state of each tissue based on the regulon specific score inferred using pySCENIC and by calculating the average expression. |
| Page: 1 |
Top |
Somatic mutation of malignant transformation related genes |
| Annotation of somatic variants for genes involved in malignant transformation |
| Hugo Symbol | Variant Class | Variant Classification | dbSNP RS | HGVSc | HGVSp | HGVSp Short | SWISSPROT | BIOTYPE | SIFT | PolyPhen | Tumor Sample Barcode | Tissue | Histology | Sex | Age | Stage | Therapy Types | Drugs | Outcome |
| KAT8 | SNV | Missense_Mutation | novel | c.876C>A | p.Asp292Glu | p.D292E | Q9H7Z6 | protein_coding | deleterious(0) | possibly_damaging(0.737) | TCGA-A8-A082-01 | Breast | breast invasive carcinoma | Female | <65 | I/II | Chemotherapy | 5-fluorouracil | CR |
| KAT8 | SNV | Missense_Mutation | c.254N>A | p.Gly85Asp | p.G85D | Q9H7Z6 | protein_coding | tolerated(0.12) | benign(0.001) | TCGA-AN-A04C-01 | Breast | breast invasive carcinoma | Female | <65 | I/II | Unknown | Unknown | SD | |
| KAT8 | SNV | Missense_Mutation | c.515N>T | p.Ala172Val | p.A172V | Q9H7Z6 | protein_coding | tolerated(0.07) | possibly_damaging(0.75) | TCGA-BH-A203-01 | Breast | breast invasive carcinoma | Female | >=65 | I/II | Unknown | Unknown | PD | |
| KAT8 | SNV | Missense_Mutation | c.1019N>T | p.Ser340Phe | p.S340F | Q9H7Z6 | protein_coding | deleterious(0) | probably_damaging(0.997) | TCGA-D8-A27L-01 | Breast | breast invasive carcinoma | Female | <65 | III/IV | Chemotherapy | adriamycin+cuclophosphamide | SD | |
| KAT8 | SNV | Missense_Mutation | c.670C>G | p.Arg224Gly | p.R224G | Q9H7Z6 | protein_coding | tolerated(0.09) | possibly_damaging(0.621) | TCGA-E9-A1RC-01 | Breast | breast invasive carcinoma | Female | <65 | III/IV | Hormone Therapy | tamoxiphen | SD | |
| KAT8 | insertion | In_Frame_Ins | novel | c.360_361insCTC | p.Gln120_Lys121insLeu | p.Q120_K121insL | Q9H7Z6 | protein_coding | TCGA-AO-A03R-01 | Breast | breast invasive carcinoma | Female | <65 | I/II | Chemotherapy | doxorubicin | SD | ||
| KAT8 | insertion | Frame_Shift_Ins | novel | c.362_363insGT | p.Asn122Ter | p.N122* | Q9H7Z6 | protein_coding | TCGA-AO-A03R-01 | Breast | breast invasive carcinoma | Female | <65 | I/II | Chemotherapy | doxorubicin | SD | ||
| KAT8 | deletion | Frame_Shift_Del | novel | c.347delA | p.Lys116ArgfsTer12 | p.K116Rfs*12 | Q9H7Z6 | protein_coding | TCGA-EW-A2FV-01 | Breast | breast invasive carcinoma | Female | <65 | III/IV | Chemotherapy | docetaxel | SD | ||
| KAT8 | SNV | Missense_Mutation | c.868G>C | p.Glu290Gln | p.E290Q | Q9H7Z6 | protein_coding | deleterious(0) | probably_damaging(0.975) | TCGA-C5-A1BK-01 | Cervix | cervical & endocervical cancer | Female | <65 | I/II | Unknown | Unknown | SD | |
| KAT8 | SNV | Missense_Mutation | novel | c.403G>A | p.Glu135Lys | p.E135K | Q9H7Z6 | protein_coding | tolerated(0.1) | benign(0.023) | TCGA-VS-A9U7-01 | Cervix | cervical & endocervical cancer | Female | <65 | I/II | Chemotherapy | cisplatin | CR |
| Page: 1 2 3 4 5 6 7 |
Top |
Related drugs of malignant transformation related genes |
| Identification of chemicals and drugs interact with genes involved in malignant transfromation |
| (DGIdb 4.0) |
| Entrez ID | Symbol | Category | Interaction Types | Drug Claim Name | Drug Name | PMIDs |
| 84148 | KAT8 | ENZYME | inhibitor | 187051791 |
| Page: 1 |

Copyright 2023-Present -The University of Texas Health Science Center at Houston |