
|
|||||
|
 | |
| |
| |
| |
| |
| |
|
Gene: KAT7 |
Gene summary for KAT7 |
| Gene information | Species | Human | Gene symbol | KAT7 | Gene ID | 11143 |
| Gene name | lysine acetyltransferase 7 | |
| Gene Alias | HBO1 | |
| Cytomap | 17q21.33 | |
| Gene Type | protein-coding | GO ID | GO:0001775 | UniProtAcc | O95251 |
Top |
Malignant transformation analysis |
| Identification of the aberrant gene expression in precancerous and cancerous lesions by comparing the gene expression of stem-like cells in diseased tissues with normal stem cells |
| Entrez ID | Symbol | Replicates | Species | Organ | Tissue | Adj P-value | Log2FC | Malignancy |
| 11143 | KAT7 | LZE4T | Human | Esophagus | ESCC | 5.63e-07 | 1.54e-01 | 0.0811 |
| 11143 | KAT7 | LZE7T | Human | Esophagus | ESCC | 1.65e-06 | 2.42e-01 | 0.0667 |
| 11143 | KAT7 | LZE20T | Human | Esophagus | ESCC | 8.69e-03 | 1.06e-01 | 0.0662 |
| 11143 | KAT7 | LZE24T | Human | Esophagus | ESCC | 4.15e-15 | 4.31e-01 | 0.0596 |
| 11143 | KAT7 | LZE21T | Human | Esophagus | ESCC | 1.14e-04 | 2.18e-01 | 0.0655 |
| 11143 | KAT7 | LZE6T | Human | Esophagus | ESCC | 3.55e-07 | 1.61e-01 | 0.0845 |
| 11143 | KAT7 | P1T-E | Human | Esophagus | ESCC | 3.52e-11 | 4.36e-01 | 0.0875 |
| 11143 | KAT7 | P2T-E | Human | Esophagus | ESCC | 4.50e-27 | 5.59e-01 | 0.1177 |
| 11143 | KAT7 | P4T-E | Human | Esophagus | ESCC | 2.34e-18 | 3.05e-01 | 0.1323 |
| 11143 | KAT7 | P5T-E | Human | Esophagus | ESCC | 1.84e-23 | 2.78e-01 | 0.1327 |
| 11143 | KAT7 | P8T-E | Human | Esophagus | ESCC | 1.98e-11 | 2.93e-01 | 0.0889 |
| 11143 | KAT7 | P9T-E | Human | Esophagus | ESCC | 1.79e-04 | 1.04e-01 | 0.1131 |
| 11143 | KAT7 | P10T-E | Human | Esophagus | ESCC | 4.10e-30 | 4.92e-01 | 0.116 |
| 11143 | KAT7 | P11T-E | Human | Esophagus | ESCC | 2.77e-14 | 5.60e-01 | 0.1426 |
| 11143 | KAT7 | P12T-E | Human | Esophagus | ESCC | 1.47e-23 | 5.05e-01 | 0.1122 |
| 11143 | KAT7 | P15T-E | Human | Esophagus | ESCC | 4.78e-17 | 3.32e-01 | 0.1149 |
| 11143 | KAT7 | P16T-E | Human | Esophagus | ESCC | 2.98e-27 | 5.31e-01 | 0.1153 |
| 11143 | KAT7 | P17T-E | Human | Esophagus | ESCC | 3.28e-08 | 3.00e-01 | 0.1278 |
| 11143 | KAT7 | P19T-E | Human | Esophagus | ESCC | 1.17e-02 | 2.24e-01 | 0.1662 |
| 11143 | KAT7 | P20T-E | Human | Esophagus | ESCC | 4.56e-21 | 3.84e-01 | 0.1124 |
| Page: 1 2 3 4 5 |
| Tissue | Expression Dynamics | Abbreviation |
| Esophagus | 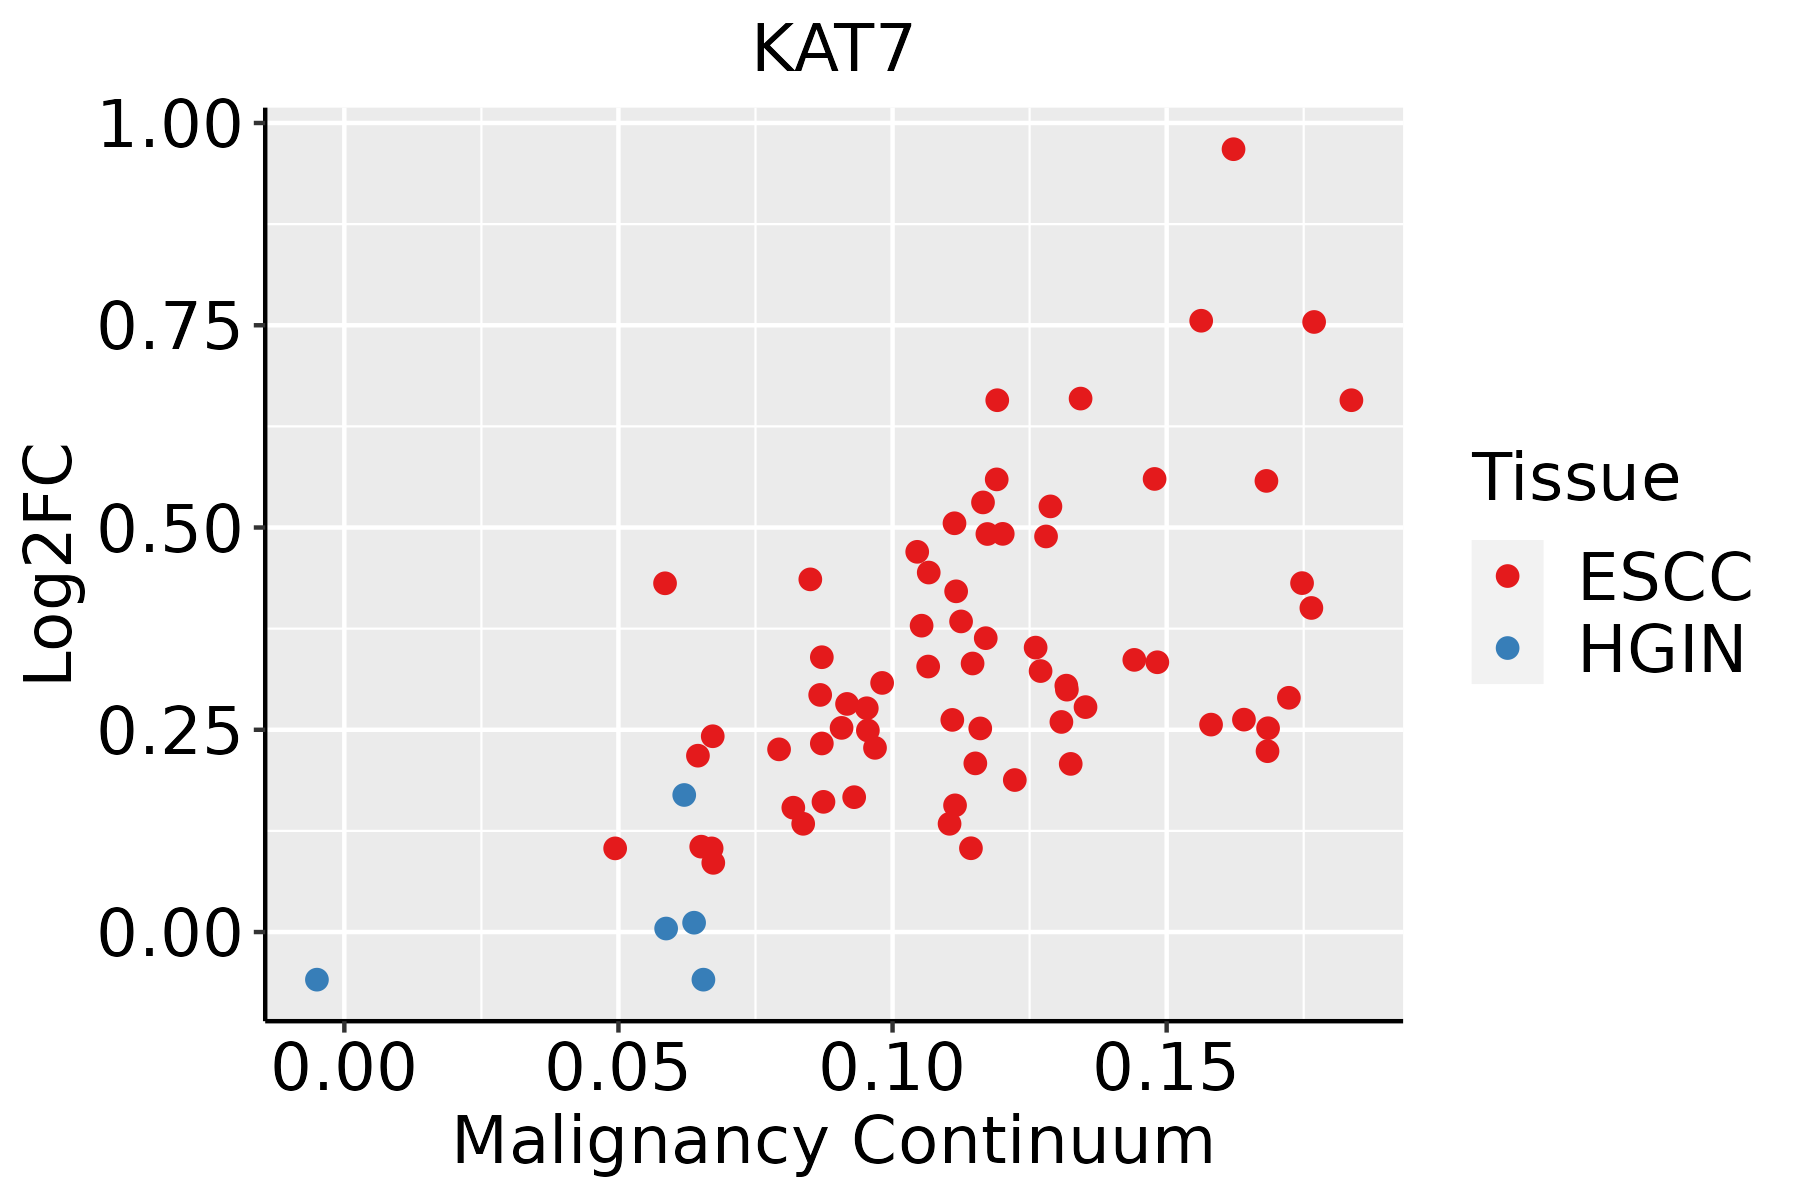 | ESCC: Esophageal squamous cell carcinoma |
| HGIN: High-grade intraepithelial neoplasias | ||
| LGIN: Low-grade intraepithelial neoplasias | ||
| Oral Cavity |  | EOLP: Erosive Oral lichen planus |
| LP: leukoplakia | ||
| NEOLP: Non-erosive oral lichen planus | ||
| OSCC: Oral squamous cell carcinoma | ||
| Thyroid | 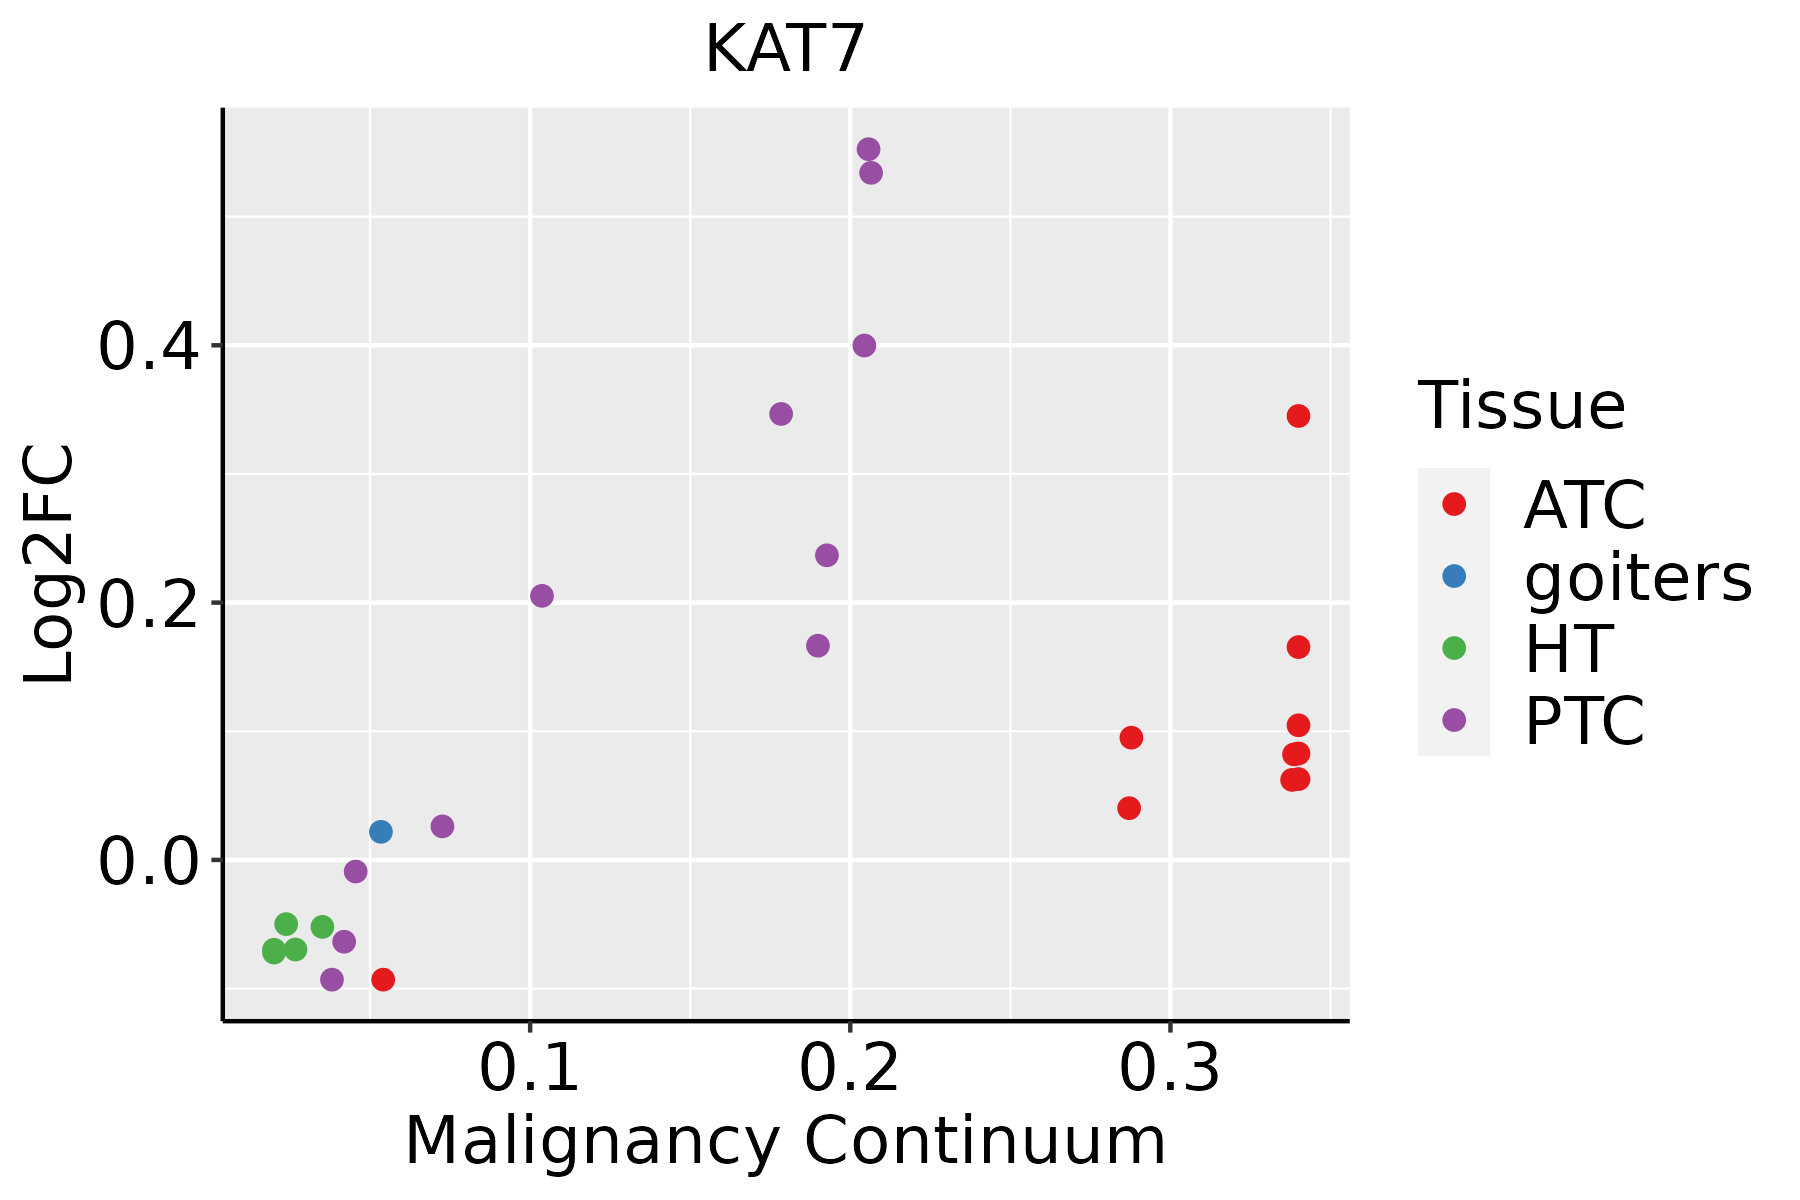 | ATC: Anaplastic thyroid cancer |
| HT: Hashimoto's thyroiditis | ||
| PTC: Papillary thyroid cancer |
| ∗log2FC in expression of this searched gene in stem-like cells from each diseased tissue sample relative to stem-like cells in normal samples in each tissue plotted against the malignancy continuum. Samples are colored based on if they are from different disease stage. |
Top |
Malignant transformation related pathway analysis |
| Find out the enriched GO biological processes and KEGG pathways involved in transition from healthy to precancer to cancer |
| Tissue | Disease Stage | Enriched GO biological Processes |
| Colorectum | AD |  |
| Colorectum | SER |  |
| Colorectum | MSS |  |
| Colorectum | MSI-H |  |
| Colorectum | FAP |  |
| ∗Top 15 enriched GO BP terms are showed in the bar plot of each disease state in each tissue. Each row represents a significant GO biological process which is colored according to the -log10(p.adjust). |
| Page: 1 2 3 4 5 6 7 8 9 |
| GO ID | Tissue | Disease Stage | Description | Gene Ratio | Bg Ratio | pvalue | p.adjust | Count |
| GO:001657015 | Esophagus | ESCC | histone modification | 323/8552 | 463/18723 | 2.61e-26 | 7.88e-24 | 323 |
| GO:003450418 | Esophagus | ESCC | protein localization to nucleus | 211/8552 | 290/18723 | 4.06e-21 | 6.60e-19 | 211 |
| GO:001820514 | Esophagus | ESCC | peptidyl-lysine modification | 259/8552 | 376/18723 | 3.90e-20 | 5.26e-18 | 259 |
| GO:1903829111 | Esophagus | ESCC | positive regulation of cellular protein localization | 199/8552 | 276/18723 | 2.99e-19 | 3.45e-17 | 199 |
| GO:00062604 | Esophagus | ESCC | DNA replication | 181/8552 | 260/18723 | 3.55e-15 | 2.05e-13 | 181 |
| GO:000635414 | Esophagus | ESCC | DNA-templated transcription, elongation | 76/8552 | 91/18723 | 8.35e-14 | 4.11e-12 | 76 |
| GO:005105215 | Esophagus | ESCC | regulation of DNA metabolic process | 232/8552 | 359/18723 | 2.40e-13 | 1.13e-11 | 232 |
| GO:001839413 | Esophagus | ESCC | peptidyl-lysine acetylation | 123/8552 | 169/18723 | 6.58e-13 | 2.94e-11 | 123 |
| GO:004354313 | Esophagus | ESCC | protein acylation | 165/8552 | 243/18723 | 1.69e-12 | 7.14e-11 | 165 |
| GO:190018018 | Esophagus | ESCC | regulation of protein localization to nucleus | 102/8552 | 136/18723 | 2.84e-12 | 1.13e-10 | 102 |
| GO:000647313 | Esophagus | ESCC | protein acetylation | 140/8552 | 201/18723 | 4.37e-12 | 1.69e-10 | 140 |
| GO:001839313 | Esophagus | ESCC | internal peptidyl-lysine acetylation | 114/8552 | 158/18723 | 1.16e-11 | 4.24e-10 | 114 |
| GO:000647513 | Esophagus | ESCC | internal protein amino acid acetylation | 115/8552 | 160/18723 | 1.43e-11 | 5.08e-10 | 115 |
| GO:00165735 | Esophagus | ESCC | histone acetylation | 110/8552 | 152/18723 | 1.95e-11 | 6.81e-10 | 110 |
| GO:190018217 | Esophagus | ESCC | positive regulation of protein localization to nucleus | 70/8552 | 87/18723 | 2.63e-11 | 8.99e-10 | 70 |
| GO:2001020110 | Esophagus | ESCC | regulation of response to DNA damage stimulus | 145/8552 | 219/18723 | 5.97e-10 | 1.50e-08 | 145 |
| GO:0030099111 | Esophagus | ESCC | myeloid cell differentiation | 232/8552 | 381/18723 | 1.22e-09 | 2.90e-08 | 232 |
| GO:003105614 | Esophagus | ESCC | regulation of histone modification | 106/8552 | 152/18723 | 1.52e-09 | 3.55e-08 | 106 |
| GO:003278412 | Esophagus | ESCC | regulation of DNA-templated transcription, elongation | 45/8552 | 53/18723 | 3.64e-09 | 7.61e-08 | 45 |
| GO:004396712 | Esophagus | ESCC | histone H4 acetylation | 53/8552 | 67/18723 | 2.11e-08 | 4.03e-07 | 53 |
| Page: 1 2 3 4 5 6 7 8 9 |
| Pathway ID | Tissue | Disease Stage | Description | Gene Ratio | Bg Ratio | pvalue | p.adjust | qvalue | Count |
| Page: 1 |
Top |
Cell-cell communication analysis |
| Identification of potential cell-cell interactions between two cell types and their ligand-receptor pairs for different disease states |
| Ligand | Receptor | LRpair | Pathway | Tissue | Disease Stage |
| Page: 1 |
Top |
Single-cell gene regulatory network inference analysis |
| Find out the significant the regulons (TFs) and the target genes of each regulon across cell types for different disease states |
| TF | Cell Type | Tissue | Disease Stage | Target Gene | RSS | Regulon Activity |
| ∗The dot plots of a searched regulon are shown for all cell subpopulations in each disease state of each tissue based on the regulon specific score inferred using pySCENIC and by calculating the average expression. |
| Page: 1 |
Top |
Somatic mutation of malignant transformation related genes |
| Annotation of somatic variants for genes involved in malignant transformation |
| Hugo Symbol | Variant Class | Variant Classification | dbSNP RS | HGVSc | HGVSp | HGVSp Short | SWISSPROT | BIOTYPE | SIFT | PolyPhen | Tumor Sample Barcode | Tissue | Histology | Sex | Age | Stage | Therapy Types | Drugs | Outcome |
| KAT7 | SNV | Missense_Mutation | c.1558N>T | p.Arg520Cys | p.R520C | O95251 | protein_coding | deleterious(0) | probably_damaging(1) | TCGA-A8-A08L-01 | Breast | breast invasive carcinoma | Female | >=65 | III/IV | Unknown | Unknown | SD | |
| KAT7 | SNV | Missense_Mutation | c.134N>T | p.Ser45Phe | p.S45F | O95251 | protein_coding | deleterious_low_confidence(0) | benign(0.276) | TCGA-AC-A23H-01 | Breast | breast invasive carcinoma | Female | >=65 | I/II | Unknown | Unknown | PD | |
| KAT7 | SNV | Missense_Mutation | c.1632N>G | p.Ile544Met | p.I544M | O95251 | protein_coding | tolerated(0.07) | probably_damaging(0.967) | TCGA-AC-A23H-01 | Breast | breast invasive carcinoma | Female | >=65 | I/II | Unknown | Unknown | PD | |
| KAT7 | SNV | Missense_Mutation | novel | c.895N>C | p.Glu299Gln | p.E299Q | O95251 | protein_coding | tolerated(0.16) | possibly_damaging(0.786) | TCGA-AC-A3W5-01 | Breast | breast invasive carcinoma | Female | >=65 | I/II | Chemotherapy | docetaxel | CR |
| KAT7 | SNV | Missense_Mutation | novel | c.1607G>C | p.Gly536Ala | p.G536A | O95251 | protein_coding | tolerated(0.07) | benign(0.067) | TCGA-AC-A8OP-01 | Breast | breast invasive carcinoma | Female | >=65 | I/II | Unknown | Unknown | SD |
| KAT7 | insertion | Nonsense_Mutation | novel | c.106_107insATTGAA | p.Ser36delinsTyrTerThr | p.S36delinsY*T | O95251 | protein_coding | TCGA-A8-A08H-01 | Breast | breast invasive carcinoma | Female | >=65 | I/II | Unknown | Unknown | SD | ||
| KAT7 | insertion | Nonsense_Mutation | novel | c.107_108insAAAAGCTACTCTAAGTTAAATGAGGTCCAGCA | p.Arg37LysfsTer6 | p.R37Kfs*6 | O95251 | protein_coding | TCGA-A8-A08H-01 | Breast | breast invasive carcinoma | Female | >=65 | I/II | Unknown | Unknown | SD | ||
| KAT7 | SNV | Missense_Mutation | c.53C>T | p.Ser18Phe | p.S18F | O95251 | protein_coding | deleterious_low_confidence(0) | probably_damaging(0.991) | TCGA-LP-A4AV-01 | Cervix | cervical & endocervical cancer | Female | <65 | I/II | Unknown | Unknown | SD | |
| KAT7 | SNV | Missense_Mutation | c.843N>T | p.Glu281Asp | p.E281D | O95251 | protein_coding | tolerated(0.28) | benign(0.003) | TCGA-AA-3510-01 | Colorectum | colon adenocarcinoma | Male | >=65 | I/II | Unknown | Unknown | SD | |
| KAT7 | SNV | Missense_Mutation | rs769376467 | c.1525N>T | p.Arg509Cys | p.R509C | O95251 | protein_coding | deleterious(0) | possibly_damaging(0.495) | TCGA-AA-3713-01 | Colorectum | colon adenocarcinoma | Male | >=65 | III/IV | Chemotherapy | 5-fluorouracil | PR |
| Page: 1 2 3 4 5 6 7 8 9 |
Top |
Related drugs of malignant transformation related genes |
| Identification of chemicals and drugs interact with genes involved in malignant transfromation |
| (DGIdb 4.0) |
| Entrez ID | Symbol | Category | Interaction Types | Drug Claim Name | Drug Name | PMIDs |
| Page: 1 |

Copyright 2023-Present -The University of Texas Health Science Center at Houston |