
|
|||||
|
 | |
| |
| |
| |
| |
| |
|
Gene: KAT6B |
Gene summary for KAT6B |
| Gene information | Species | Human | Gene symbol | KAT6B | Gene ID | 23522 |
| Gene name | lysine acetyltransferase 6B | |
| Gene Alias | GTPTS | |
| Cytomap | 10q22.2 | |
| Gene Type | protein-coding | GO ID | GO:0006139 | UniProtAcc | B2RWN8 |
Top |
Malignant transformation analysis |
| Identification of the aberrant gene expression in precancerous and cancerous lesions by comparing the gene expression of stem-like cells in diseased tissues with normal stem cells |
| Entrez ID | Symbol | Replicates | Species | Organ | Tissue | Adj P-value | Log2FC | Malignancy |
| 23522 | KAT6B | LZE4T | Human | Esophagus | ESCC | 6.87e-24 | 7.09e-01 | 0.0811 |
| 23522 | KAT6B | LZE7T | Human | Esophagus | ESCC | 3.90e-08 | 2.46e-01 | 0.0667 |
| 23522 | KAT6B | LZE8T | Human | Esophagus | ESCC | 8.62e-12 | 2.06e-01 | 0.067 |
| 23522 | KAT6B | LZE20T | Human | Esophagus | ESCC | 1.40e-04 | 9.75e-02 | 0.0662 |
| 23522 | KAT6B | LZE22T | Human | Esophagus | ESCC | 8.98e-03 | 1.87e-01 | 0.068 |
| 23522 | KAT6B | LZE24T | Human | Esophagus | ESCC | 9.47e-18 | 5.58e-01 | 0.0596 |
| 23522 | KAT6B | P1T-E | Human | Esophagus | ESCC | 2.70e-02 | 4.64e-01 | 0.0875 |
| 23522 | KAT6B | P2T-E | Human | Esophagus | ESCC | 6.32e-32 | 6.39e-01 | 0.1177 |
| 23522 | KAT6B | P4T-E | Human | Esophagus | ESCC | 3.44e-16 | 4.38e-01 | 0.1323 |
| 23522 | KAT6B | P5T-E | Human | Esophagus | ESCC | 2.05e-11 | 1.98e-01 | 0.1327 |
| 23522 | KAT6B | P8T-E | Human | Esophagus | ESCC | 7.09e-17 | 3.66e-01 | 0.0889 |
| 23522 | KAT6B | P9T-E | Human | Esophagus | ESCC | 3.82e-11 | 2.29e-01 | 0.1131 |
| 23522 | KAT6B | P10T-E | Human | Esophagus | ESCC | 7.33e-18 | 4.02e-01 | 0.116 |
| 23522 | KAT6B | P11T-E | Human | Esophagus | ESCC | 1.23e-10 | 6.56e-01 | 0.1426 |
| 23522 | KAT6B | P12T-E | Human | Esophagus | ESCC | 3.36e-27 | 5.78e-01 | 0.1122 |
| 23522 | KAT6B | P15T-E | Human | Esophagus | ESCC | 4.80e-21 | 6.19e-01 | 0.1149 |
| 23522 | KAT6B | P16T-E | Human | Esophagus | ESCC | 7.91e-31 | 5.82e-01 | 0.1153 |
| 23522 | KAT6B | P20T-E | Human | Esophagus | ESCC | 2.99e-25 | 5.00e-01 | 0.1124 |
| 23522 | KAT6B | P21T-E | Human | Esophagus | ESCC | 8.47e-18 | 4.14e-01 | 0.1617 |
| 23522 | KAT6B | P22T-E | Human | Esophagus | ESCC | 5.28e-12 | 2.29e-01 | 0.1236 |
| Page: 1 2 3 4 5 6 |
| Tissue | Expression Dynamics | Abbreviation |
| Esophagus | 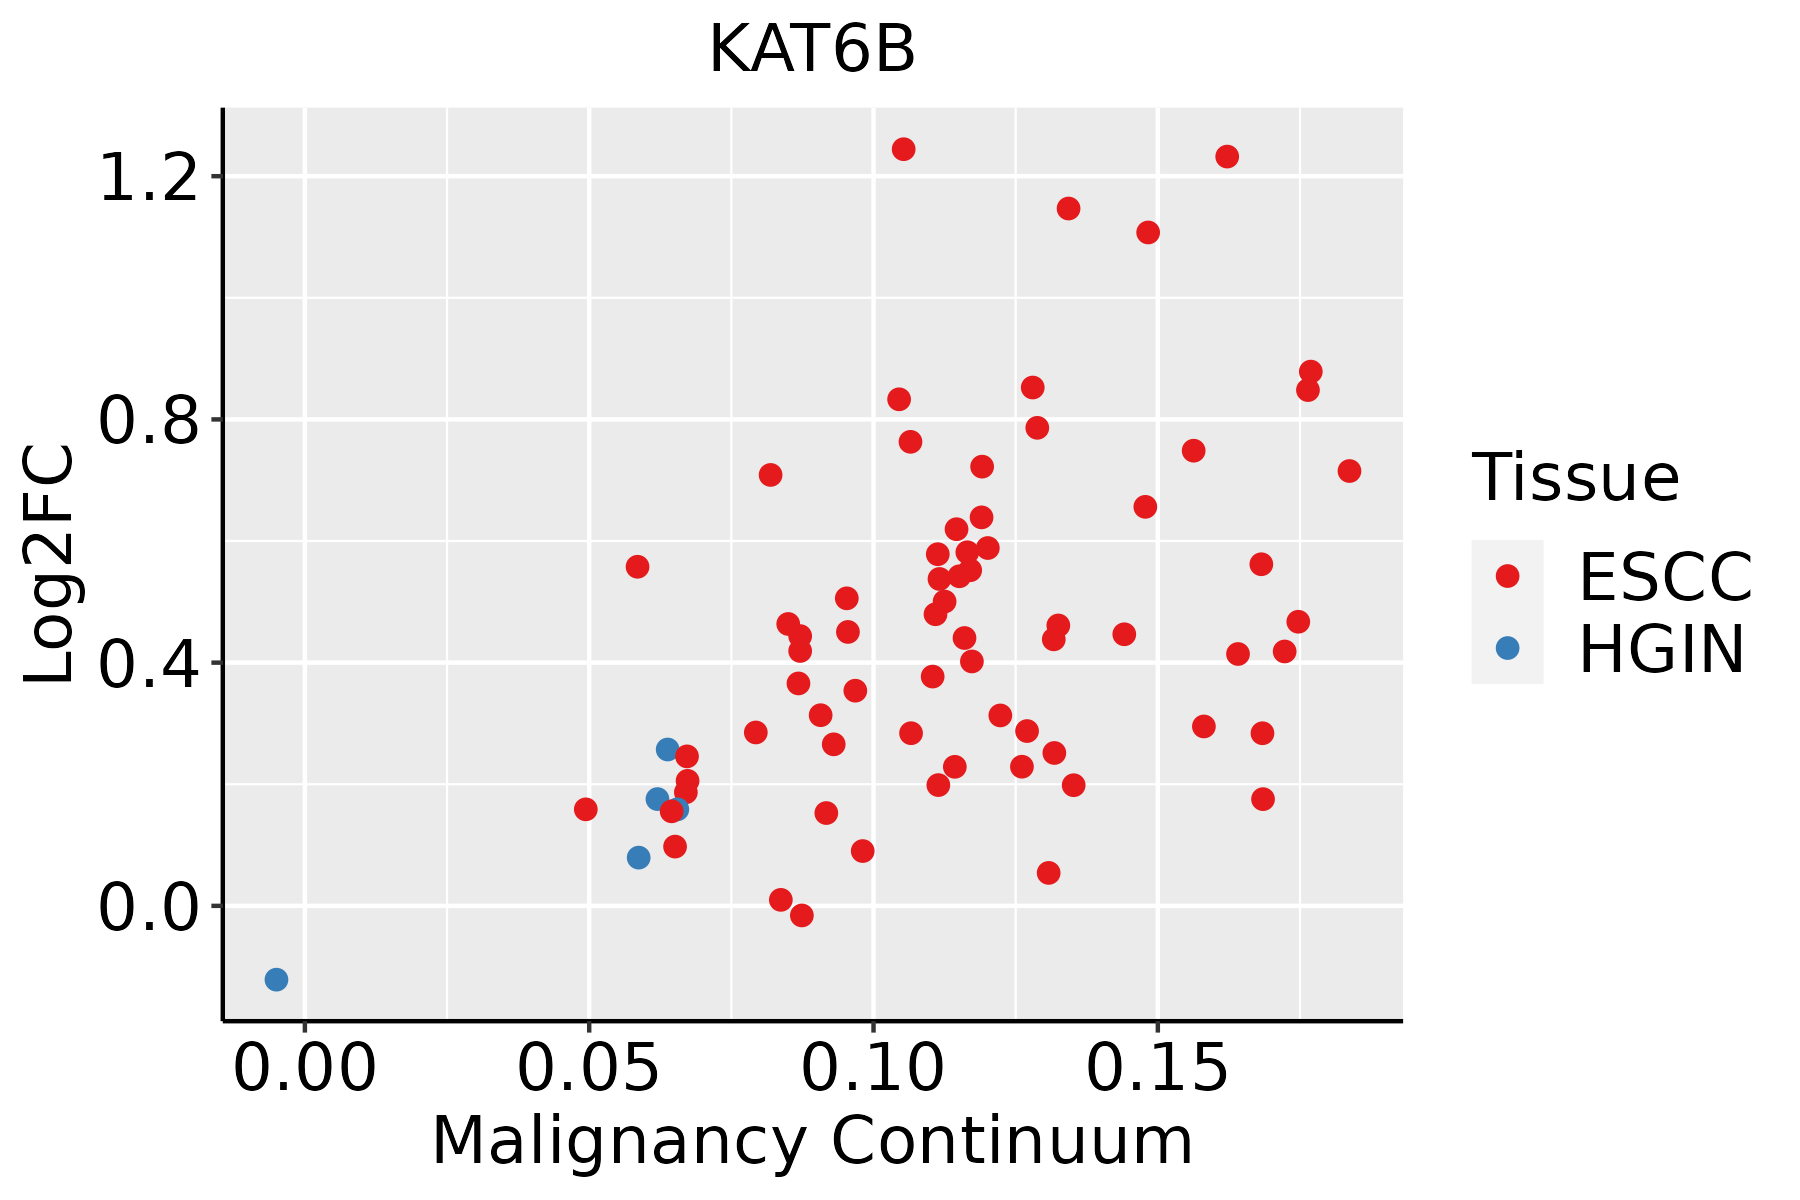 | ESCC: Esophageal squamous cell carcinoma |
| HGIN: High-grade intraepithelial neoplasias | ||
| LGIN: Low-grade intraepithelial neoplasias | ||
| Liver | 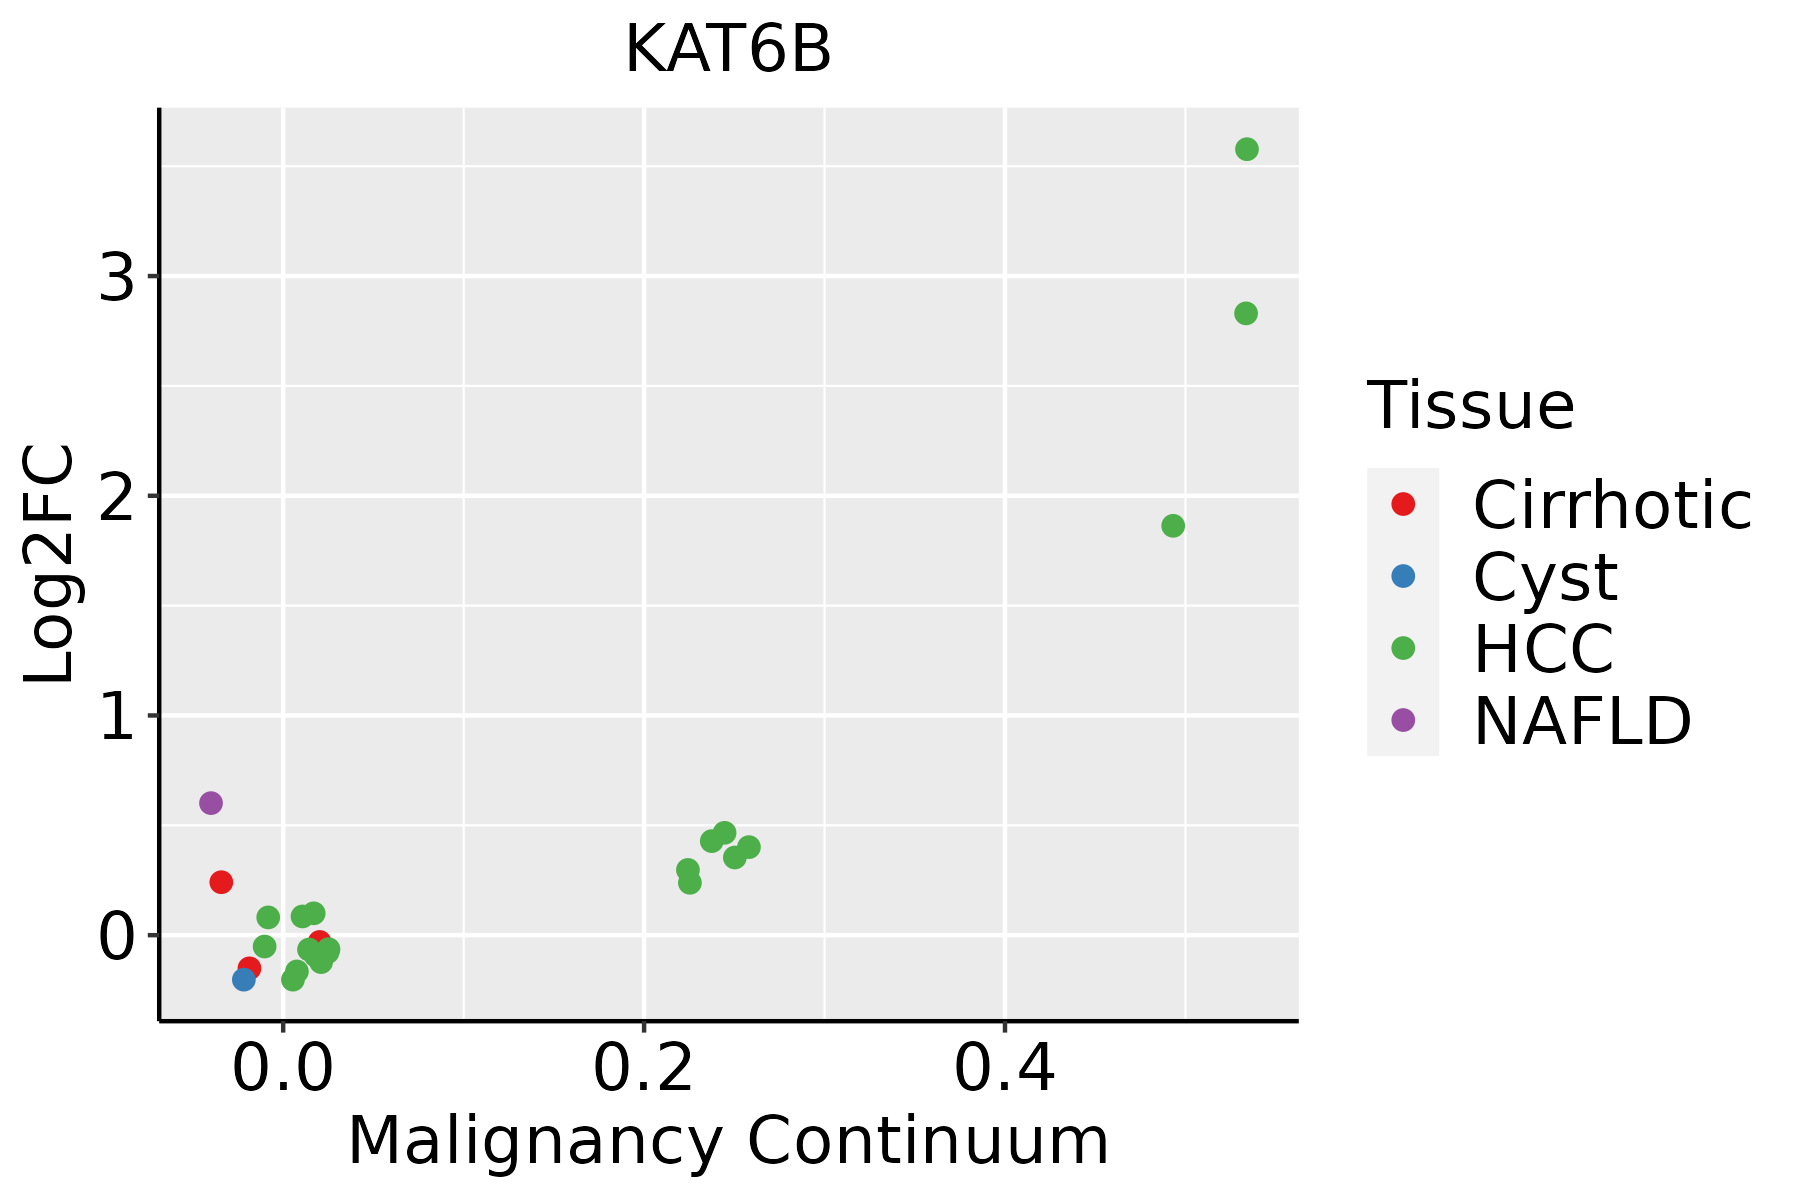 | HCC: Hepatocellular carcinoma |
| NAFLD: Non-alcoholic fatty liver disease | ||
| Lung |  | AAH: Atypical adenomatous hyperplasia |
| AIS: Adenocarcinoma in situ | ||
| IAC: Invasive lung adenocarcinoma | ||
| MIA: Minimally invasive adenocarcinoma | ||
| Prostate | 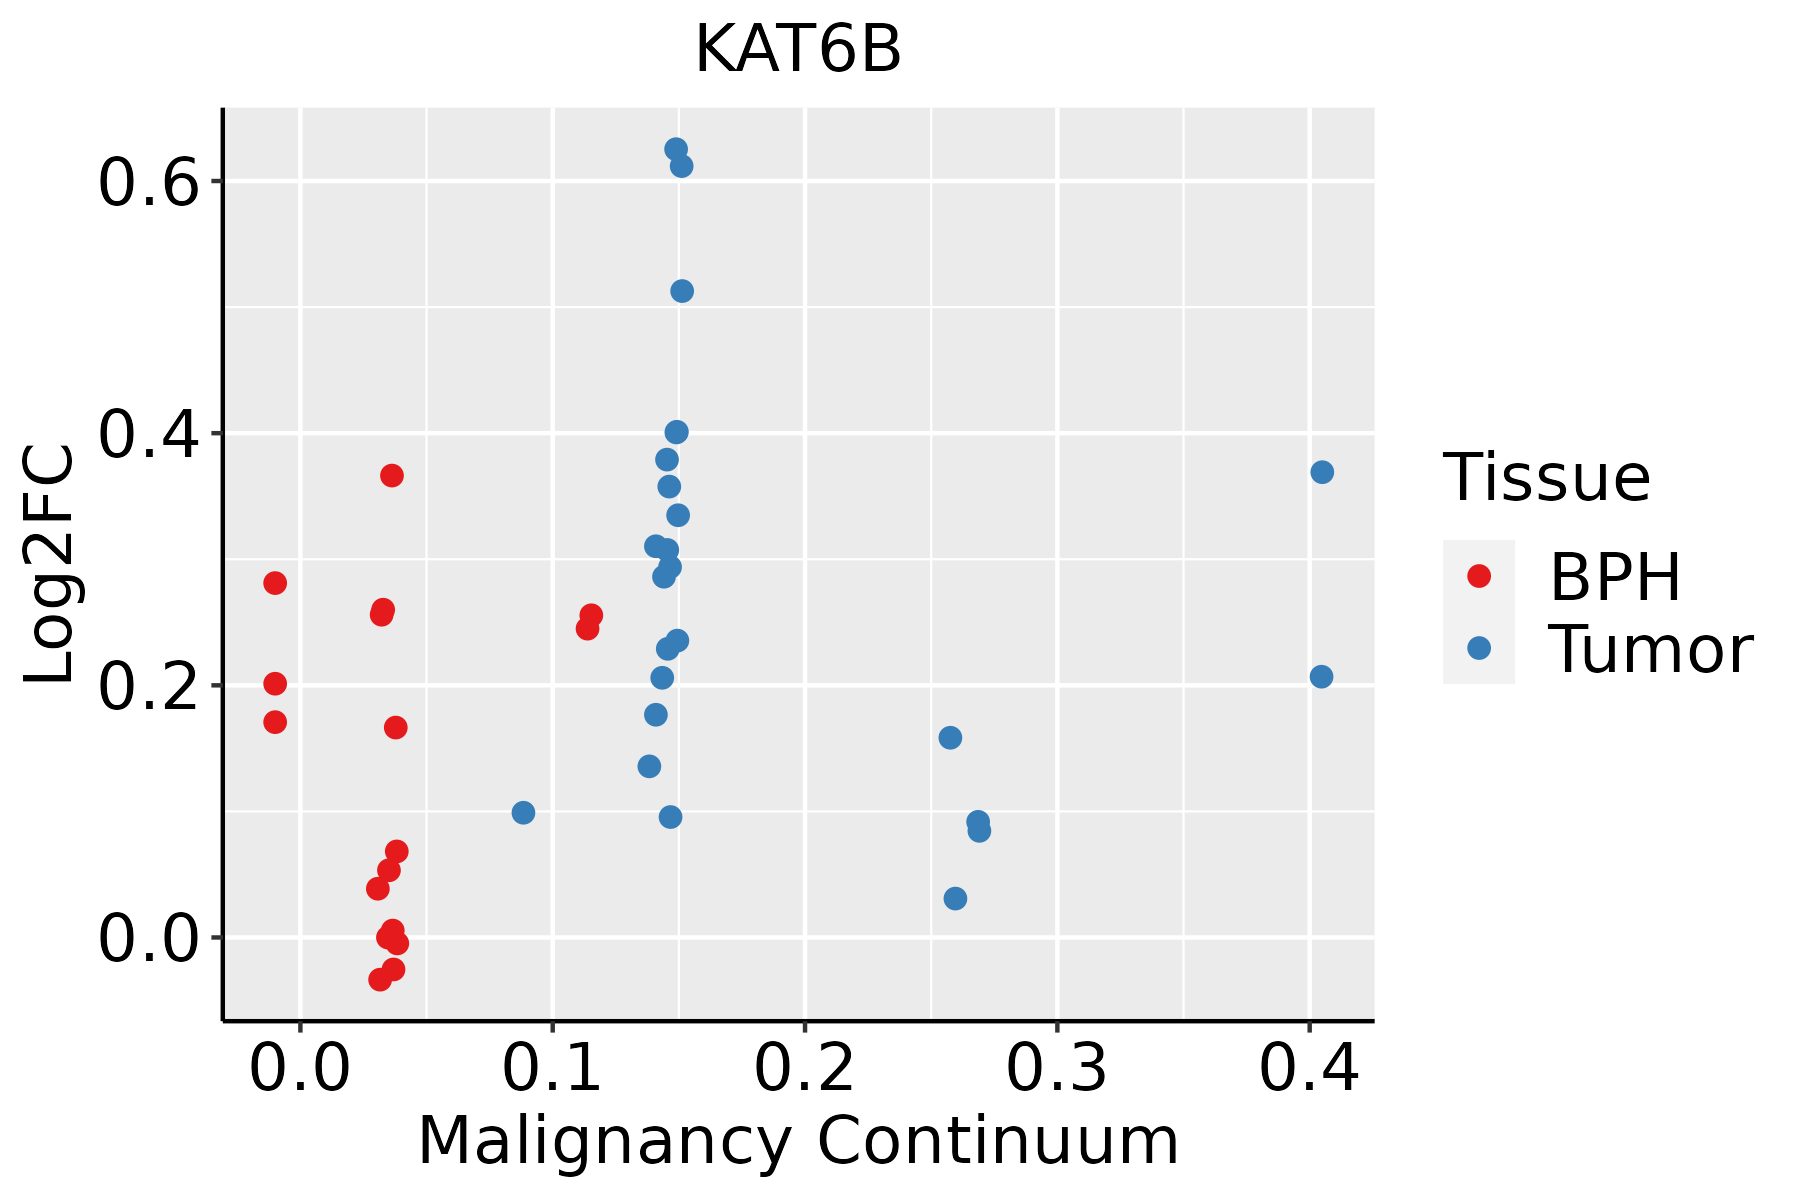 | BPH: Benign Prostatic Hyperplasia |
| Thyroid | 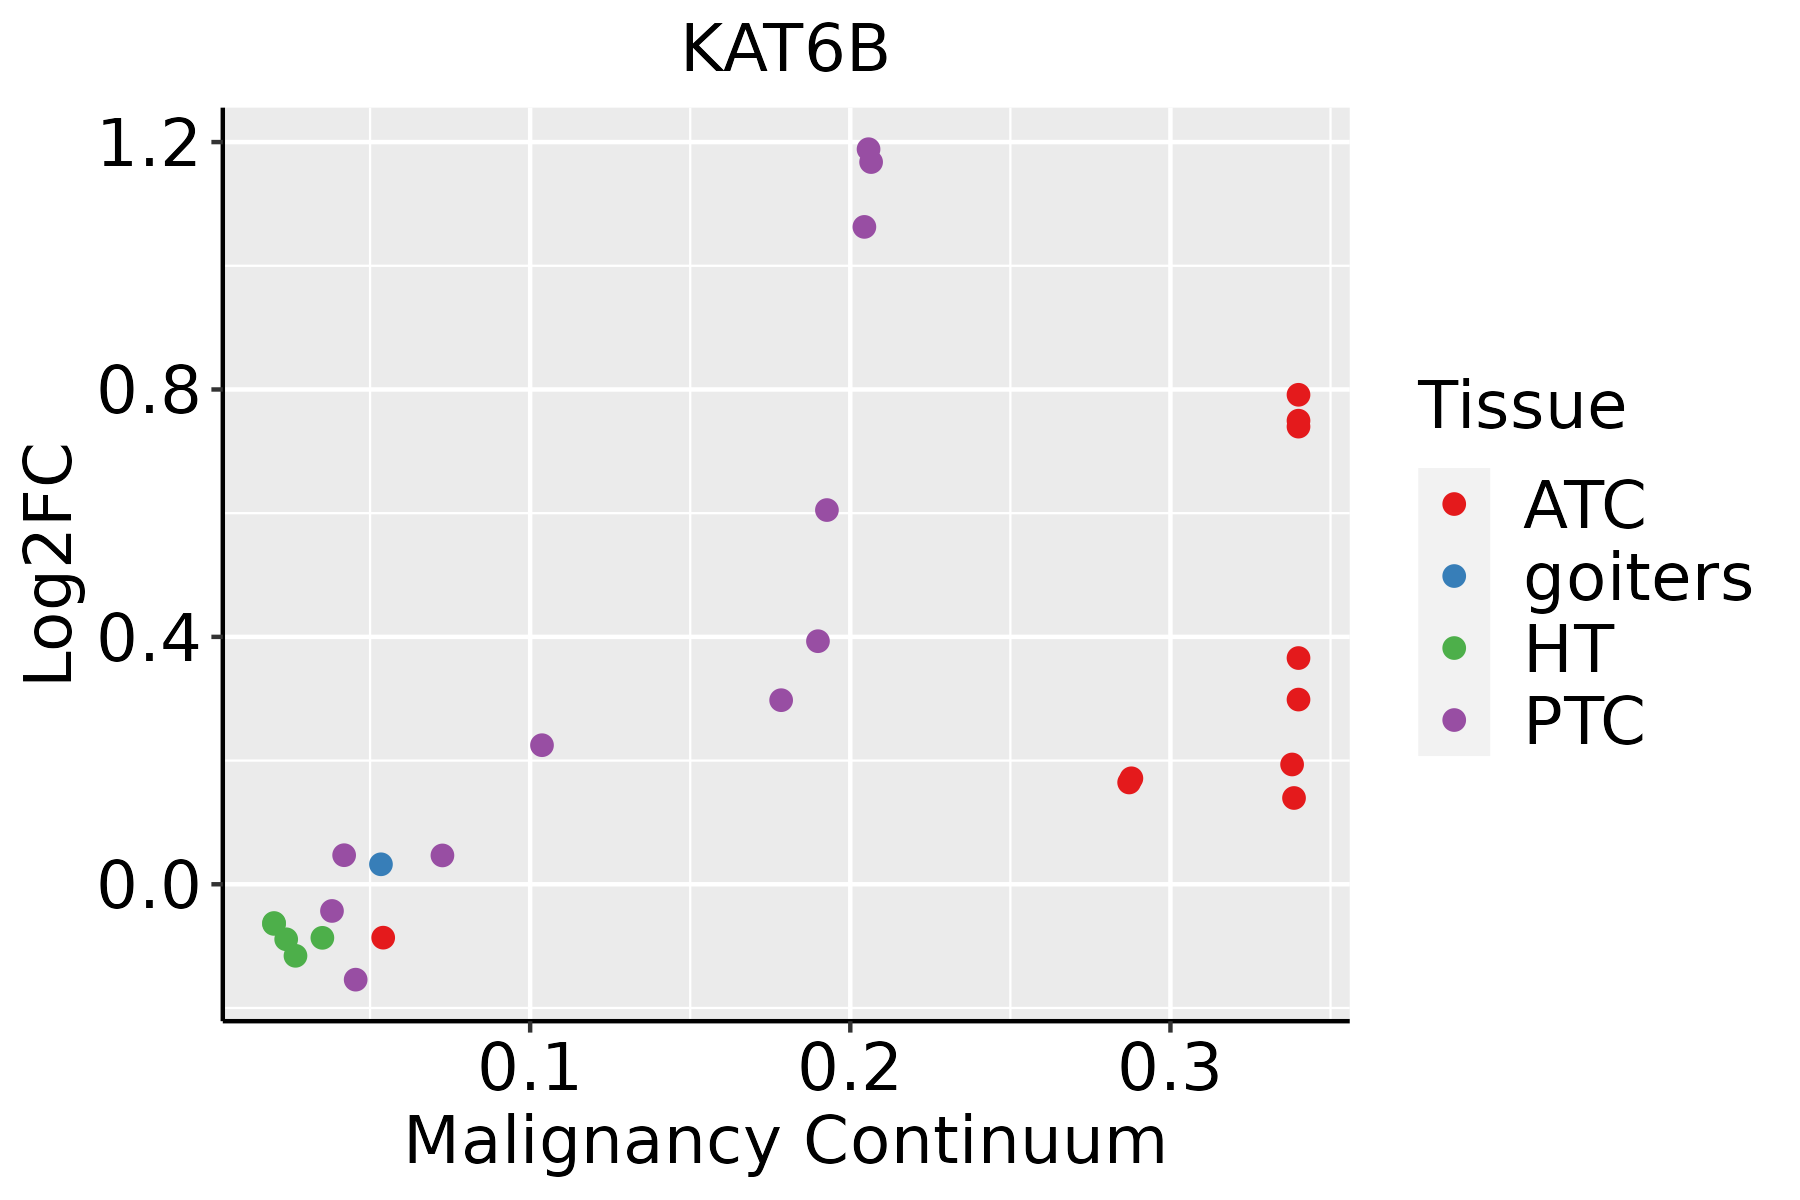 | ATC: Anaplastic thyroid cancer |
| HT: Hashimoto's thyroiditis | ||
| PTC: Papillary thyroid cancer |
| ∗log2FC in expression of this searched gene in stem-like cells from each diseased tissue sample relative to stem-like cells in normal samples in each tissue plotted against the malignancy continuum. Samples are colored based on if they are from different disease stage. |
Top |
Malignant transformation related pathway analysis |
| Find out the enriched GO biological processes and KEGG pathways involved in transition from healthy to precancer to cancer |
| Tissue | Disease Stage | Enriched GO biological Processes |
| Colorectum | AD |  |
| Colorectum | SER |  |
| Colorectum | MSS |  |
| Colorectum | MSI-H |  |
| Colorectum | FAP |  |
| ∗Top 15 enriched GO BP terms are showed in the bar plot of each disease state in each tissue. Each row represents a significant GO biological process which is colored according to the -log10(p.adjust). |
| Page: 1 2 3 4 5 6 7 8 9 |
| GO ID | Tissue | Disease Stage | Description | Gene Ratio | Bg Ratio | pvalue | p.adjust | Count |
| GO:001657015 | Esophagus | ESCC | histone modification | 323/8552 | 463/18723 | 2.61e-26 | 7.88e-24 | 323 |
| GO:001820514 | Esophagus | ESCC | peptidyl-lysine modification | 259/8552 | 376/18723 | 3.90e-20 | 5.26e-18 | 259 |
| GO:001839413 | Esophagus | ESCC | peptidyl-lysine acetylation | 123/8552 | 169/18723 | 6.58e-13 | 2.94e-11 | 123 |
| GO:004354313 | Esophagus | ESCC | protein acylation | 165/8552 | 243/18723 | 1.69e-12 | 7.14e-11 | 165 |
| GO:000647313 | Esophagus | ESCC | protein acetylation | 140/8552 | 201/18723 | 4.37e-12 | 1.69e-10 | 140 |
| GO:001839313 | Esophagus | ESCC | internal peptidyl-lysine acetylation | 114/8552 | 158/18723 | 1.16e-11 | 4.24e-10 | 114 |
| GO:000647513 | Esophagus | ESCC | internal protein amino acid acetylation | 115/8552 | 160/18723 | 1.43e-11 | 5.08e-10 | 115 |
| GO:00165735 | Esophagus | ESCC | histone acetylation | 110/8552 | 152/18723 | 1.95e-11 | 6.81e-10 | 110 |
| GO:000632517 | Esophagus | ESCC | chromatin organization | 240/8552 | 409/18723 | 6.52e-08 | 1.14e-06 | 240 |
| GO:00439662 | Esophagus | ESCC | histone H3 acetylation | 43/8552 | 61/18723 | 7.57e-05 | 5.67e-04 | 43 |
| GO:00165703 | Liver | NAFLD | histone modification | 90/1882 | 463/18723 | 5.74e-10 | 1.28e-07 | 90 |
| GO:0018205 | Liver | NAFLD | peptidyl-lysine modification | 65/1882 | 376/18723 | 9.42e-06 | 3.02e-04 | 65 |
| GO:0043543 | Liver | NAFLD | protein acylation | 43/1882 | 243/18723 | 1.70e-04 | 3.07e-03 | 43 |
| GO:0006473 | Liver | NAFLD | protein acetylation | 37/1882 | 201/18723 | 2.10e-04 | 3.61e-03 | 37 |
| GO:00063255 | Liver | NAFLD | chromatin organization | 64/1882 | 409/18723 | 2.31e-04 | 3.89e-03 | 64 |
| GO:0018394 | Liver | NAFLD | peptidyl-lysine acetylation | 32/1882 | 169/18723 | 3.24e-04 | 5.00e-03 | 32 |
| GO:0018393 | Liver | NAFLD | internal peptidyl-lysine acetylation | 28/1882 | 158/18723 | 2.10e-03 | 2.06e-02 | 28 |
| GO:0006475 | Liver | NAFLD | internal protein amino acid acetylation | 28/1882 | 160/18723 | 2.54e-03 | 2.36e-02 | 28 |
| GO:0016573 | Liver | NAFLD | histone acetylation | 26/1882 | 152/18723 | 4.85e-03 | 3.84e-02 | 26 |
| GO:00064731 | Liver | Cirrhotic | protein acetylation | 84/4634 | 201/18723 | 7.50e-08 | 2.25e-06 | 84 |
| Page: 1 2 3 4 5 |
| Pathway ID | Tissue | Disease Stage | Description | Gene Ratio | Bg Ratio | pvalue | p.adjust | qvalue | Count |
| Page: 1 |
Top |
Cell-cell communication analysis |
| Identification of potential cell-cell interactions between two cell types and their ligand-receptor pairs for different disease states |
| Ligand | Receptor | LRpair | Pathway | Tissue | Disease Stage |
| Page: 1 |
Top |
Single-cell gene regulatory network inference analysis |
| Find out the significant the regulons (TFs) and the target genes of each regulon across cell types for different disease states |
| TF | Cell Type | Tissue | Disease Stage | Target Gene | RSS | Regulon Activity |
| ∗The dot plots of a searched regulon are shown for all cell subpopulations in each disease state of each tissue based on the regulon specific score inferred using pySCENIC and by calculating the average expression. |
| Page: 1 |
Top |
Somatic mutation of malignant transformation related genes |
| Annotation of somatic variants for genes involved in malignant transformation |
| Hugo Symbol | Variant Class | Variant Classification | dbSNP RS | HGVSc | HGVSp | HGVSp Short | SWISSPROT | BIOTYPE | SIFT | PolyPhen | Tumor Sample Barcode | Tissue | Histology | Sex | Age | Stage | Therapy Types | Drugs | Outcome |
| KAT6B | SNV | Missense_Mutation | novel | c.3693G>C | p.Leu1231Phe | p.L1231F | Q8WYB5 | protein_coding | deleterious_low_confidence(0.04) | probably_damaging(0.986) | TCGA-5L-AAT1-01 | Breast | breast invasive carcinoma | Female | <65 | III/IV | Hormone Therapy | letrozol | SD |
| KAT6B | SNV | Missense_Mutation | c.6005N>A | p.Met2002Lys | p.M2002K | Q8WYB5 | protein_coding | deleterious(0) | probably_damaging(0.956) | TCGA-A1-A0SI-01 | Breast | breast invasive carcinoma | Female | <65 | I/II | Unknown | Unknown | SD | |
| KAT6B | SNV | Missense_Mutation | c.801N>G | p.Ile267Met | p.I267M | Q8WYB5 | protein_coding | deleterious(0.01) | probably_damaging(0.996) | TCGA-A8-A081-01 | Breast | breast invasive carcinoma | Female | >=65 | I/II | Unknown | Unknown | SD | |
| KAT6B | SNV | Missense_Mutation | novel | c.3961C>G | p.Gln1321Glu | p.Q1321E | Q8WYB5 | protein_coding | tolerated_low_confidence(0.89) | benign(0.01) | TCGA-AC-A3W6-01 | Breast | breast invasive carcinoma | Female | >=65 | III/IV | Unknown | Unknown | SD |
| KAT6B | SNV | Missense_Mutation | rs773778673 | c.1786N>T | p.Arg596Trp | p.R596W | Q8WYB5 | protein_coding | deleterious_low_confidence(0.01) | probably_damaging(0.993) | TCGA-AN-A046-01 | Breast | breast invasive carcinoma | Female | >=65 | I/II | Unknown | Unknown | SD |
| KAT6B | SNV | Missense_Mutation | novel | c.1985N>C | p.Gln662Pro | p.Q662P | Q8WYB5 | protein_coding | tolerated(0.26) | benign(0.005) | TCGA-AN-A046-01 | Breast | breast invasive carcinoma | Female | >=65 | I/II | Unknown | Unknown | SD |
| KAT6B | SNV | Missense_Mutation | c.2029G>A | p.Ala677Thr | p.A677T | Q8WYB5 | protein_coding | tolerated(0.68) | benign(0) | TCGA-AN-A0AK-01 | Breast | breast invasive carcinoma | Female | >=65 | I/II | Unknown | Unknown | SD | |
| KAT6B | SNV | Missense_Mutation | rs145911926 | c.524N>G | p.Asn175Ser | p.N175S | Q8WYB5 | protein_coding | tolerated(0.54) | benign(0.112) | TCGA-AO-A03T-01 | Breast | breast invasive carcinoma | Female | <65 | I/II | Chemotherapy | cyclophosphamide | SD |
| KAT6B | SNV | Missense_Mutation | rs761606204 | c.452N>A | p.Arg151Gln | p.R151Q | Q8WYB5 | protein_coding | tolerated(0.66) | possibly_damaging(0.572) | TCGA-AO-A12D-01 | Breast | breast invasive carcinoma | Female | <65 | I/II | Chemotherapy | cyclophosphamide | SD |
| KAT6B | SNV | Missense_Mutation | c.1190N>T | p.Ser397Ile | p.S397I | Q8WYB5 | protein_coding | deleterious(0.03) | possibly_damaging(0.823) | TCGA-AR-A1AV-01 | Breast | breast invasive carcinoma | Male | >=65 | I/II | Chemotherapy | cytoxan | SD |
| Page: 1 2 3 4 5 6 7 8 9 10 11 12 13 14 15 16 |
Top |
Related drugs of malignant transformation related genes |
| Identification of chemicals and drugs interact with genes involved in malignant transfromation |
| (DGIdb 4.0) |
| Entrez ID | Symbol | Category | Interaction Types | Drug Claim Name | Drug Name | PMIDs |
| Page: 1 |

Copyright 2023-Present -The University of Texas Health Science Center at Houston |