
|
|||||
|
 | |
| |
| |
| |
| |
| |
|
Gene: KAT6A |
Gene summary for KAT6A |
| Gene information | Species | Human | Gene symbol | KAT6A | Gene ID | 7994 |
| Gene name | lysine acetyltransferase 6A | |
| Gene Alias | ARTHS | |
| Cytomap | 8p11.21 | |
| Gene Type | protein-coding | GO ID | GO:0002376 | UniProtAcc | A5PLL3 |
Top |
Malignant transformation analysis |
| Identification of the aberrant gene expression in precancerous and cancerous lesions by comparing the gene expression of stem-like cells in diseased tissues with normal stem cells |
| Entrez ID | Symbol | Replicates | Species | Organ | Tissue | Adj P-value | Log2FC | Malignancy |
| 7994 | KAT6A | CA_HPV_1 | Human | Cervix | CC | 3.14e-02 | -5.54e-02 | 0.0264 |
| 7994 | KAT6A | CCI_1 | Human | Cervix | CC | 6.23e-03 | 6.18e-01 | 0.528 |
| 7994 | KAT6A | CCI_2 | Human | Cervix | CC | 6.96e-11 | 1.33e+00 | 0.5249 |
| 7994 | KAT6A | CCI_3 | Human | Cervix | CC | 7.39e-05 | 6.00e-01 | 0.516 |
| 7994 | KAT6A | HTA11_3410_2000001011 | Human | Colorectum | AD | 1.82e-14 | -5.29e-01 | 0.0155 |
| 7994 | KAT6A | HTA11_3361_2000001011 | Human | Colorectum | AD | 5.61e-06 | -5.39e-01 | -0.1207 |
| 7994 | KAT6A | HTA11_866_2000001011 | Human | Colorectum | AD | 1.27e-02 | -3.12e-01 | -0.1001 |
| 7994 | KAT6A | HTA11_10711_2000001011 | Human | Colorectum | AD | 4.55e-04 | -4.38e-01 | 0.0338 |
| 7994 | KAT6A | HTA11_7696_3000711011 | Human | Colorectum | AD | 2.08e-03 | -3.20e-01 | 0.0674 |
| 7994 | KAT6A | A002-C-010 | Human | Colorectum | FAP | 3.24e-04 | -2.16e-01 | 0.242 |
| 7994 | KAT6A | A001-C-207 | Human | Colorectum | FAP | 9.38e-03 | -2.28e-01 | 0.1278 |
| 7994 | KAT6A | A015-C-203 | Human | Colorectum | FAP | 7.89e-26 | -4.39e-01 | -0.1294 |
| 7994 | KAT6A | A015-C-204 | Human | Colorectum | FAP | 3.22e-05 | -2.65e-01 | -0.0228 |
| 7994 | KAT6A | A014-C-040 | Human | Colorectum | FAP | 3.82e-04 | -1.51e-01 | -0.1184 |
| 7994 | KAT6A | A002-C-201 | Human | Colorectum | FAP | 3.60e-17 | -4.51e-01 | 0.0324 |
| 7994 | KAT6A | A002-C-203 | Human | Colorectum | FAP | 1.92e-04 | -1.53e-01 | 0.2786 |
| 7994 | KAT6A | A001-C-119 | Human | Colorectum | FAP | 3.22e-08 | -3.49e-01 | -0.1557 |
| 7994 | KAT6A | A001-C-108 | Human | Colorectum | FAP | 2.48e-15 | -2.40e-01 | -0.0272 |
| 7994 | KAT6A | A002-C-205 | Human | Colorectum | FAP | 1.26e-25 | -4.50e-01 | -0.1236 |
| 7994 | KAT6A | A001-C-104 | Human | Colorectum | FAP | 4.39e-08 | -2.16e-01 | 0.0184 |
| Page: 1 2 3 4 5 6 7 8 |
| Tissue | Expression Dynamics | Abbreviation |
| Cervix |  | CC: Cervix cancer |
| HSIL_HPV: HPV-infected high-grade squamous intraepithelial lesions | ||
| N_HPV: HPV-infected normal cervix | ||
| Colorectum (GSE201348) |  | FAP: Familial adenomatous polyposis |
| CRC: Colorectal cancer | ||
| Colorectum (HTA11) |  | AD: Adenomas |
| SER: Sessile serrated lesions | ||
| MSI-H: Microsatellite-high colorectal cancer | ||
| MSS: Microsatellite stable colorectal cancer | ||
| Esophagus | 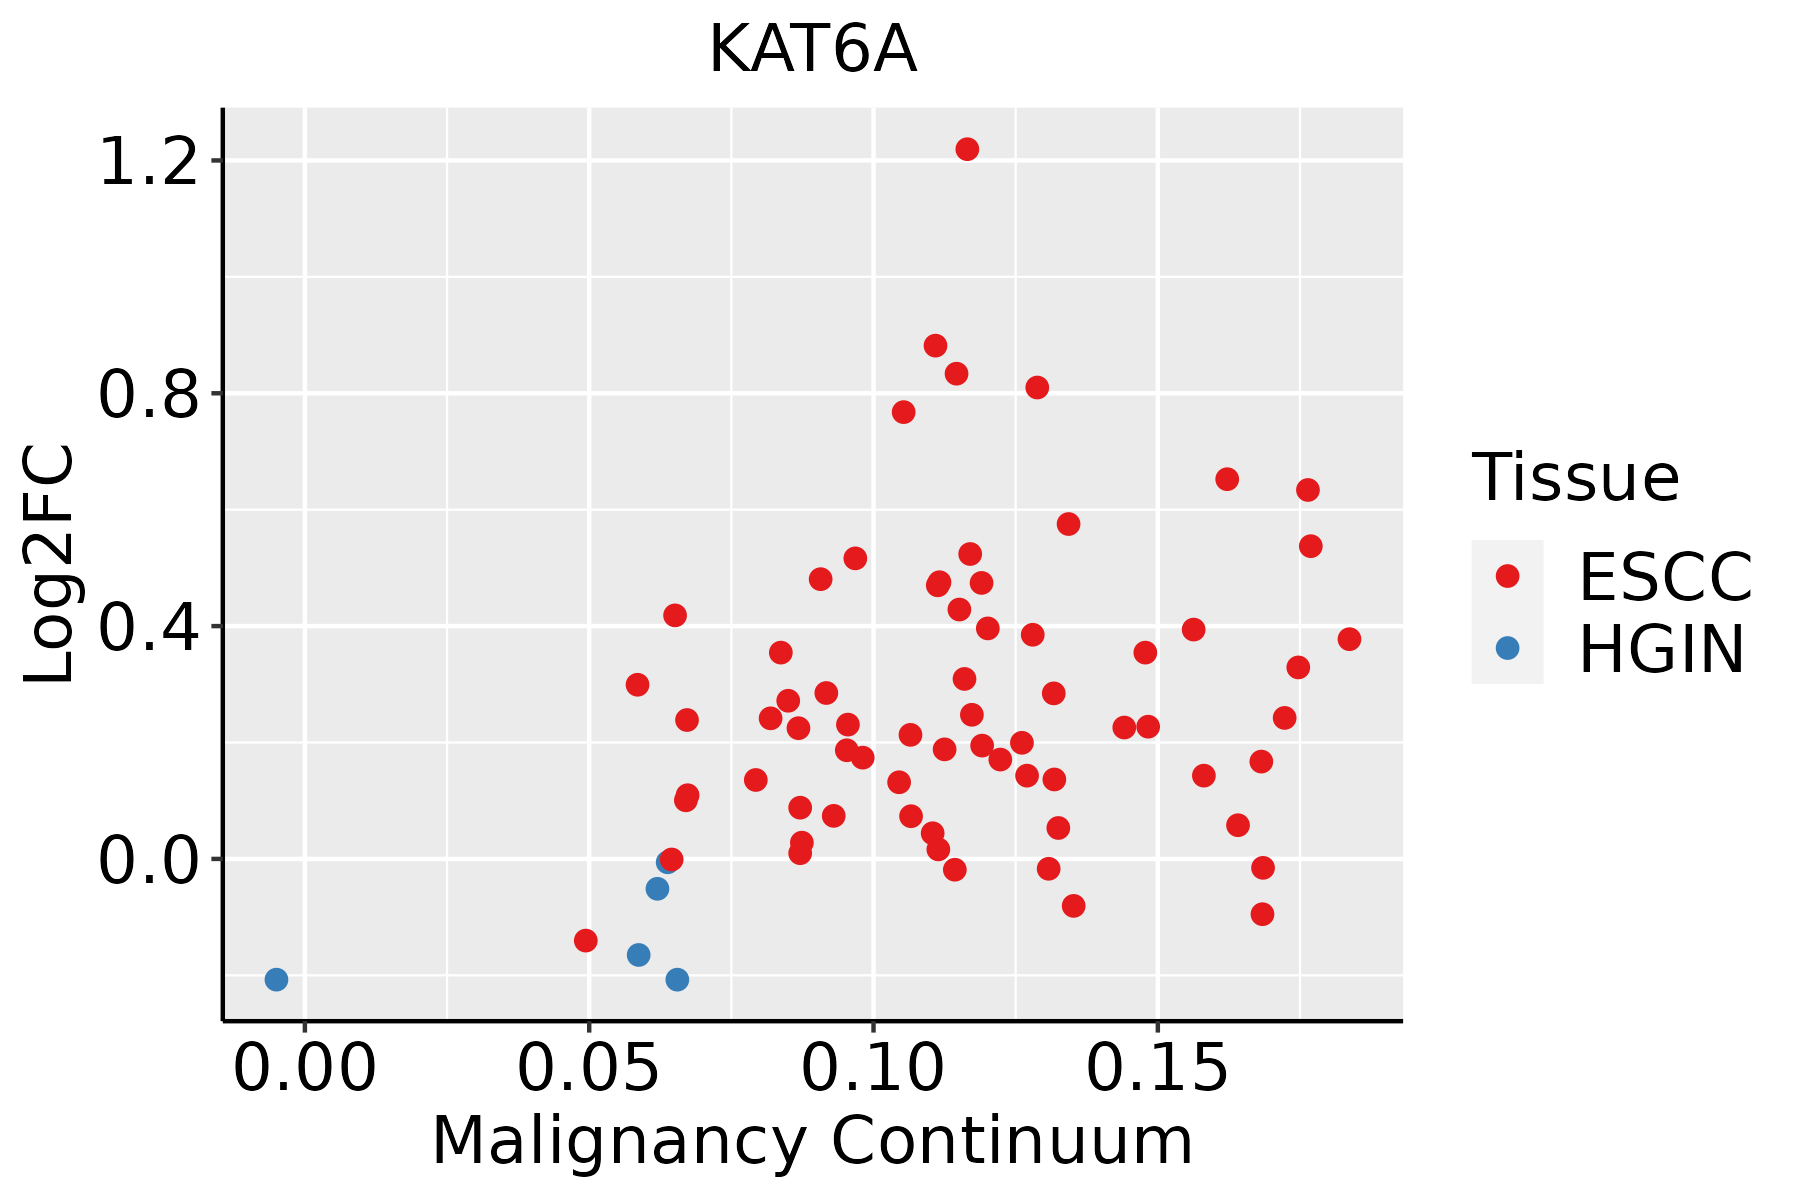 | ESCC: Esophageal squamous cell carcinoma |
| HGIN: High-grade intraepithelial neoplasias | ||
| LGIN: Low-grade intraepithelial neoplasias | ||
| Liver | 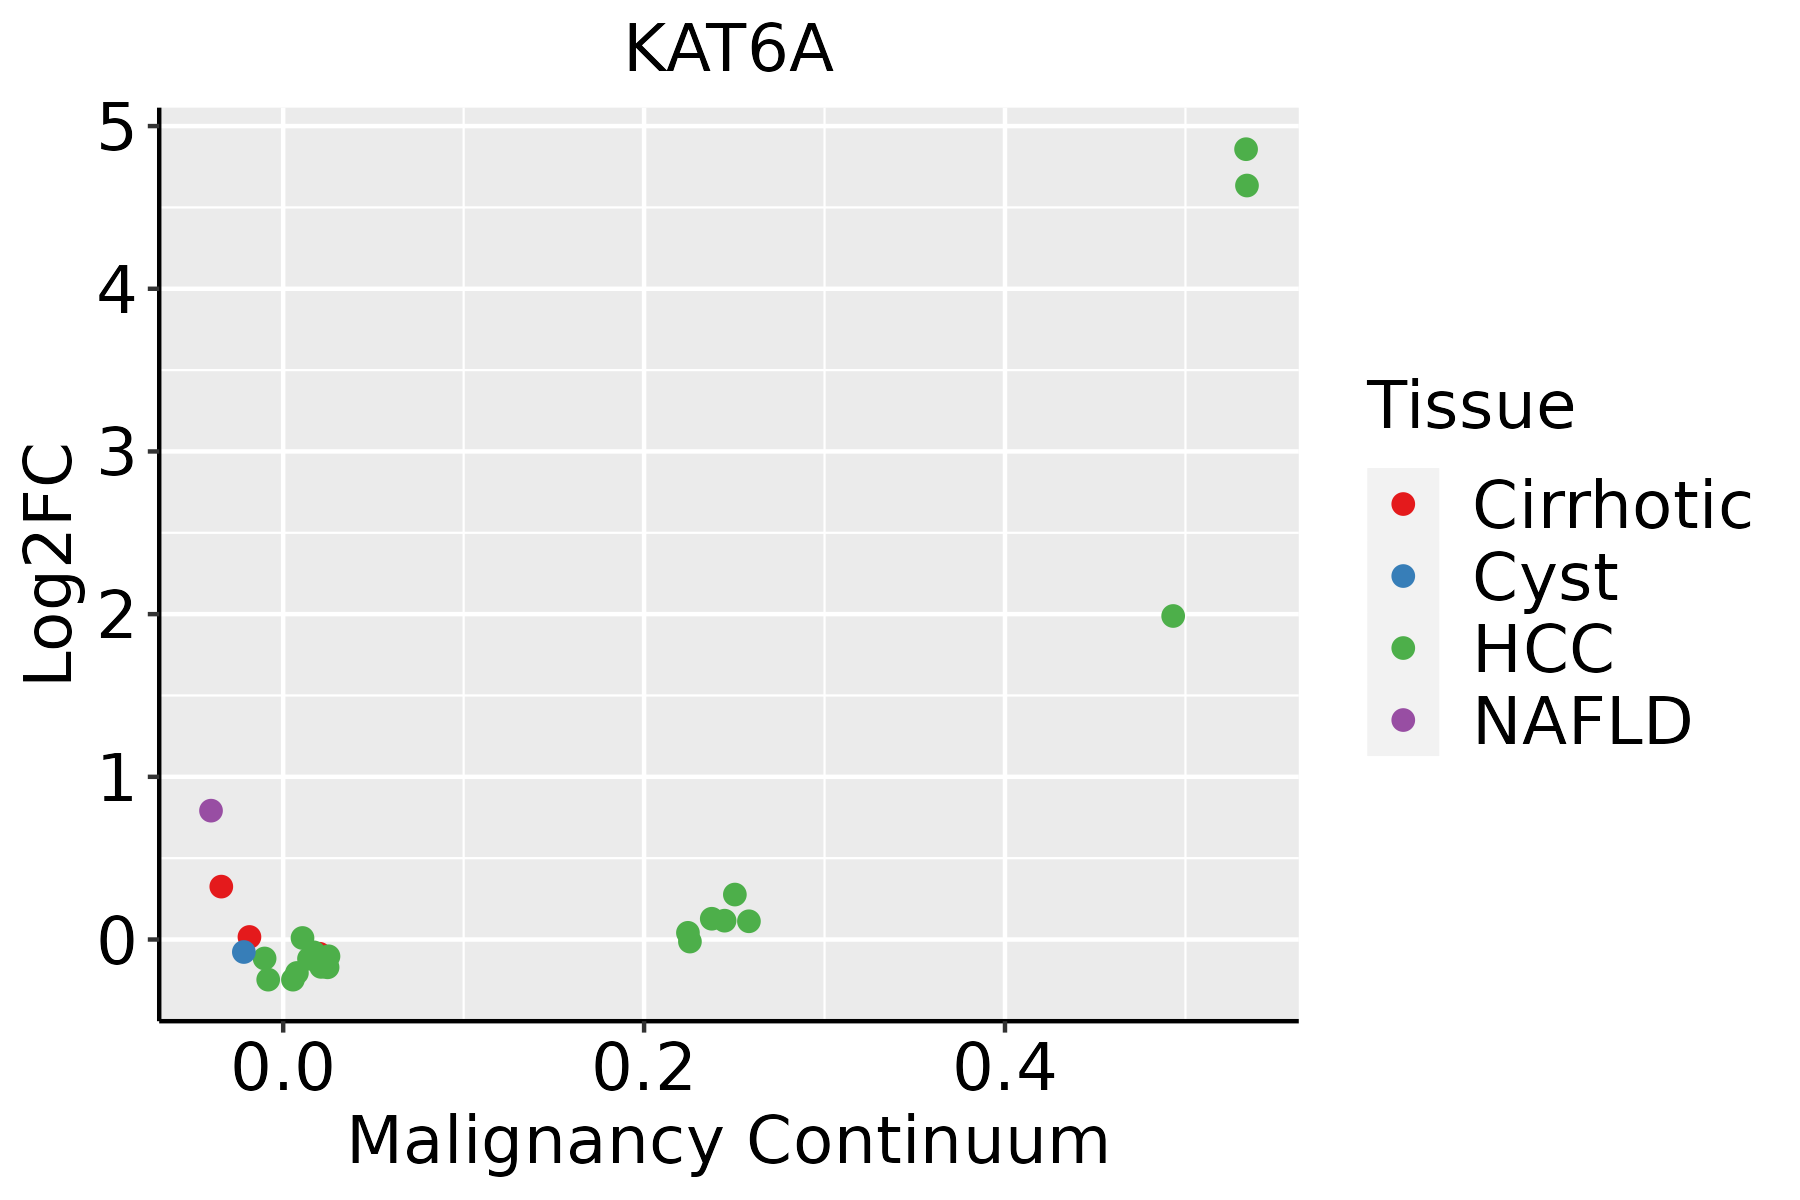 | HCC: Hepatocellular carcinoma |
| NAFLD: Non-alcoholic fatty liver disease | ||
| Lung |  | AAH: Atypical adenomatous hyperplasia |
| AIS: Adenocarcinoma in situ | ||
| IAC: Invasive lung adenocarcinoma | ||
| MIA: Minimally invasive adenocarcinoma | ||
| Prostate |  | BPH: Benign Prostatic Hyperplasia |
| Skin | 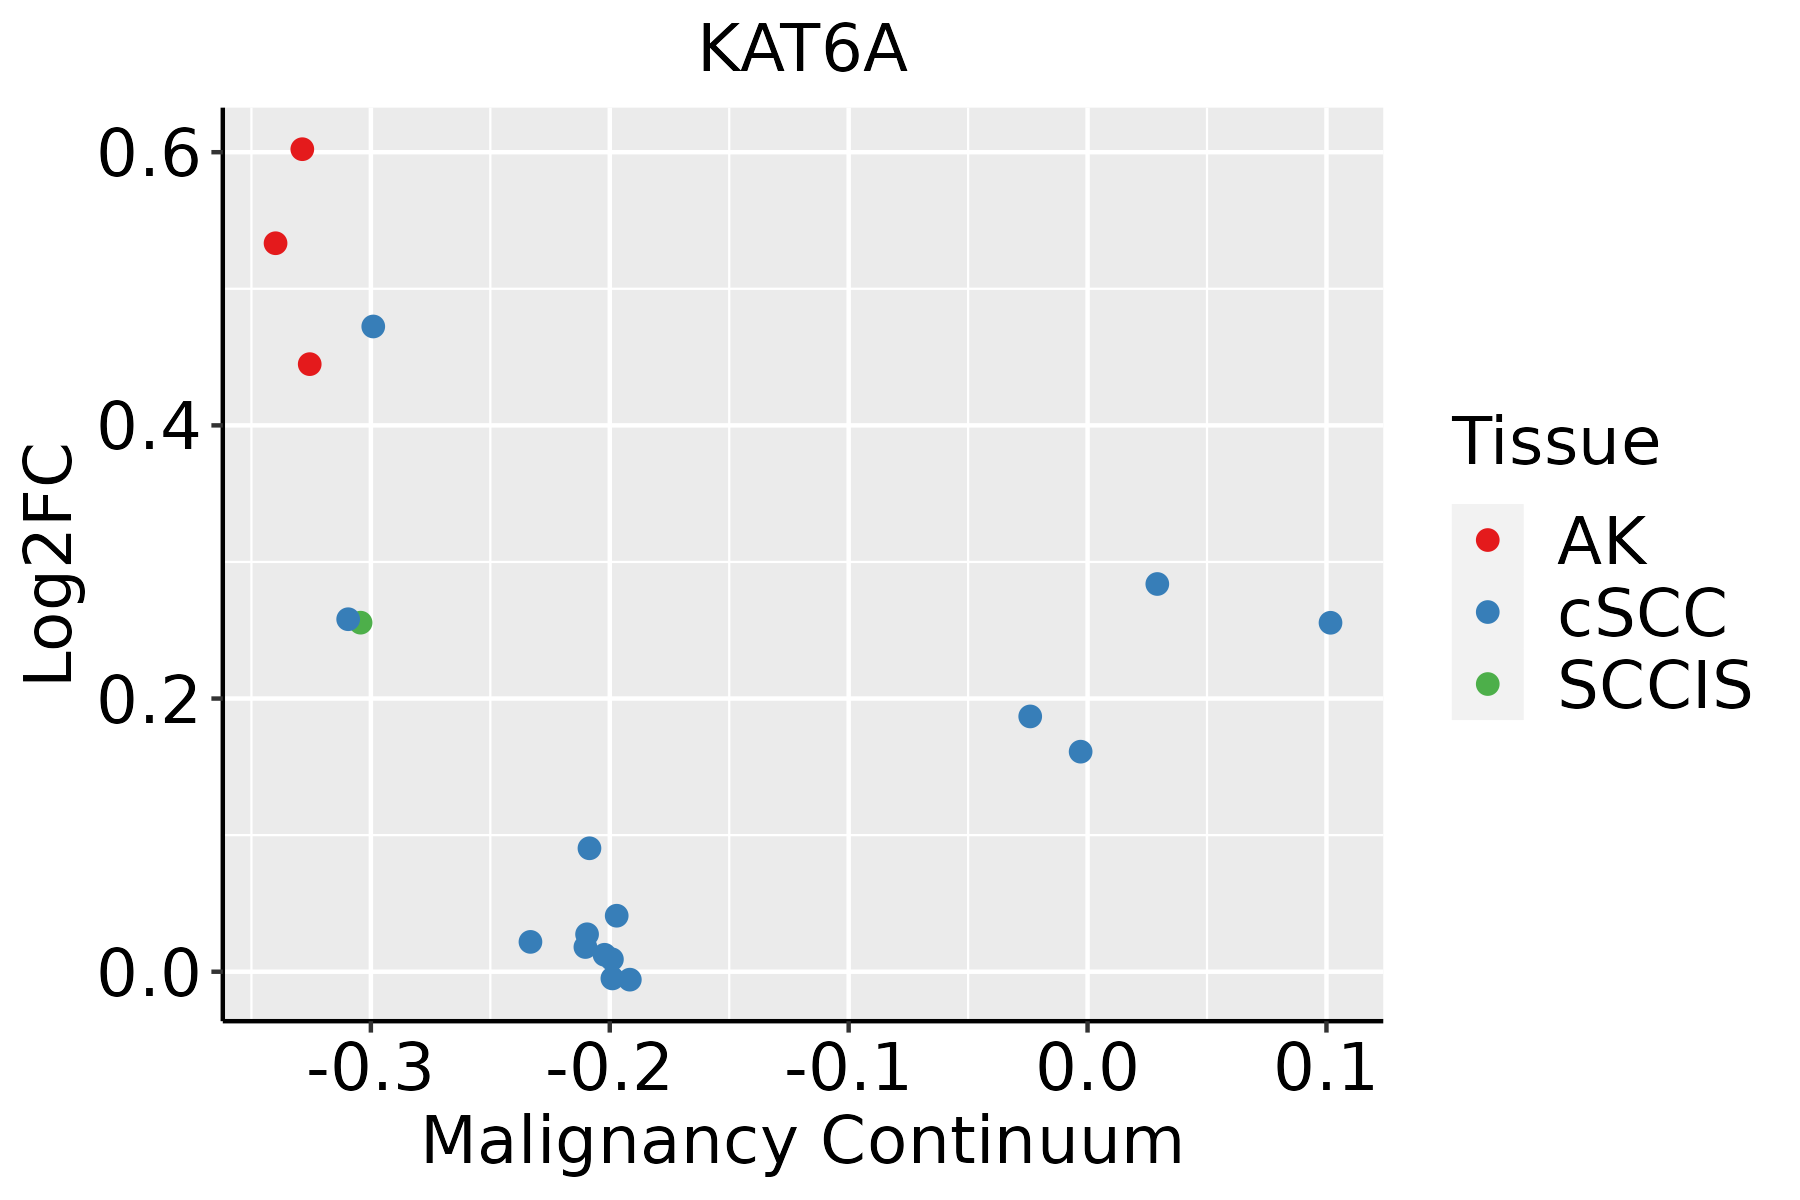 | AK: Actinic keratosis |
| cSCC: Cutaneous squamous cell carcinoma | ||
| SCCIS:squamous cell carcinoma in situ | ||
| Thyroid |  | ATC: Anaplastic thyroid cancer |
| HT: Hashimoto's thyroiditis | ||
| PTC: Papillary thyroid cancer |
| ∗log2FC in expression of this searched gene in stem-like cells from each diseased tissue sample relative to stem-like cells in normal samples in each tissue plotted against the malignancy continuum. Samples are colored based on if they are from different disease stage. |
Top |
Malignant transformation related pathway analysis |
| Find out the enriched GO biological processes and KEGG pathways involved in transition from healthy to precancer to cancer |
| Tissue | Disease Stage | Enriched GO biological Processes |
| Colorectum | AD |  |
| Colorectum | SER |  |
| Colorectum | MSS |  |
| Colorectum | MSI-H |  |
| Colorectum | FAP |  |
| ∗Top 15 enriched GO BP terms are showed in the bar plot of each disease state in each tissue. Each row represents a significant GO biological process which is colored according to the -log10(p.adjust). |
| Page: 1 2 3 4 5 6 7 8 9 |
| GO ID | Tissue | Disease Stage | Description | Gene Ratio | Bg Ratio | pvalue | p.adjust | Count |
| GO:003009910 | Cervix | CC | myeloid cell differentiation | 83/2311 | 381/18723 | 1.31e-07 | 6.42e-06 | 83 |
| GO:00075689 | Cervix | CC | aging | 75/2311 | 339/18723 | 2.75e-07 | 1.13e-05 | 75 |
| GO:00075695 | Cervix | CC | cell aging | 34/2311 | 132/18723 | 1.92e-05 | 3.53e-04 | 34 |
| GO:00063257 | Cervix | CC | chromatin organization | 78/2311 | 409/18723 | 5.40e-05 | 8.02e-04 | 78 |
| GO:007233110 | Cervix | CC | signal transduction by p53 class mediator | 38/2311 | 163/18723 | 7.06e-05 | 9.85e-04 | 38 |
| GO:00903981 | Cervix | CC | cellular senescence | 25/2311 | 93/18723 | 1.11e-04 | 1.40e-03 | 25 |
| GO:00165705 | Cervix | CC | histone modification | 84/2311 | 463/18723 | 1.70e-04 | 2.01e-03 | 84 |
| GO:190179610 | Cervix | CC | regulation of signal transduction by p53 class mediator | 23/2311 | 93/18723 | 7.52e-04 | 6.72e-03 | 23 |
| GO:00063381 | Cervix | CC | chromatin remodeling | 45/2311 | 255/18723 | 8.33e-03 | 4.30e-02 | 45 |
| GO:00182054 | Cervix | CC | peptidyl-lysine modification | 62/2311 | 376/18723 | 1.04e-02 | 4.97e-02 | 62 |
| GO:0030099 | Colorectum | AD | myeloid cell differentiation | 119/3918 | 381/18723 | 1.24e-06 | 4.01e-05 | 119 |
| GO:0072331 | Colorectum | AD | signal transduction by p53 class mediator | 58/3918 | 163/18723 | 1.04e-05 | 2.40e-04 | 58 |
| GO:0006325 | Colorectum | AD | chromatin organization | 119/3918 | 409/18723 | 4.85e-05 | 8.33e-04 | 119 |
| GO:1901796 | Colorectum | AD | regulation of signal transduction by p53 class mediator | 36/3918 | 93/18723 | 6.58e-05 | 1.07e-03 | 36 |
| GO:0007568 | Colorectum | AD | aging | 98/3918 | 339/18723 | 2.77e-04 | 3.39e-03 | 98 |
| GO:0006338 | Colorectum | AD | chromatin remodeling | 70/3918 | 255/18723 | 7.44e-03 | 4.53e-02 | 70 |
| GO:00300994 | Colorectum | FAP | myeloid cell differentiation | 81/2622 | 381/18723 | 6.33e-05 | 1.22e-03 | 81 |
| GO:00165701 | Colorectum | FAP | histone modification | 94/2622 | 463/18723 | 1.06e-04 | 1.76e-03 | 94 |
| GO:00063253 | Colorectum | FAP | chromatin organization | 84/2622 | 409/18723 | 1.62e-04 | 2.47e-03 | 84 |
| GO:00075682 | Colorectum | FAP | aging | 69/2622 | 339/18723 | 7.66e-04 | 8.12e-03 | 69 |
| Page: 1 2 3 4 5 6 7 8 9 10 |
| Pathway ID | Tissue | Disease Stage | Description | Gene Ratio | Bg Ratio | pvalue | p.adjust | qvalue | Count |
| Page: 1 |
Top |
Cell-cell communication analysis |
| Identification of potential cell-cell interactions between two cell types and their ligand-receptor pairs for different disease states |
| Ligand | Receptor | LRpair | Pathway | Tissue | Disease Stage |
| Page: 1 |
Top |
Single-cell gene regulatory network inference analysis |
| Find out the significant the regulons (TFs) and the target genes of each regulon across cell types for different disease states |
| TF | Cell Type | Tissue | Disease Stage | Target Gene | RSS | Regulon Activity |
| ∗The dot plots of a searched regulon are shown for all cell subpopulations in each disease state of each tissue based on the regulon specific score inferred using pySCENIC and by calculating the average expression. |
| Page: 1 |
Top |
Somatic mutation of malignant transformation related genes |
| Annotation of somatic variants for genes involved in malignant transformation |
| Hugo Symbol | Variant Class | Variant Classification | dbSNP RS | HGVSc | HGVSp | HGVSp Short | SWISSPROT | BIOTYPE | SIFT | PolyPhen | Tumor Sample Barcode | Tissue | Histology | Sex | Age | Stage | Therapy Types | Drugs | Outcome |
| KAT6A | SNV | Missense_Mutation | c.5324N>T | p.Pro1775Leu | p.P1775L | Q92794 | protein_coding | deleterious(0) | possibly_damaging(0.555) | TCGA-A2-A0CM-01 | Breast | breast invasive carcinoma | Female | <65 | I/II | Chemotherapy | adriamycin | PD | |
| KAT6A | SNV | Missense_Mutation | rs755233733 | c.1981N>G | p.Phe661Val | p.F661V | Q92794 | protein_coding | deleterious(0) | probably_damaging(0.999) | TCGA-A2-A1G4-01 | Breast | breast invasive carcinoma | Female | >=65 | III/IV | Chemotherapy | adriamycin | SD |
| KAT6A | SNV | Missense_Mutation | rs755233733 | c.1981T>G | p.Phe661Val | p.F661V | Q92794 | protein_coding | deleterious(0) | probably_damaging(0.999) | TCGA-A8-A06R-01 | Breast | breast invasive carcinoma | Female | >=65 | I/II | Chemotherapy | 5-fluorouracil | CR |
| KAT6A | SNV | Missense_Mutation | rs752123557 | c.3506G>A | p.Arg1169Gln | p.R1169Q | Q92794 | protein_coding | deleterious_low_confidence(0) | probably_damaging(0.992) | TCGA-A8-A093-01 | Breast | breast invasive carcinoma | Female | <65 | I/II | Hormone Therapy | tamoxiphen | SD |
| KAT6A | SNV | Missense_Mutation | rs778950477 | c.1301N>G | p.Ser434Cys | p.S434C | Q92794 | protein_coding | deleterious(0) | probably_damaging(0.996) | TCGA-AC-A23H-01 | Breast | breast invasive carcinoma | Female | >=65 | I/II | Unknown | Unknown | PD |
| KAT6A | SNV | Missense_Mutation | novel | c.3013N>A | p.Leu1005Ile | p.L1005I | Q92794 | protein_coding | deleterious_low_confidence(0) | probably_damaging(0.991) | TCGA-AN-A046-01 | Breast | breast invasive carcinoma | Female | >=65 | I/II | Unknown | Unknown | SD |
| KAT6A | SNV | Missense_Mutation | novel | c.5255G>T | p.Ser1752Ile | p.S1752I | Q92794 | protein_coding | deleterious(0) | probably_damaging(0.994) | TCGA-AR-A251-01 | Breast | breast invasive carcinoma | Female | <65 | III/IV | Chemotherapy | doxorubicin | SD |
| KAT6A | SNV | Missense_Mutation | novel | c.1537G>A | p.Glu513Lys | p.E513K | Q92794 | protein_coding | deleterious(0) | probably_damaging(0.989) | TCGA-B6-A40B-01 | Breast | breast invasive carcinoma | Female | >=65 | I/II | Unknown | Unknown | SD |
| KAT6A | SNV | Missense_Mutation | novel | c.3758N>T | p.Ser1253Phe | p.S1253F | Q92794 | protein_coding | deleterious_low_confidence(0.01) | probably_damaging(0.991) | TCGA-BH-A0B6-01 | Breast | breast invasive carcinoma | Female | <65 | I/II | Unknown | Unknown | SD |
| KAT6A | SNV | Missense_Mutation | c.985N>T | p.Arg329Trp | p.R329W | Q92794 | protein_coding | deleterious(0) | probably_damaging(0.998) | TCGA-BH-A0HF-01 | Breast | breast invasive carcinoma | Female | >=65 | I/II | Hormone Therapy | arimidex | SD |
| Page: 1 2 3 4 5 6 7 8 9 10 11 12 13 14 15 16 17 18 19 20 21 22 23 |
Top |
Related drugs of malignant transformation related genes |
| Identification of chemicals and drugs interact with genes involved in malignant transfromation |
| (DGIdb 4.0) |
| Entrez ID | Symbol | Category | Interaction Types | Drug Claim Name | Drug Name | PMIDs |
| Page: 1 |

Copyright 2023-Present -The University of Texas Health Science Center at Houston |