
|
|||||
|
 | |
| |
| |
| |
| |
| |
|
Gene: KARS |
Gene summary for KARS |
| Gene information | Species | Human | Gene symbol | KARS | Gene ID | 3735 |
| Gene name | lysyl-tRNA synthetase 1 | |
| Gene Alias | CMTRIB | |
| Cytomap | 16q23.1 | |
| Gene Type | protein-coding | GO ID | GO:0000165 | UniProtAcc | Q15046 |
Top |
Malignant transformation analysis |
| Identification of the aberrant gene expression in precancerous and cancerous lesions by comparing the gene expression of stem-like cells in diseased tissues with normal stem cells |
| Entrez ID | Symbol | Replicates | Species | Organ | Tissue | Adj P-value | Log2FC | Malignancy |
| 3735 | KARS | HTA11_347_2000001011 | Human | Colorectum | AD | 3.13e-02 | -1.49e-01 | -0.1954 |
| 3735 | KARS | HTA11_696_2000001011 | Human | Colorectum | AD | 9.04e-05 | -1.49e-01 | -0.1464 |
| 3735 | KARS | HTA11_866_2000001011 | Human | Colorectum | AD | 2.00e-05 | -1.49e-01 | -0.1001 |
| 3735 | KARS | HTA11_7696_3000711011 | Human | Colorectum | AD | 2.00e-05 | -1.49e-01 | 0.0674 |
| 3735 | KARS | HTA11_99999970781_79442 | Human | Colorectum | MSS | 7.66e-31 | 8.08e-01 | 0.294 |
| 3735 | KARS | HTA11_99999965062_69753 | Human | Colorectum | MSI-H | 6.22e-11 | 1.60e+00 | 0.3487 |
| 3735 | KARS | HTA11_99999965104_69814 | Human | Colorectum | MSS | 5.17e-08 | 5.62e-01 | 0.281 |
| 3735 | KARS | HTA11_99999971662_82457 | Human | Colorectum | MSS | 2.60e-40 | 1.17e+00 | 0.3859 |
| 3735 | KARS | HTA11_99999973899_84307 | Human | Colorectum | MSS | 2.49e-08 | 5.91e-01 | 0.2585 |
| 3735 | KARS | HTA11_99999974143_84620 | Human | Colorectum | MSS | 5.82e-11 | 4.54e-01 | 0.3005 |
| 3735 | KARS | LZE2T | Human | Esophagus | ESCC | 4.00e-02 | 3.32e-01 | 0.082 |
| 3735 | KARS | LZE4T | Human | Esophagus | ESCC | 3.04e-14 | 8.59e-02 | 0.0811 |
| 3735 | KARS | LZE5T | Human | Esophagus | ESCC | 3.94e-02 | 2.59e-02 | 0.0514 |
| 3735 | KARS | LZE7T | Human | Esophagus | ESCC | 1.26e-05 | 3.10e-01 | 0.0667 |
| 3735 | KARS | LZE8T | Human | Esophagus | ESCC | 5.21e-06 | -4.63e-02 | 0.067 |
| 3735 | KARS | LZE20T | Human | Esophagus | ESCC | 3.85e-07 | -1.93e-03 | 0.0662 |
| 3735 | KARS | LZE22D1 | Human | Esophagus | HGIN | 2.46e-03 | -1.81e-01 | 0.0595 |
| 3735 | KARS | LZE22T | Human | Esophagus | ESCC | 4.15e-06 | 3.11e-01 | 0.068 |
| 3735 | KARS | LZE24T | Human | Esophagus | ESCC | 2.53e-12 | 1.82e-01 | 0.0596 |
| 3735 | KARS | LZE6T | Human | Esophagus | ESCC | 1.31e-08 | -5.22e-02 | 0.0845 |
| Page: 1 2 3 4 5 6 7 |
| Tissue | Expression Dynamics | Abbreviation |
| Colorectum (GSE201348) |  | FAP: Familial adenomatous polyposis |
| CRC: Colorectal cancer | ||
| Colorectum (HTA11) |  | AD: Adenomas |
| SER: Sessile serrated lesions | ||
| MSI-H: Microsatellite-high colorectal cancer | ||
| MSS: Microsatellite stable colorectal cancer | ||
| Esophagus | 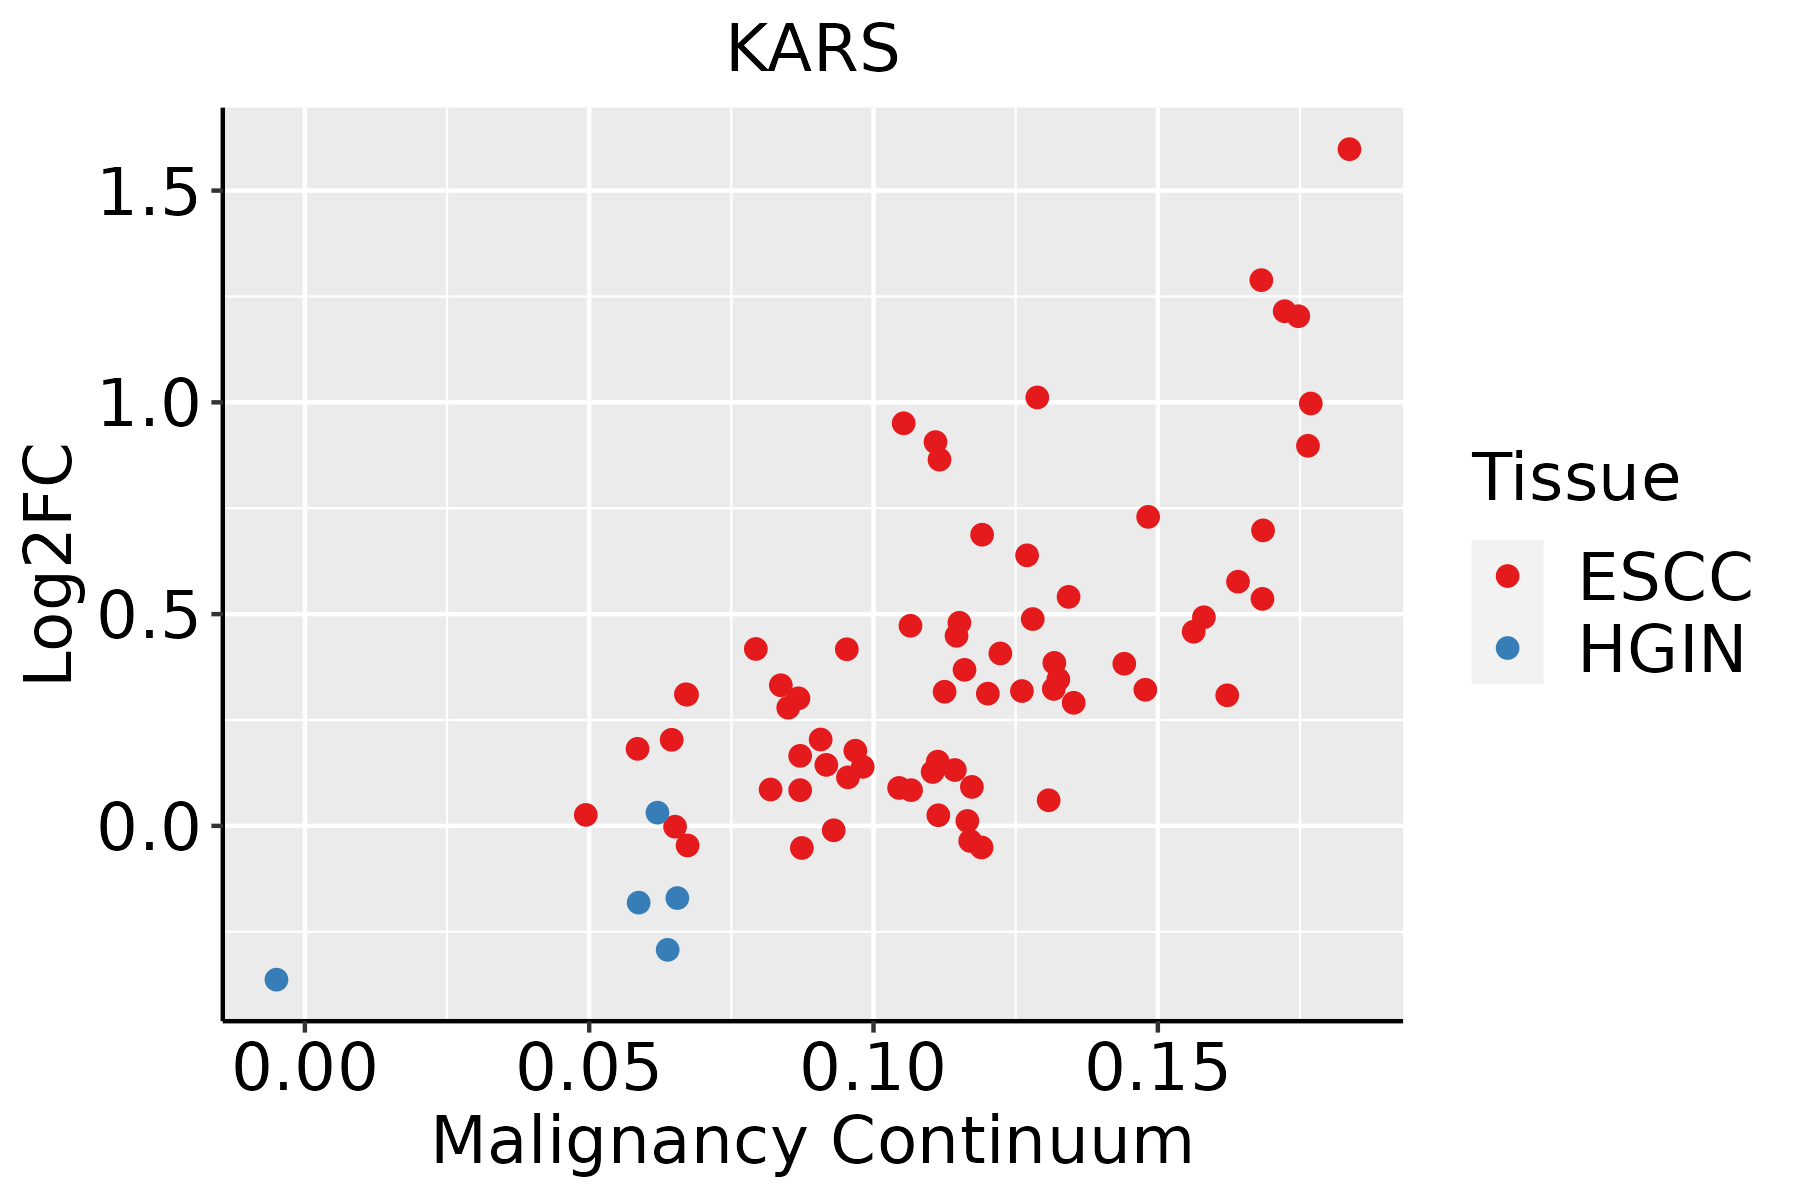 | ESCC: Esophageal squamous cell carcinoma |
| HGIN: High-grade intraepithelial neoplasias | ||
| LGIN: Low-grade intraepithelial neoplasias | ||
| Liver |  | HCC: Hepatocellular carcinoma |
| NAFLD: Non-alcoholic fatty liver disease | ||
| Oral Cavity | 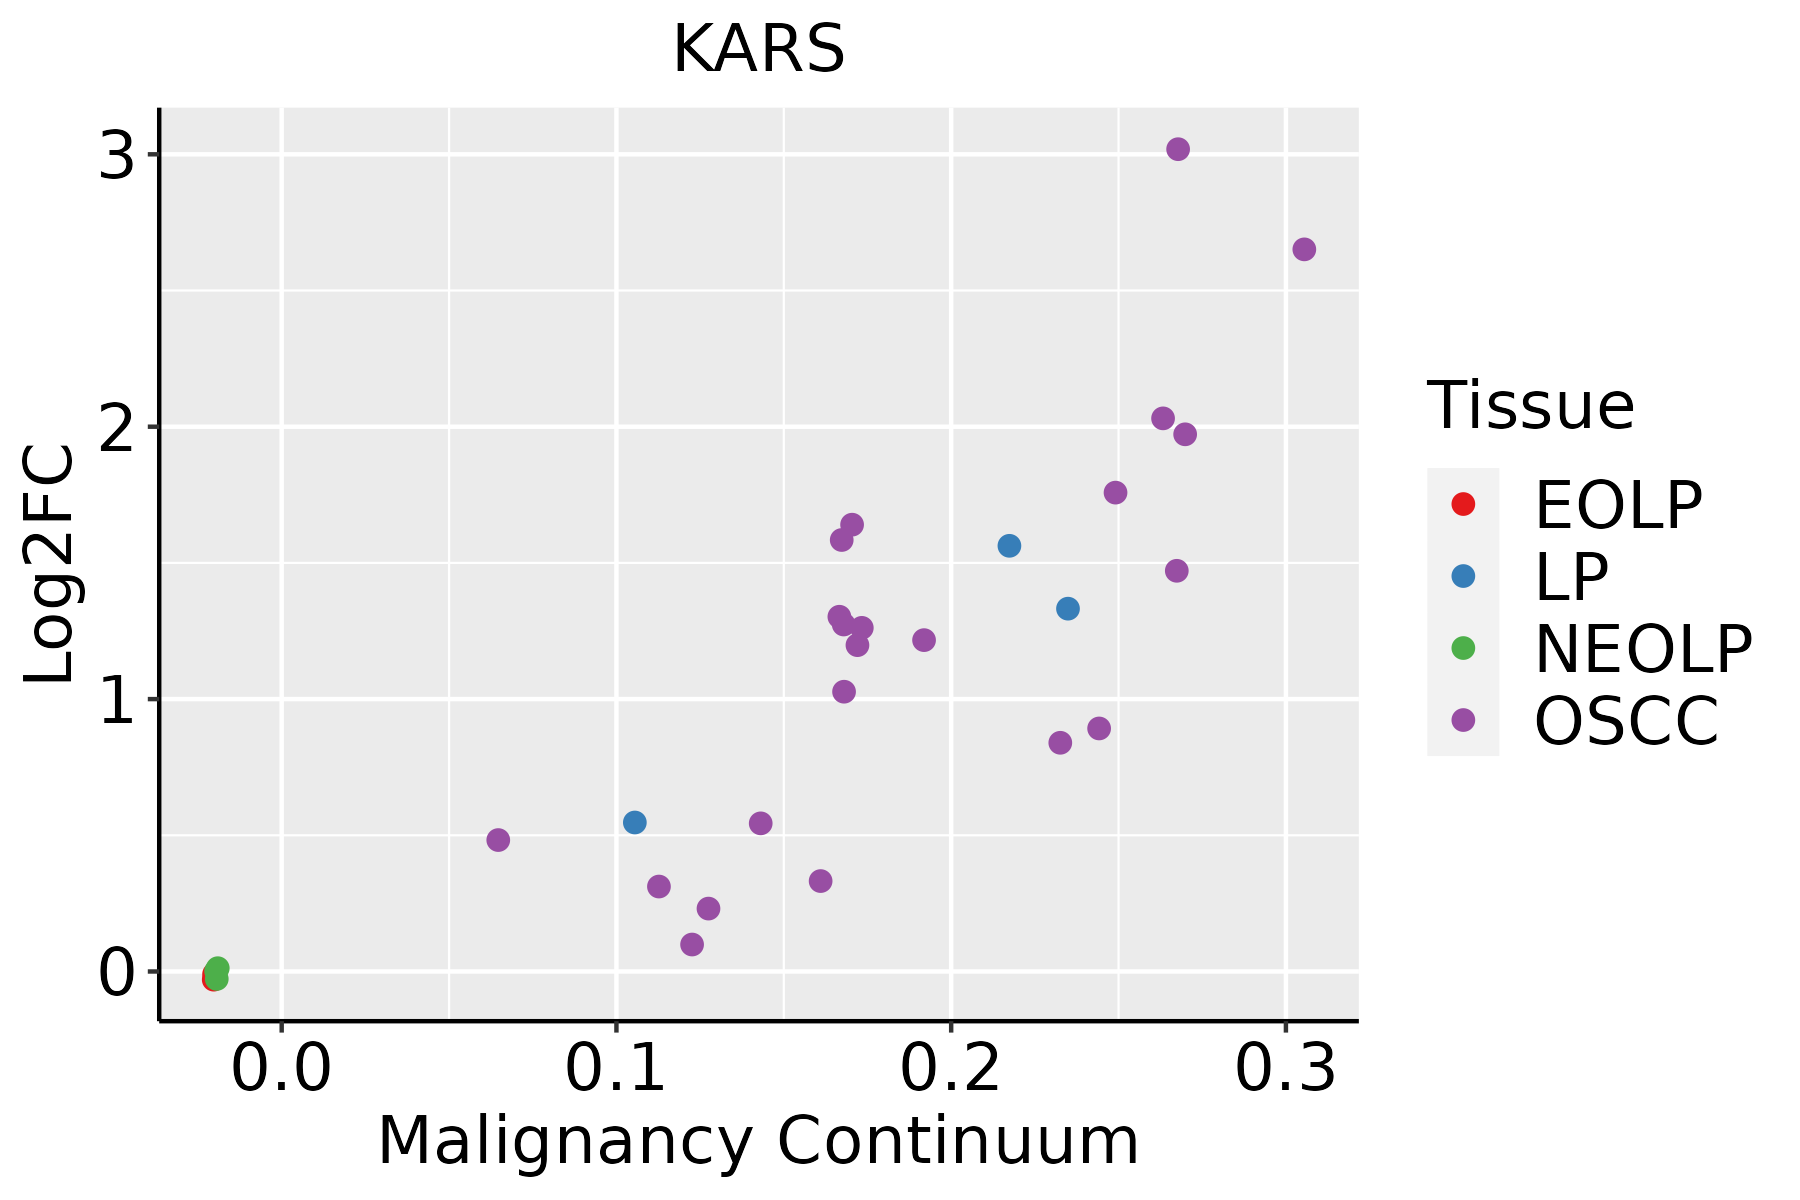 | EOLP: Erosive Oral lichen planus |
| LP: leukoplakia | ||
| NEOLP: Non-erosive oral lichen planus | ||
| OSCC: Oral squamous cell carcinoma | ||
| Skin | 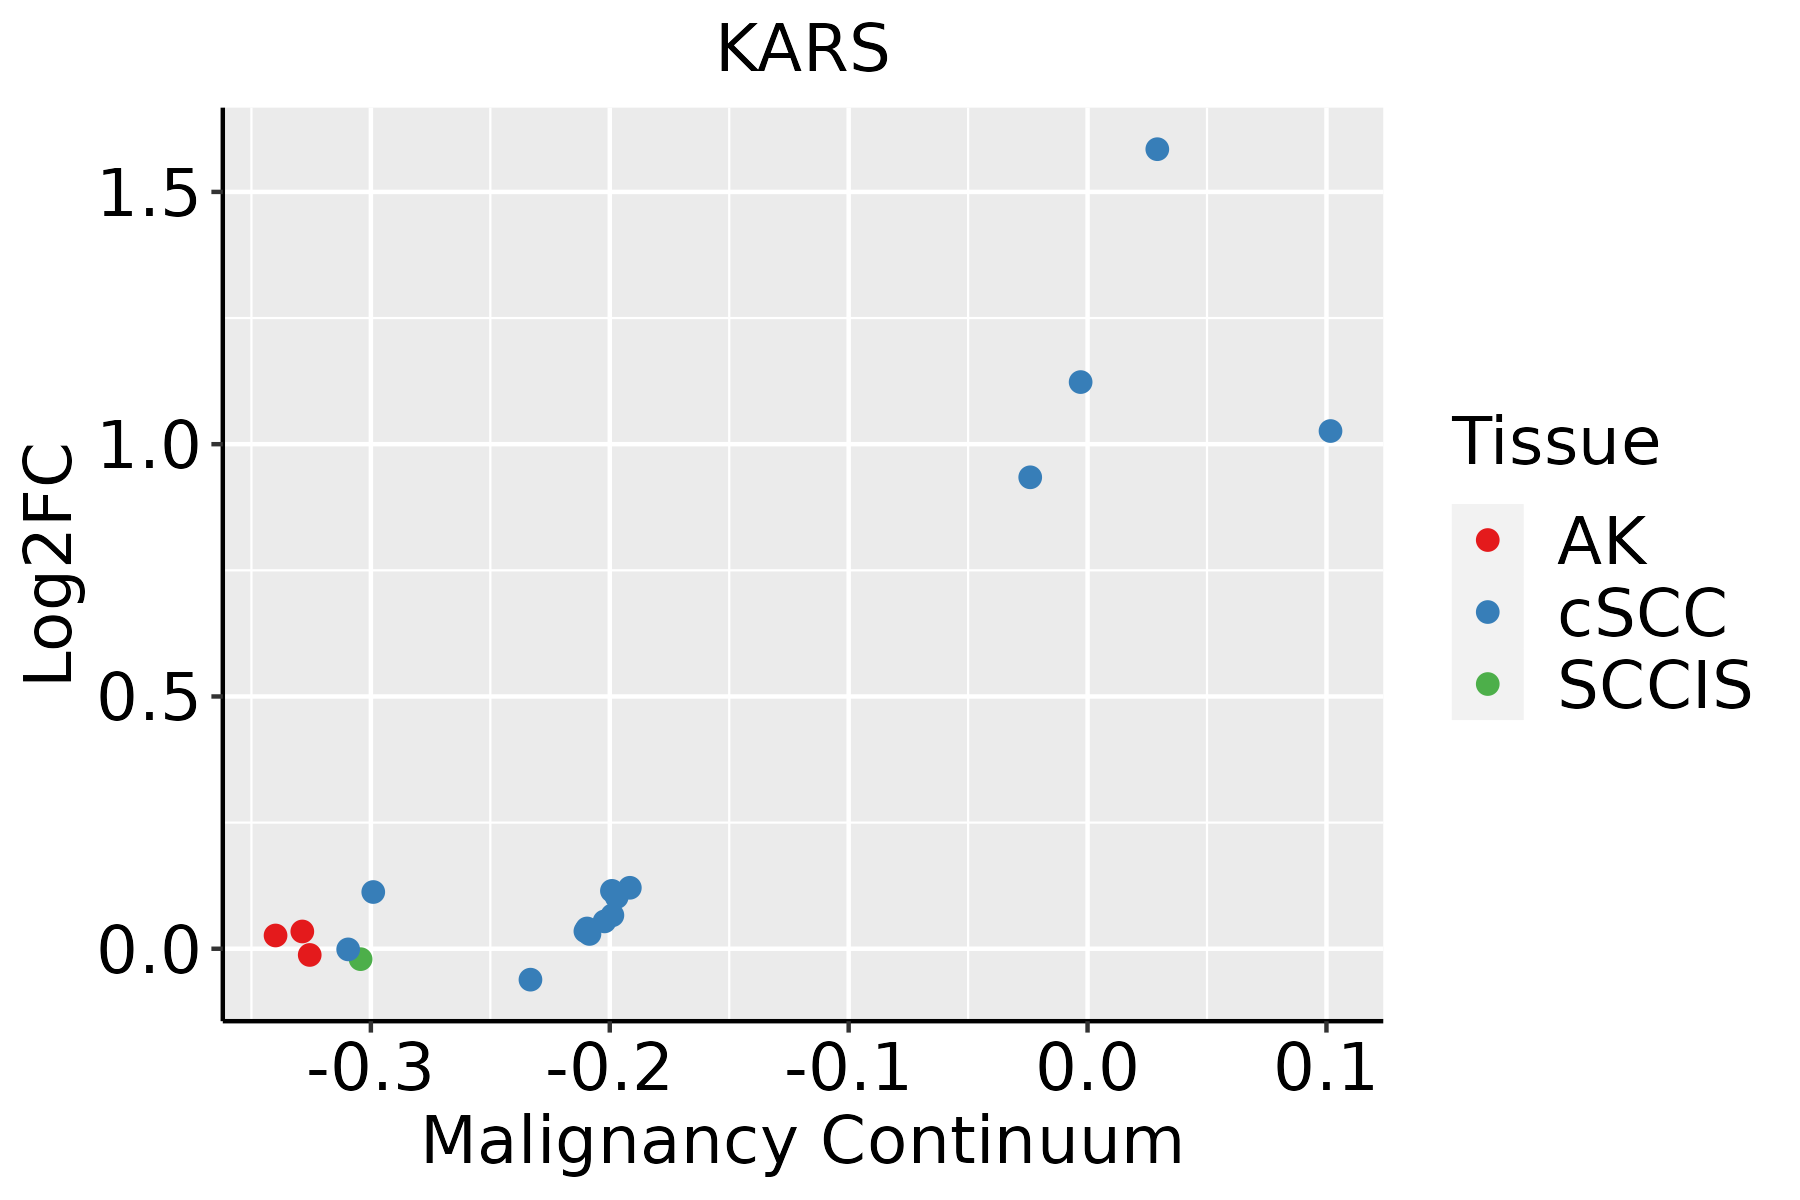 | AK: Actinic keratosis |
| cSCC: Cutaneous squamous cell carcinoma | ||
| SCCIS:squamous cell carcinoma in situ | ||
| Thyroid | 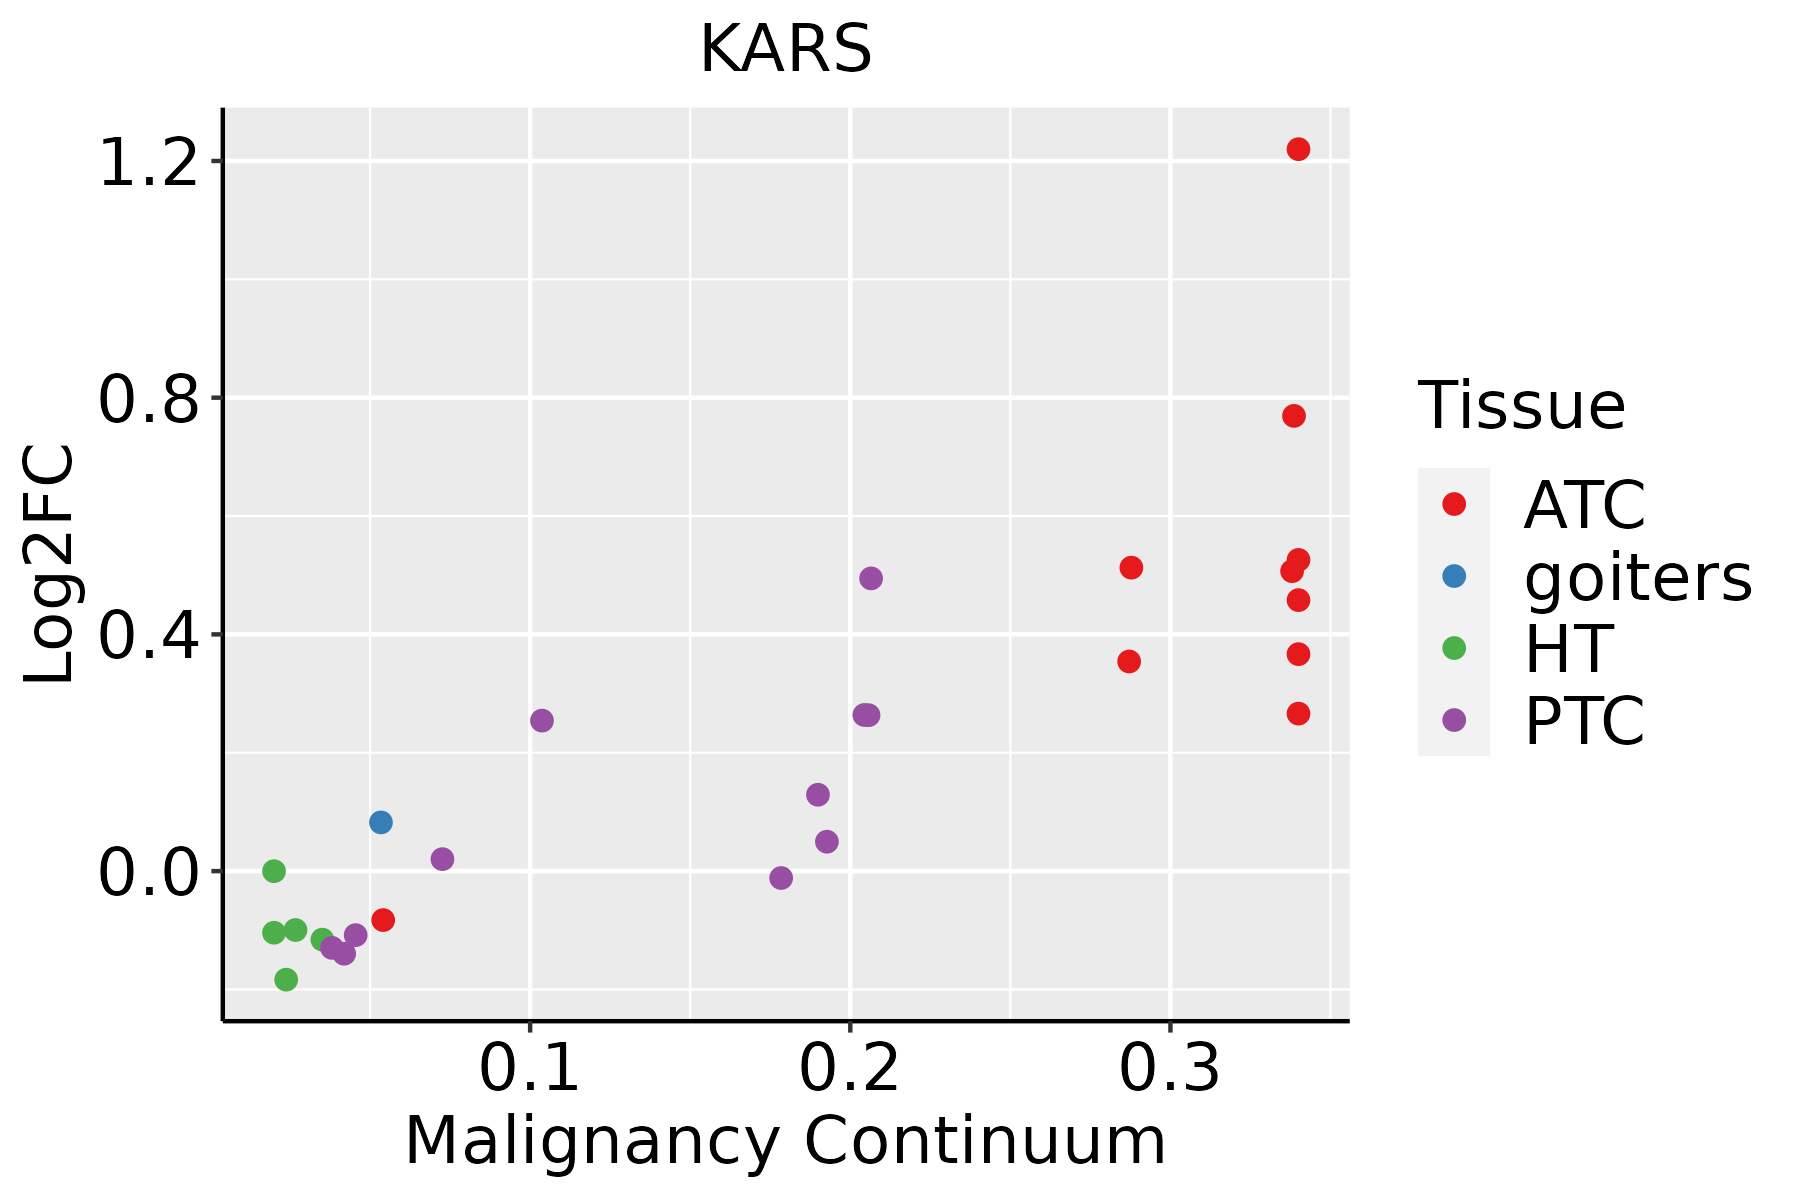 | ATC: Anaplastic thyroid cancer |
| HT: Hashimoto's thyroiditis | ||
| PTC: Papillary thyroid cancer |
| ∗log2FC in expression of this searched gene in stem-like cells from each diseased tissue sample relative to stem-like cells in normal samples in each tissue plotted against the malignancy continuum. Samples are colored based on if they are from different disease stage. |
Top |
Malignant transformation related pathway analysis |
| Find out the enriched GO biological processes and KEGG pathways involved in transition from healthy to precancer to cancer |
| Tissue | Disease Stage | Enriched GO biological Processes |
| Colorectum | AD |  |
| Colorectum | SER |  |
| Colorectum | MSS |  |
| Colorectum | MSI-H |  |
| Colorectum | FAP |  |
| ∗Top 15 enriched GO BP terms are showed in the bar plot of each disease state in each tissue. Each row represents a significant GO biological process which is colored according to the -log10(p.adjust). |
| Page: 1 2 3 4 5 6 7 8 9 |
| GO ID | Tissue | Disease Stage | Description | Gene Ratio | Bg Ratio | pvalue | p.adjust | Count |
| GO:0009117 | Colorectum | AD | nucleotide metabolic process | 168/3918 | 489/18723 | 2.20e-12 | 3.36e-10 | 168 |
| GO:0006753 | Colorectum | AD | nucleoside phosphate metabolic process | 169/3918 | 497/18723 | 4.99e-12 | 6.98e-10 | 169 |
| GO:1901293 | Colorectum | AD | nucleoside phosphate biosynthetic process | 80/3918 | 256/18723 | 6.31e-05 | 1.05e-03 | 80 |
| GO:0009165 | Colorectum | AD | nucleotide biosynthetic process | 79/3918 | 254/18723 | 8.33e-05 | 1.30e-03 | 79 |
| GO:0006418 | Colorectum | AD | tRNA aminoacylation for protein translation | 19/3918 | 41/18723 | 2.37e-04 | 3.03e-03 | 19 |
| GO:0043039 | Colorectum | AD | tRNA aminoacylation | 19/3918 | 44/18723 | 7.13e-04 | 7.21e-03 | 19 |
| GO:0043038 | Colorectum | AD | amino acid activation | 19/3918 | 45/18723 | 9.94e-04 | 9.28e-03 | 19 |
| GO:0006520 | Colorectum | AD | cellular amino acid metabolic process | 81/3918 | 284/18723 | 1.37e-03 | 1.19e-02 | 81 |
| GO:00091171 | Colorectum | SER | nucleotide metabolic process | 122/2897 | 489/18723 | 2.50e-08 | 1.76e-06 | 122 |
| GO:00067531 | Colorectum | SER | nucleoside phosphate metabolic process | 122/2897 | 497/18723 | 6.64e-08 | 4.33e-06 | 122 |
| GO:00064181 | Colorectum | SER | tRNA aminoacylation for protein translation | 17/2897 | 41/18723 | 5.75e-05 | 1.35e-03 | 17 |
| GO:00430391 | Colorectum | SER | tRNA aminoacylation | 17/2897 | 44/18723 | 1.64e-04 | 3.12e-03 | 17 |
| GO:00430381 | Colorectum | SER | amino acid activation | 17/2897 | 45/18723 | 2.25e-04 | 3.91e-03 | 17 |
| GO:00091651 | Colorectum | SER | nucleotide biosynthetic process | 58/2897 | 254/18723 | 1.21e-03 | 1.38e-02 | 58 |
| GO:19012931 | Colorectum | SER | nucleoside phosphate biosynthetic process | 58/2897 | 256/18723 | 1.47e-03 | 1.59e-02 | 58 |
| GO:00065201 | Colorectum | SER | cellular amino acid metabolic process | 61/2897 | 284/18723 | 4.20e-03 | 3.41e-02 | 61 |
| Page: 1 |
| Pathway ID | Tissue | Disease Stage | Description | Gene Ratio | Bg Ratio | pvalue | p.adjust | qvalue | Count |
| Page: 1 |
Top |
Cell-cell communication analysis |
| Identification of potential cell-cell interactions between two cell types and their ligand-receptor pairs for different disease states |
| Ligand | Receptor | LRpair | Pathway | Tissue | Disease Stage |
| Page: 1 |
Top |
Single-cell gene regulatory network inference analysis |
| Find out the significant the regulons (TFs) and the target genes of each regulon across cell types for different disease states |
| TF | Cell Type | Tissue | Disease Stage | Target Gene | RSS | Regulon Activity |
| ∗The dot plots of a searched regulon are shown for all cell subpopulations in each disease state of each tissue based on the regulon specific score inferred using pySCENIC and by calculating the average expression. |
| Page: 1 |
Top |
Somatic mutation of malignant transformation related genes |
| Annotation of somatic variants for genes involved in malignant transformation |
| Hugo Symbol | Variant Class | Variant Classification | dbSNP RS | HGVSc | HGVSp | HGVSp Short | SWISSPROT | BIOTYPE | SIFT | PolyPhen | Tumor Sample Barcode | Tissue | Histology | Sex | Age | Stage | Therapy Types | Drugs | Outcome |
| KARS | SNV | Missense_Mutation | novel | c.470C>A | p.Ala157Glu | p.A157E | Q15046 | protein_coding | deleterious(0) | probably_damaging(0.978) | TCGA-AC-A23C-01 | Breast | breast invasive carcinoma | Female | <65 | I/II | Chemotherapy | chemo | CR |
| KARS | SNV | Missense_Mutation | novel | c.1798N>A | p.Ala600Thr | p.A600T | Q15046 | protein_coding | tolerated(0.2) | benign(0.017) | TCGA-AR-A5QQ-01 | Breast | breast invasive carcinoma | Female | >=65 | III/IV | Chemotherapy | carboplatin | PD |
| KARS | SNV | Missense_Mutation | novel | c.690N>C | p.Glu230Asp | p.E230D | Q15046 | protein_coding | deleterious(0.05) | benign(0.007) | TCGA-C8-A8HQ-01 | Breast | breast invasive carcinoma | Female | <65 | I/II | Unknown | Unknown | SD |
| KARS | insertion | Nonsense_Mutation | novel | c.1465_1466insAGGGAGAAGAAGTAGACAAACAAAAAAACAAGTAAATA | p.Phe489Ter | p.F489* | Q15046 | protein_coding | TCGA-AN-A04C-01 | Breast | breast invasive carcinoma | Female | <65 | I/II | Unknown | Unknown | SD | ||
| KARS | insertion | Frame_Shift_Ins | novel | c.308_309insGATCTCACCCAAG | p.Tyr104IlefsTer36 | p.Y104Ifs*36 | Q15046 | protein_coding | TCGA-BH-A0BA-01 | Breast | breast invasive carcinoma | Female | <65 | III/IV | Chemotherapy | cytoxan | SD | ||
| KARS | SNV | Missense_Mutation | novel | c.1096T>C | p.Cys366Arg | p.C366R | Q15046 | protein_coding | deleterious(0) | probably_damaging(0.913) | TCGA-C5-A8XJ-01 | Cervix | cervical & endocervical cancer | Female | >=65 | I/II | Chemotherapy | cisplatin | SD |
| KARS | SNV | Missense_Mutation | novel | c.773N>A | p.Arg258Lys | p.R258K | Q15046 | protein_coding | deleterious(0) | probably_damaging(0.998) | TCGA-VS-A94W-01 | Cervix | cervical & endocervical cancer | Female | <65 | I/II | Chemotherapy | cisplatin | CR |
| KARS | SNV | Missense_Mutation | c.1003N>T | p.Leu335Phe | p.L335F | Q15046 | protein_coding | deleterious(0) | probably_damaging(0.971) | TCGA-AA-3713-01 | Colorectum | colon adenocarcinoma | Male | >=65 | III/IV | Chemotherapy | 5-fluorouracil | PR | |
| KARS | SNV | Missense_Mutation | c.588A>T | p.Glu196Asp | p.E196D | Q15046 | protein_coding | tolerated(0.5) | benign(0) | TCGA-AA-3852-01 | Colorectum | colon adenocarcinoma | Male | >=65 | I/II | Unknown | Unknown | PD | |
| KARS | SNV | Missense_Mutation | c.1537N>T | p.Arg513Cys | p.R513C | Q15046 | protein_coding | deleterious(0) | probably_damaging(1) | TCGA-AA-3864-01 | Colorectum | colon adenocarcinoma | Male | >=65 | I/II | Unknown | Unknown | SD |
| Page: 1 2 3 4 5 6 7 8 |
Top |
Related drugs of malignant transformation related genes |
| Identification of chemicals and drugs interact with genes involved in malignant transfromation |
| (DGIdb 4.0) |
| Entrez ID | Symbol | Category | Interaction Types | Drug Claim Name | Drug Name | PMIDs |
| Page: 1 |

Copyright 2023-Present -The University of Texas Health Science Center at Houston |