
|
|||||
|
 | |
| |
| |
| |
| |
| |
|
Gene: KANSL2 |
Gene summary for KANSL2 |
| Gene information | Species | Human | Gene symbol | KANSL2 | Gene ID | 54934 |
| Gene name | KAT8 regulatory NSL complex subunit 2 | |
| Gene Alias | C12orf41 | |
| Cytomap | 12q13.11 | |
| Gene Type | protein-coding | GO ID | GO:0006464 | UniProtAcc | Q9H9L4 |
Top |
Malignant transformation analysis |
| Identification of the aberrant gene expression in precancerous and cancerous lesions by comparing the gene expression of stem-like cells in diseased tissues with normal stem cells |
| Entrez ID | Symbol | Replicates | Species | Organ | Tissue | Adj P-value | Log2FC | Malignancy |
| 54934 | KANSL2 | LZE4T | Human | Esophagus | ESCC | 1.10e-13 | 1.19e-01 | 0.0811 |
| 54934 | KANSL2 | LZE7T | Human | Esophagus | ESCC | 1.21e-11 | 5.30e-01 | 0.0667 |
| 54934 | KANSL2 | LZE8T | Human | Esophagus | ESCC | 6.34e-09 | 8.00e-02 | 0.067 |
| 54934 | KANSL2 | LZE20T | Human | Esophagus | ESCC | 2.54e-04 | 1.08e-02 | 0.0662 |
| 54934 | KANSL2 | LZE24T | Human | Esophagus | ESCC | 1.27e-19 | 3.19e-01 | 0.0596 |
| 54934 | KANSL2 | LZE6T | Human | Esophagus | ESCC | 3.44e-06 | 9.30e-02 | 0.0845 |
| 54934 | KANSL2 | P1T-E | Human | Esophagus | ESCC | 7.53e-05 | 2.56e-01 | 0.0875 |
| 54934 | KANSL2 | P2T-E | Human | Esophagus | ESCC | 4.90e-36 | 7.15e-01 | 0.1177 |
| 54934 | KANSL2 | P4T-E | Human | Esophagus | ESCC | 1.77e-20 | 4.38e-01 | 0.1323 |
| 54934 | KANSL2 | P5T-E | Human | Esophagus | ESCC | 4.55e-04 | 4.53e-02 | 0.1327 |
| 54934 | KANSL2 | P8T-E | Human | Esophagus | ESCC | 5.90e-23 | 2.75e-01 | 0.0889 |
| 54934 | KANSL2 | P9T-E | Human | Esophagus | ESCC | 2.62e-10 | 1.84e-01 | 0.1131 |
| 54934 | KANSL2 | P10T-E | Human | Esophagus | ESCC | 2.01e-28 | 4.14e-01 | 0.116 |
| 54934 | KANSL2 | P11T-E | Human | Esophagus | ESCC | 1.49e-18 | 3.11e-01 | 0.1426 |
| 54934 | KANSL2 | P12T-E | Human | Esophagus | ESCC | 6.34e-35 | 7.08e-01 | 0.1122 |
| 54934 | KANSL2 | P15T-E | Human | Esophagus | ESCC | 3.37e-23 | 3.79e-01 | 0.1149 |
| 54934 | KANSL2 | P16T-E | Human | Esophagus | ESCC | 2.87e-24 | 4.15e-01 | 0.1153 |
| 54934 | KANSL2 | P17T-E | Human | Esophagus | ESCC | 3.34e-04 | 1.57e-01 | 0.1278 |
| 54934 | KANSL2 | P19T-E | Human | Esophagus | ESCC | 3.66e-05 | 2.03e-01 | 0.1662 |
| 54934 | KANSL2 | P20T-E | Human | Esophagus | ESCC | 4.13e-23 | 5.33e-01 | 0.1124 |
| Page: 1 2 3 4 |
| Tissue | Expression Dynamics | Abbreviation |
| Esophagus | 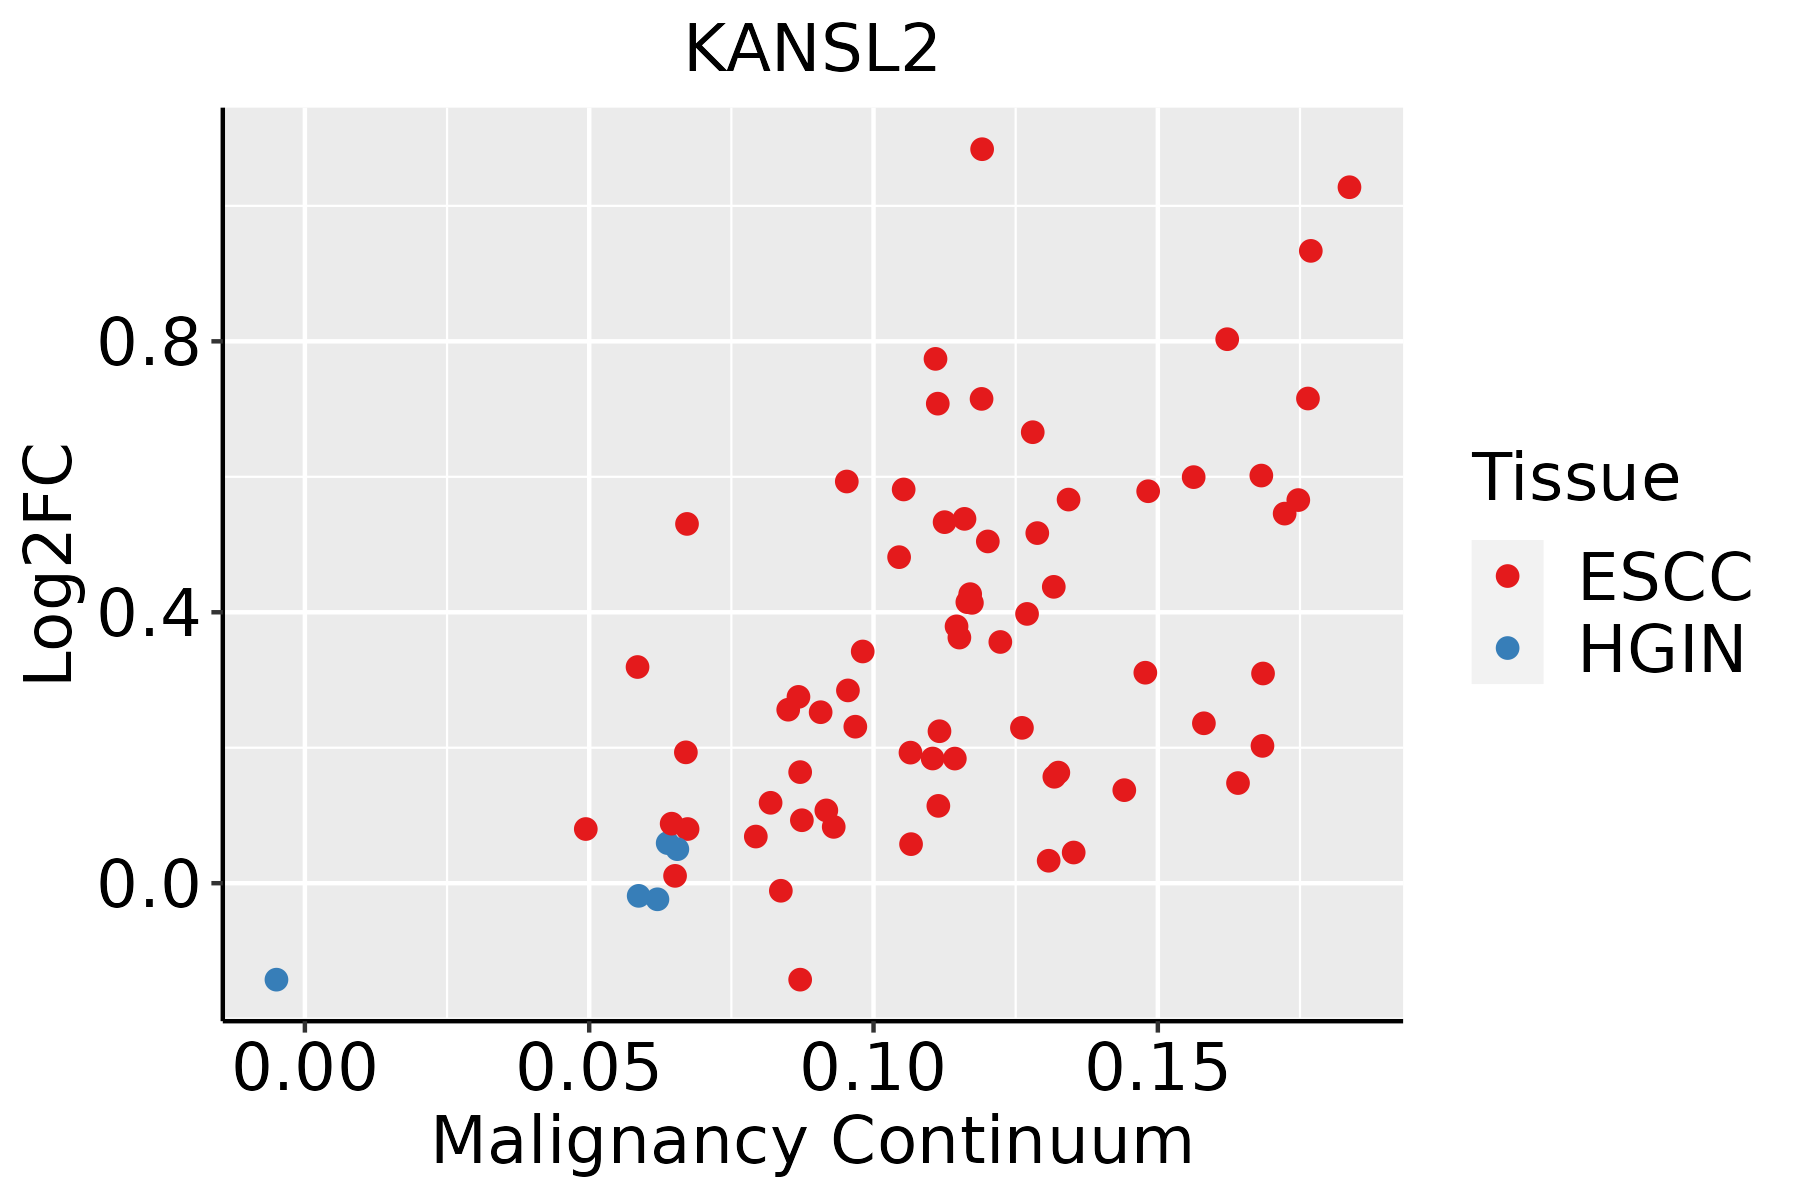 | ESCC: Esophageal squamous cell carcinoma |
| HGIN: High-grade intraepithelial neoplasias | ||
| LGIN: Low-grade intraepithelial neoplasias | ||
| Oral Cavity | 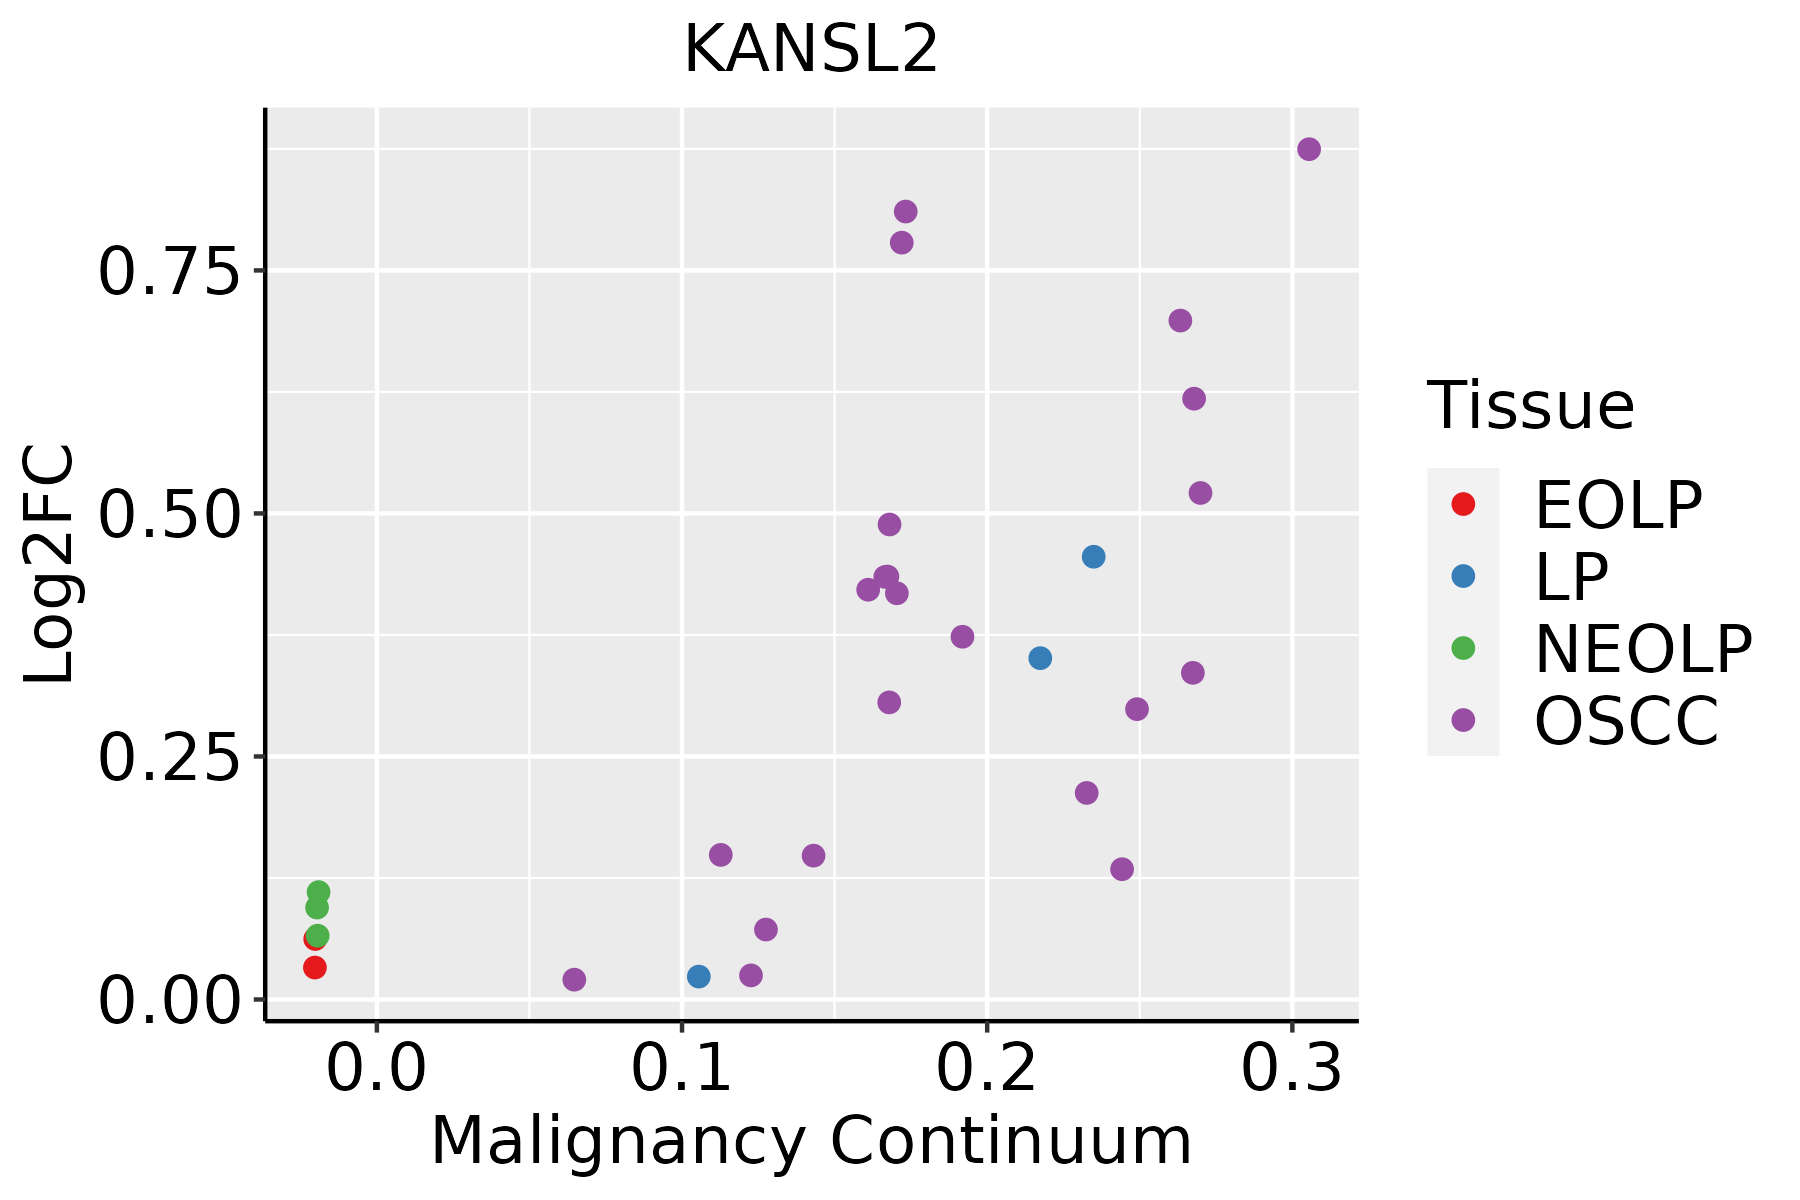 | EOLP: Erosive Oral lichen planus |
| LP: leukoplakia | ||
| NEOLP: Non-erosive oral lichen planus | ||
| OSCC: Oral squamous cell carcinoma |
| ∗log2FC in expression of this searched gene in stem-like cells from each diseased tissue sample relative to stem-like cells in normal samples in each tissue plotted against the malignancy continuum. Samples are colored based on if they are from different disease stage. |
Top |
Malignant transformation related pathway analysis |
| Find out the enriched GO biological processes and KEGG pathways involved in transition from healthy to precancer to cancer |
| Tissue | Disease Stage | Enriched GO biological Processes |
| Colorectum | AD |  |
| Colorectum | SER |  |
| Colorectum | MSS |  |
| Colorectum | MSI-H |  |
| Colorectum | FAP |  |
| ∗Top 15 enriched GO BP terms are showed in the bar plot of each disease state in each tissue. Each row represents a significant GO biological process which is colored according to the -log10(p.adjust). |
| Page: 1 2 3 4 5 6 7 8 9 |
| GO ID | Tissue | Disease Stage | Description | Gene Ratio | Bg Ratio | pvalue | p.adjust | Count |
| GO:001657015 | Esophagus | ESCC | histone modification | 323/8552 | 463/18723 | 2.61e-26 | 7.88e-24 | 323 |
| GO:001820514 | Esophagus | ESCC | peptidyl-lysine modification | 259/8552 | 376/18723 | 3.90e-20 | 5.26e-18 | 259 |
| GO:001839413 | Esophagus | ESCC | peptidyl-lysine acetylation | 123/8552 | 169/18723 | 6.58e-13 | 2.94e-11 | 123 |
| GO:004354313 | Esophagus | ESCC | protein acylation | 165/8552 | 243/18723 | 1.69e-12 | 7.14e-11 | 165 |
| GO:000647313 | Esophagus | ESCC | protein acetylation | 140/8552 | 201/18723 | 4.37e-12 | 1.69e-10 | 140 |
| GO:001839313 | Esophagus | ESCC | internal peptidyl-lysine acetylation | 114/8552 | 158/18723 | 1.16e-11 | 4.24e-10 | 114 |
| GO:000647513 | Esophagus | ESCC | internal protein amino acid acetylation | 115/8552 | 160/18723 | 1.43e-11 | 5.08e-10 | 115 |
| GO:00165735 | Esophagus | ESCC | histone acetylation | 110/8552 | 152/18723 | 1.95e-11 | 6.81e-10 | 110 |
| GO:004396712 | Esophagus | ESCC | histone H4 acetylation | 53/8552 | 67/18723 | 2.11e-08 | 4.03e-07 | 53 |
| GO:00439811 | Esophagus | ESCC | histone H4-K5 acetylation | 13/8552 | 15/18723 | 1.31e-03 | 6.26e-03 | 13 |
| GO:00439821 | Esophagus | ESCC | histone H4-K8 acetylation | 13/8552 | 15/18723 | 1.31e-03 | 6.26e-03 | 13 |
| GO:004398411 | Esophagus | ESCC | histone H4-K16 acetylation | 16/8552 | 20/18723 | 1.85e-03 | 8.40e-03 | 16 |
| GO:00165707 | Oral cavity | OSCC | histone modification | 270/7305 | 463/18723 | 1.59e-17 | 1.50e-15 | 270 |
| GO:00182056 | Oral cavity | OSCC | peptidyl-lysine modification | 216/7305 | 376/18723 | 2.32e-13 | 1.16e-11 | 216 |
| GO:00435434 | Oral cavity | OSCC | protein acylation | 149/7305 | 243/18723 | 1.33e-12 | 5.80e-11 | 149 |
| GO:00183944 | Oral cavity | OSCC | peptidyl-lysine acetylation | 108/7305 | 169/18723 | 4.55e-11 | 1.45e-09 | 108 |
| GO:00064734 | Oral cavity | OSCC | protein acetylation | 124/7305 | 201/18723 | 5.59e-11 | 1.74e-09 | 124 |
| GO:00165734 | Oral cavity | OSCC | histone acetylation | 96/7305 | 152/18723 | 1.35e-09 | 3.29e-08 | 96 |
| GO:00183934 | Oral cavity | OSCC | internal peptidyl-lysine acetylation | 99/7305 | 158/18723 | 1.41e-09 | 3.39e-08 | 99 |
| GO:00064754 | Oral cavity | OSCC | internal protein amino acid acetylation | 100/7305 | 160/18723 | 1.43e-09 | 3.41e-08 | 100 |
| Page: 1 2 |
| Pathway ID | Tissue | Disease Stage | Description | Gene Ratio | Bg Ratio | pvalue | p.adjust | qvalue | Count |
| Page: 1 |
Top |
Cell-cell communication analysis |
| Identification of potential cell-cell interactions between two cell types and their ligand-receptor pairs for different disease states |
| Ligand | Receptor | LRpair | Pathway | Tissue | Disease Stage |
| Page: 1 |
Top |
Single-cell gene regulatory network inference analysis |
| Find out the significant the regulons (TFs) and the target genes of each regulon across cell types for different disease states |
| TF | Cell Type | Tissue | Disease Stage | Target Gene | RSS | Regulon Activity |
| ∗The dot plots of a searched regulon are shown for all cell subpopulations in each disease state of each tissue based on the regulon specific score inferred using pySCENIC and by calculating the average expression. |
| Page: 1 |
Top |
Somatic mutation of malignant transformation related genes |
| Annotation of somatic variants for genes involved in malignant transformation |
| Hugo Symbol | Variant Class | Variant Classification | dbSNP RS | HGVSc | HGVSp | HGVSp Short | SWISSPROT | BIOTYPE | SIFT | PolyPhen | Tumor Sample Barcode | Tissue | Histology | Sex | Age | Stage | Therapy Types | Drugs | Outcome |
| KANSL2 | SNV | Missense_Mutation | novel | c.649C>G | p.Leu217Val | p.L217V | Q9H9L4 | protein_coding | tolerated(0.44) | benign(0.208) | TCGA-5L-AAT1-01 | Breast | breast invasive carcinoma | Female | <65 | III/IV | Hormone Therapy | letrozol | SD |
| KANSL2 | SNV | Missense_Mutation | rs767969816 | c.1316N>G | p.Lys439Arg | p.K439R | Q9H9L4 | protein_coding | tolerated_low_confidence(0.85) | benign(0) | TCGA-LD-A9QF-01 | Breast | breast invasive carcinoma | Female | >=65 | I/II | Chemotherapy | taxol | SD |
| KANSL2 | SNV | Missense_Mutation | novel | c.794N>A | p.Arg265His | p.R265H | Q9H9L4 | protein_coding | tolerated(0.73) | benign(0.024) | TCGA-2W-A8YY-01 | Cervix | cervical & endocervical cancer | Female | <65 | I/II | Chemotherapy | cisplatin | CR |
| KANSL2 | SNV | Missense_Mutation | novel | c.1013N>A | p.Cys338Tyr | p.C338Y | Q9H9L4 | protein_coding | deleterious(0) | probably_damaging(1) | TCGA-EA-A410-01 | Cervix | cervical & endocervical cancer | Female | <65 | I/II | Unknown | Unknown | SD |
| KANSL2 | SNV | Missense_Mutation | c.511N>A | p.Asp171Asn | p.D171N | Q9H9L4 | protein_coding | deleterious(0) | possibly_damaging(0.654) | TCGA-EK-A2R8-01 | Cervix | cervical & endocervical cancer | Female | <65 | I/II | Unknown | Unknown | SD | |
| KANSL2 | SNV | Missense_Mutation | c.201G>T | p.Lys67Asn | p.K67N | Q9H9L4 | protein_coding | tolerated(0.09) | benign(0.066) | TCGA-FU-A3HZ-01 | Cervix | cervical & endocervical cancer | Female | <65 | I/II | Chemotherapy | cisplatin | CR | |
| KANSL2 | SNV | Missense_Mutation | c.896G>A | p.Ser299Asn | p.S299N | Q9H9L4 | protein_coding | tolerated(0.29) | benign(0.326) | TCGA-A6-3809-01 | Colorectum | colon adenocarcinoma | Female | >=65 | I/II | Unknown | Unknown | SD | |
| KANSL2 | SNV | Missense_Mutation | rs762627177 | c.1120N>A | p.Glu374Lys | p.E374K | Q9H9L4 | protein_coding | deleterious(0.04) | benign(0.06) | TCGA-AA-A010-01 | Colorectum | colon adenocarcinoma | Female | <65 | I/II | Chemotherapy | folinic | CR |
| KANSL2 | SNV | Missense_Mutation | c.475N>A | p.Asp159Asn | p.D159N | Q9H9L4 | protein_coding | tolerated(0.11) | benign(0.123) | TCGA-AA-A010-01 | Colorectum | colon adenocarcinoma | Female | <65 | I/II | Chemotherapy | folinic | CR | |
| KANSL2 | SNV | Missense_Mutation | c.956C>T | p.Thr319Ile | p.T319I | Q9H9L4 | protein_coding | deleterious(0.04) | possibly_damaging(0.65) | TCGA-AA-A02R-01 | Colorectum | colon adenocarcinoma | Female | >=65 | I/II | Unknown | Unknown | PD |
| Page: 1 2 3 4 |
Top |
Related drugs of malignant transformation related genes |
| Identification of chemicals and drugs interact with genes involved in malignant transfromation |
| (DGIdb 4.0) |
| Entrez ID | Symbol | Category | Interaction Types | Drug Claim Name | Drug Name | PMIDs |
| Page: 1 |

Copyright 2023-Present -The University of Texas Health Science Center at Houston |