| Tissue | Expression Dynamics | Abbreviation |
| Cervix | 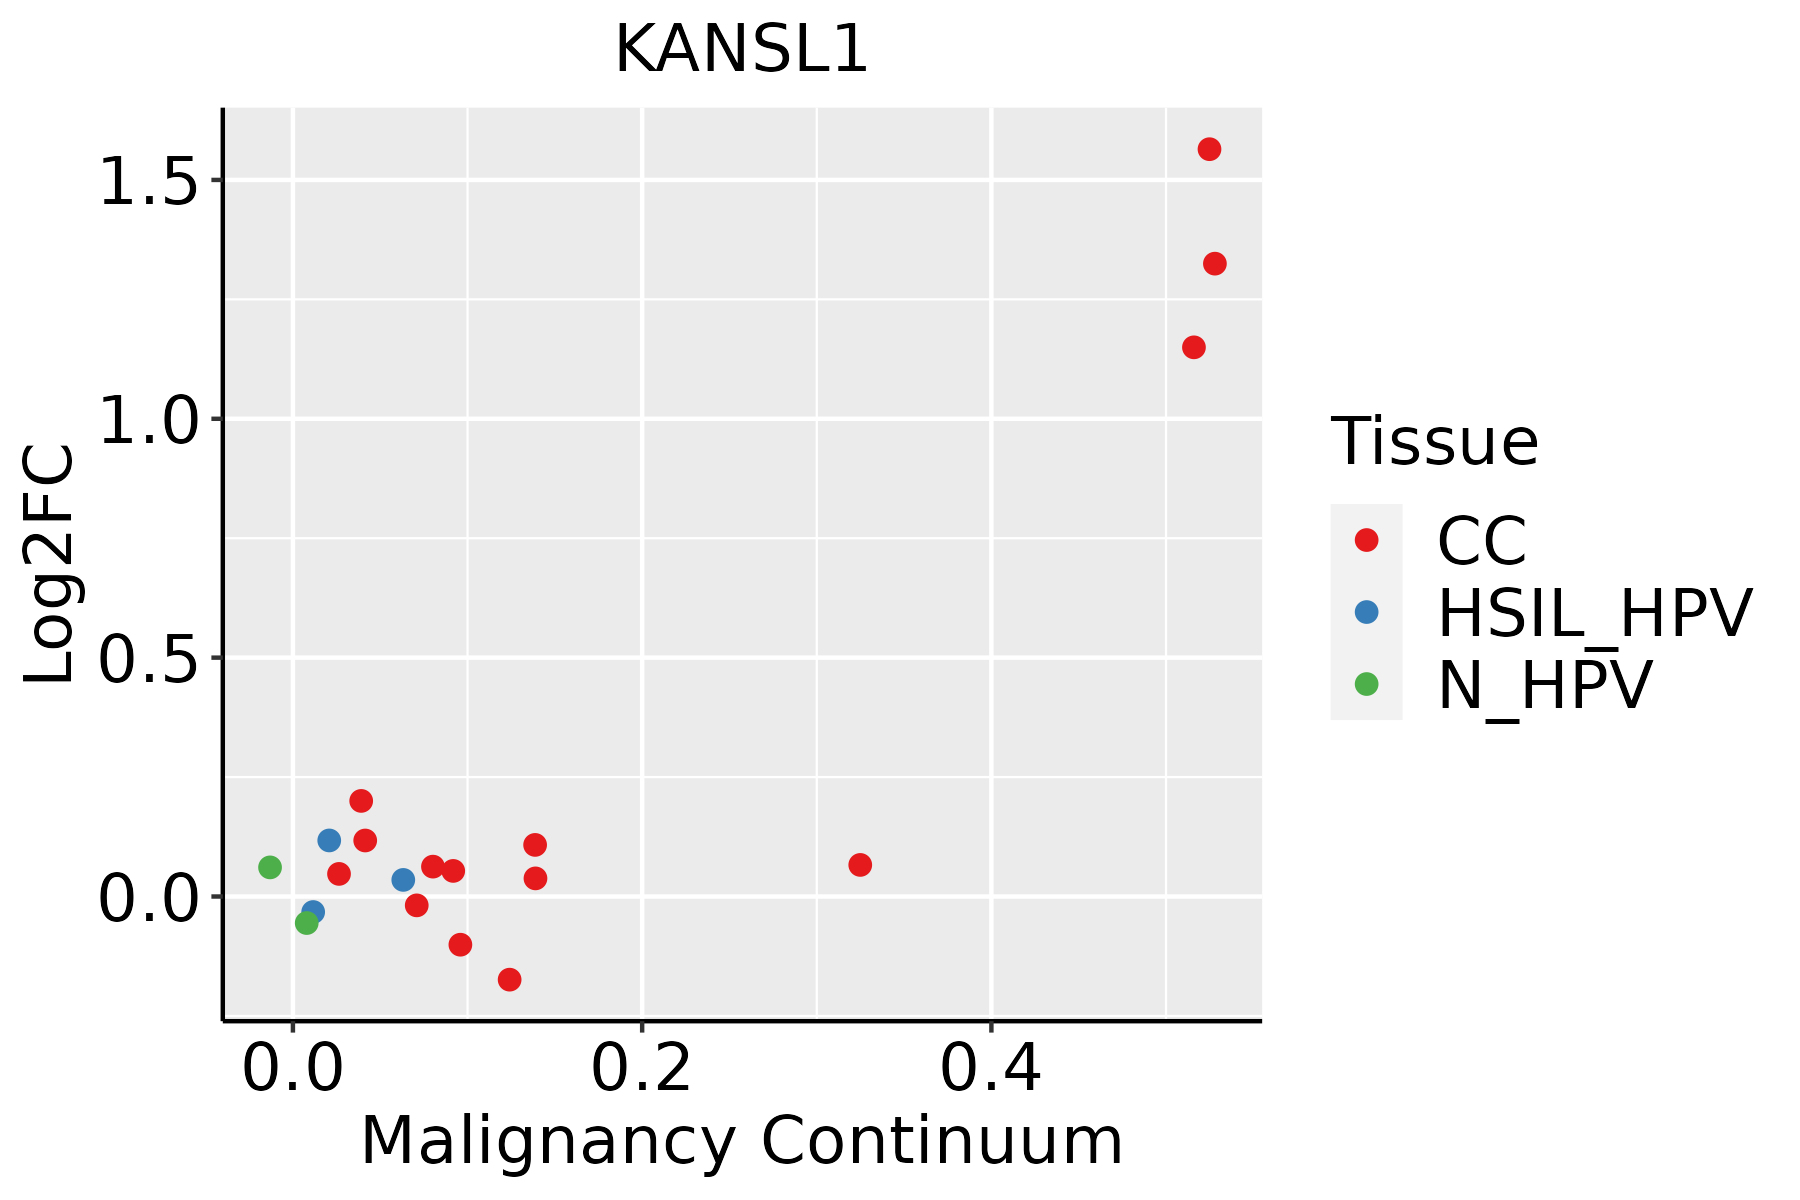 | CC: Cervix cancer |
| HSIL_HPV: HPV-infected high-grade squamous intraepithelial lesions |
| N_HPV: HPV-infected normal cervix |
| Colorectum (GSE201348) |  | FAP: Familial adenomatous polyposis |
| CRC: Colorectal cancer |
| Colorectum (HTA11) | 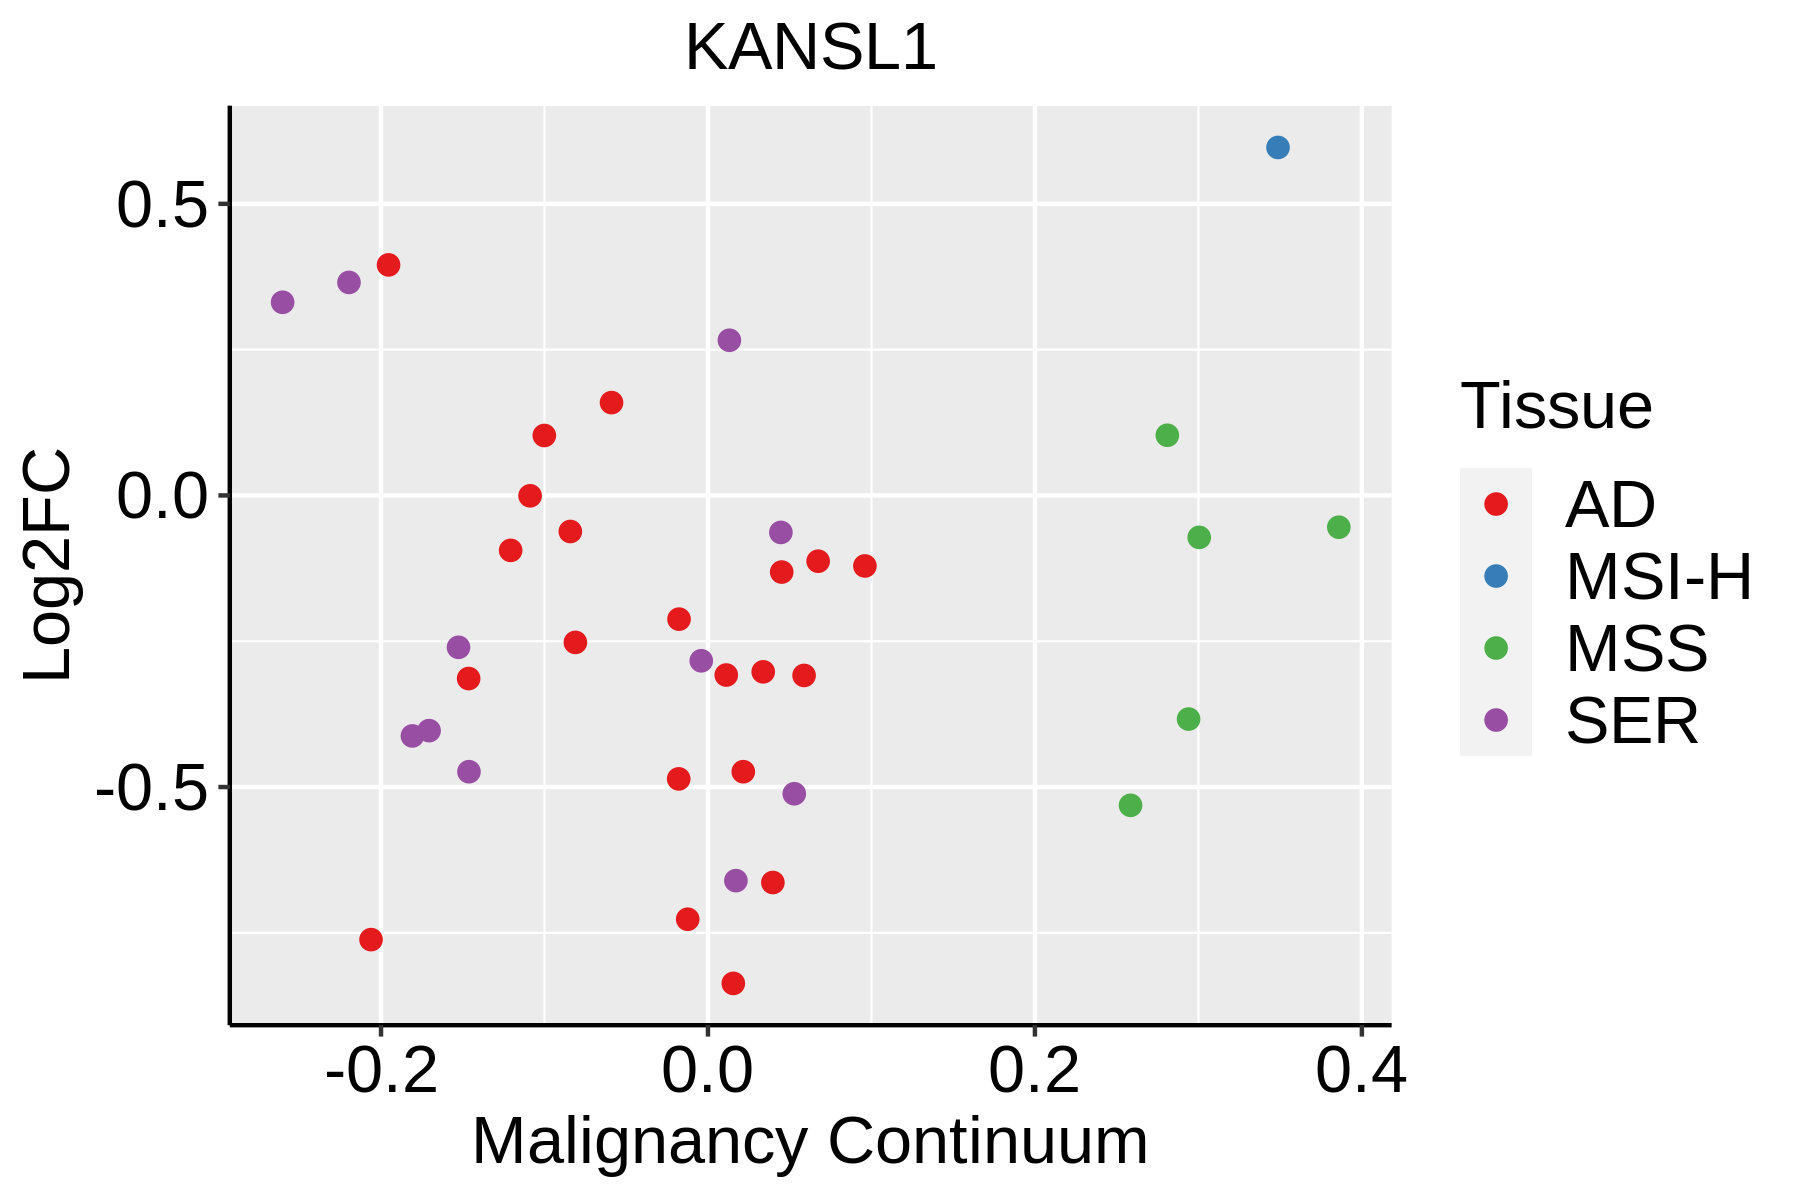 | AD: Adenomas |
| SER: Sessile serrated lesions |
| MSI-H: Microsatellite-high colorectal cancer |
| MSS: Microsatellite stable colorectal cancer |
| Endometrium |  | AEH: Atypical endometrial hyperplasia |
| EEC: Endometrioid Cancer |
| Esophagus |  | ESCC: Esophageal squamous cell carcinoma |
| HGIN: High-grade intraepithelial neoplasias |
| LGIN: Low-grade intraepithelial neoplasias |
| Liver | 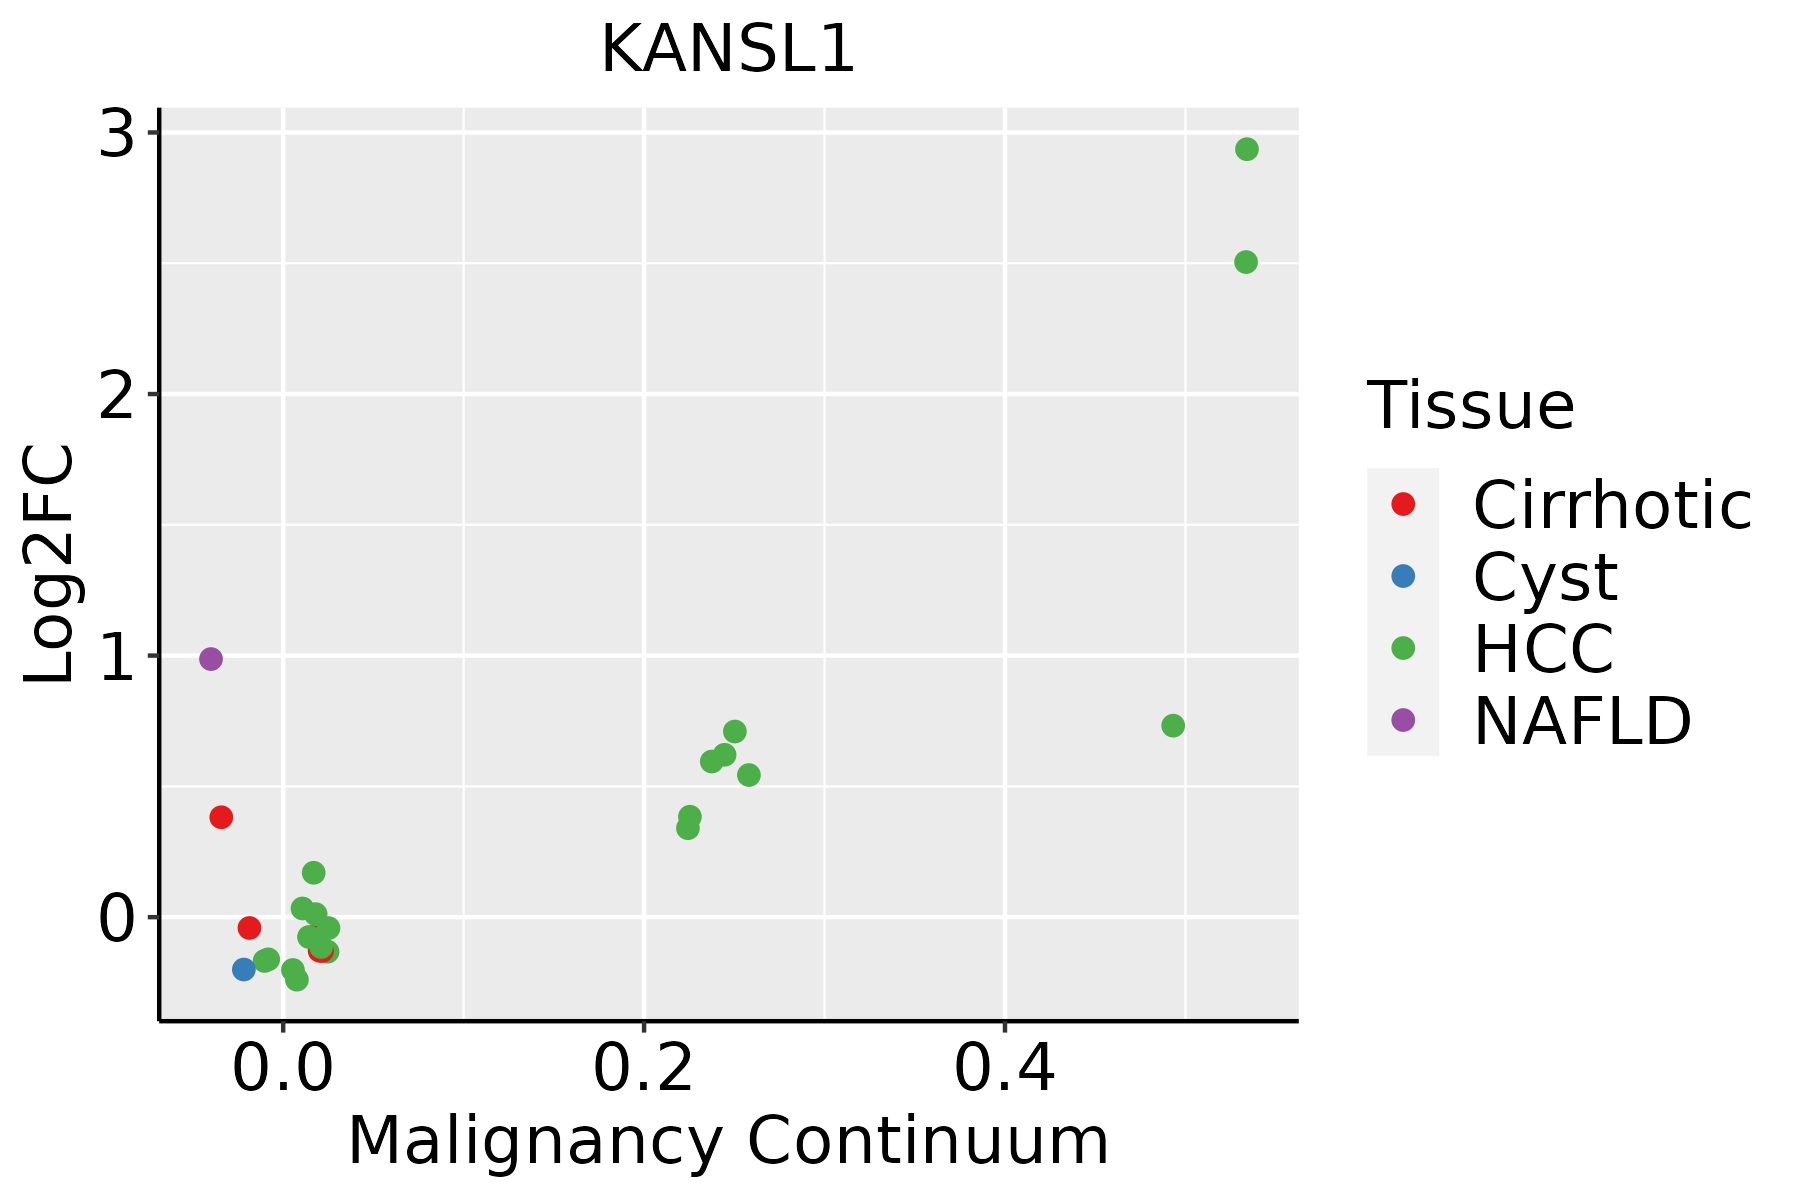 | HCC: Hepatocellular carcinoma |
| NAFLD: Non-alcoholic fatty liver disease |
| Lung |  | AAH: Atypical adenomatous hyperplasia |
| AIS: Adenocarcinoma in situ |
| IAC: Invasive lung adenocarcinoma |
| MIA: Minimally invasive adenocarcinoma |
| Oral Cavity | 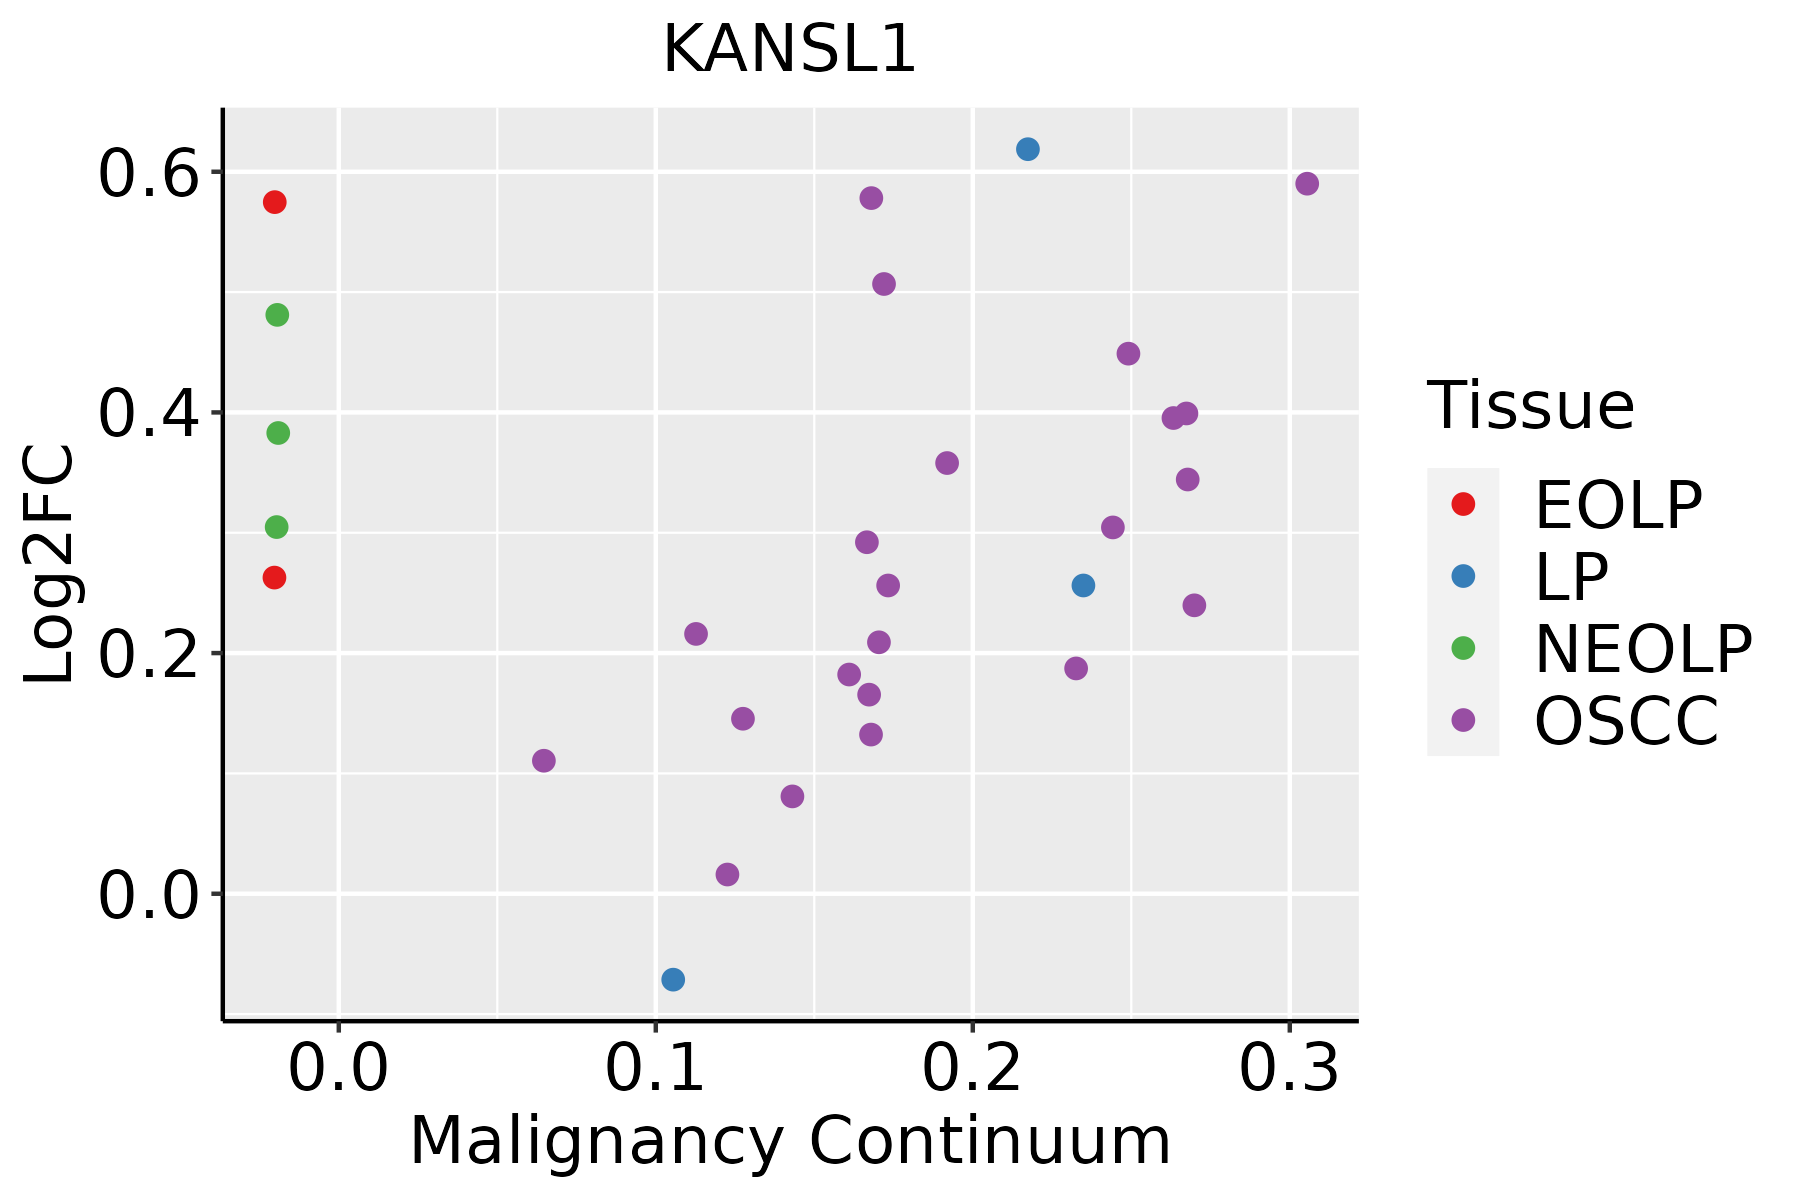 | EOLP: Erosive Oral lichen planus |
| LP: leukoplakia |
| NEOLP: Non-erosive oral lichen planus |
| OSCC: Oral squamous cell carcinoma |
| Prostate |  | BPH: Benign Prostatic Hyperplasia |
| Skin |  | AK: Actinic keratosis |
| cSCC: Cutaneous squamous cell carcinoma |
| SCCIS:squamous cell carcinoma in situ |
| Thyroid |  | ATC: Anaplastic thyroid cancer |
| HT: Hashimoto's thyroiditis |
| PTC: Papillary thyroid cancer |
| GO ID | Tissue | Disease Stage | Description | Gene Ratio | Bg Ratio | pvalue | p.adjust | Count |
| GO:00165705 | Cervix | CC | histone modification | 84/2311 | 463/18723 | 1.70e-04 | 2.01e-03 | 84 |
| GO:00182054 | Cervix | CC | peptidyl-lysine modification | 62/2311 | 376/18723 | 1.04e-02 | 4.97e-02 | 62 |
| GO:0016570 | Colorectum | MSS | histone modification | 113/3467 | 463/18723 | 8.37e-04 | 8.68e-03 | 113 |
| GO:00165701 | Colorectum | FAP | histone modification | 94/2622 | 463/18723 | 1.06e-04 | 1.76e-03 | 94 |
| GO:00165702 | Colorectum | CRC | histone modification | 75/2078 | 463/18723 | 4.95e-04 | 7.06e-03 | 75 |
| GO:00182057 | Esophagus | HGIN | peptidyl-lysine modification | 88/2587 | 376/18723 | 2.99e-07 | 1.39e-05 | 88 |
| GO:00165708 | Esophagus | HGIN | histone modification | 92/2587 | 463/18723 | 1.70e-04 | 3.30e-03 | 92 |
| GO:00064735 | Esophagus | HGIN | protein acetylation | 45/2587 | 201/18723 | 6.17e-04 | 8.58e-03 | 45 |
| GO:00439844 | Esophagus | HGIN | histone H4-K16 acetylation | 9/2587 | 20/18723 | 7.18e-04 | 9.60e-03 | 9 |
| GO:00183945 | Esophagus | HGIN | peptidyl-lysine acetylation | 39/2587 | 169/18723 | 7.46e-04 | 9.90e-03 | 39 |
| GO:00435435 | Esophagus | HGIN | protein acylation | 51/2587 | 243/18723 | 1.33e-03 | 1.57e-02 | 51 |
| GO:00439675 | Esophagus | HGIN | histone H4 acetylation | 19/2587 | 67/18723 | 1.39e-03 | 1.63e-02 | 19 |
| GO:00064755 | Esophagus | HGIN | internal protein amino acid acetylation | 36/2587 | 160/18723 | 1.87e-03 | 2.01e-02 | 36 |
| GO:00183935 | Esophagus | HGIN | internal peptidyl-lysine acetylation | 35/2587 | 158/18723 | 2.82e-03 | 2.75e-02 | 35 |
| GO:001657015 | Esophagus | ESCC | histone modification | 323/8552 | 463/18723 | 2.61e-26 | 7.88e-24 | 323 |
| GO:001820514 | Esophagus | ESCC | peptidyl-lysine modification | 259/8552 | 376/18723 | 3.90e-20 | 5.26e-18 | 259 |
| GO:001839413 | Esophagus | ESCC | peptidyl-lysine acetylation | 123/8552 | 169/18723 | 6.58e-13 | 2.94e-11 | 123 |
| GO:004354313 | Esophagus | ESCC | protein acylation | 165/8552 | 243/18723 | 1.69e-12 | 7.14e-11 | 165 |
| GO:000647313 | Esophagus | ESCC | protein acetylation | 140/8552 | 201/18723 | 4.37e-12 | 1.69e-10 | 140 |
| GO:001839313 | Esophagus | ESCC | internal peptidyl-lysine acetylation | 114/8552 | 158/18723 | 1.16e-11 | 4.24e-10 | 114 |
| Hugo Symbol | Variant Class | Variant Classification | dbSNP RS | HGVSc | HGVSp | HGVSp Short | SWISSPROT | BIOTYPE | SIFT | PolyPhen | Tumor Sample Barcode | Tissue | Histology | Sex | Age | Stage | Therapy Types | Drugs | Outcome |
| KANSL1 | SNV | Missense_Mutation | rs369793673 | c.103N>A | p.Glu35Lys | p.E35K | Q7Z3B3 | protein_coding | deleterious(0) | probably_damaging(0.999) | TCGA-AN-A046-01 | Breast | breast invasive carcinoma | Female | >=65 | I/II | Unknown | Unknown | SD |
| KANSL1 | SNV | Missense_Mutation | novel | c.1527N>A | p.Asp509Glu | p.D509E | Q7Z3B3 | protein_coding | tolerated(0.62) | benign(0.017) | TCGA-BH-A18L-01 | Breast | breast invasive carcinoma | Female | <65 | III/IV | Unknown | Unknown | SD |
| KANSL1 | SNV | Missense_Mutation | rs779806189 | c.2660C>T | p.Thr887Met | p.T887M | Q7Z3B3 | protein_coding | deleterious(0) | probably_damaging(0.999) | TCGA-OL-A6VQ-01 | Breast | breast invasive carcinoma | Female | <65 | I/II | Unknown | Unknown | SD |
| KANSL1 | SNV | Missense_Mutation | novel | c.2358N>A | p.Met786Ile | p.M786I | Q7Z3B3 | protein_coding | deleterious(0.03) | benign(0.037) | TCGA-PE-A5DE-01 | Breast | breast invasive carcinoma | Female | <65 | I/II | Chemotherapy | taxotere | CR |
| KANSL1 | insertion | In_Frame_Ins | novel | c.3091_3092insGGAGATATATGGAACTAGTGGAGATATATGGAA | p.Ser1031delinsTrpArgTyrMetGluLeuValGluIleTyrGlyThr | p.S1031delinsWRYMELVEIYGT | Q7Z3B3 | protein_coding | | | TCGA-A8-A07G-01 | Breast | breast invasive carcinoma | Female | >=65 | I/II | Chemotherapy | 5-fluorouracil | CR |
| KANSL1 | deletion | Frame_Shift_Del | | c.2902delN | p.Gln968SerfsTer46 | p.Q968Sfs*46 | Q7Z3B3 | protein_coding | | | TCGA-AN-A0AK-01 | Breast | breast invasive carcinoma | Female | >=65 | I/II | Unknown | Unknown | SD |
| KANSL1 | insertion | Frame_Shift_Ins | novel | c.2277_2278insAACCAGTTTTATTCTCATCACCTGCTCTCTATCTCTGGCTCTAAAT | p.Val760AsnfsTer36 | p.V760Nfs*36 | Q7Z3B3 | protein_coding | | | TCGA-AN-A0FN-01 | Breast | breast invasive carcinoma | Female | <65 | I/II | Unknown | Unknown | SD |
| KANSL1 | deletion | Frame_Shift_Del | novel | c.1710delN | p.Gln570HisfsTer8 | p.Q570Hfs*8 | Q7Z3B3 | protein_coding | | | TCGA-D8-A27V-01 | Breast | breast invasive carcinoma | Female | <65 | I/II | Hormone Therapy | tamoxiphen | SD |
| KANSL1 | SNV | Missense_Mutation | novel | c.2201N>T | p.Ala734Val | p.A734V | Q7Z3B3 | protein_coding | tolerated(0.27) | benign(0.148) | TCGA-2W-A8YY-01 | Cervix | cervical & endocervical cancer | Female | <65 | I/II | Chemotherapy | cisplatin | CR |
| KANSL1 | SNV | Missense_Mutation | rs775472991 | c.31N>A | p.Ala11Thr | p.A11T | Q7Z3B3 | protein_coding | deleterious(0) | probably_damaging(0.977) | TCGA-2W-A8YY-01 | Cervix | cervical & endocervical cancer | Female | <65 | I/II | Chemotherapy | cisplatin | CR |


