
|
|||||
|
 | |
| |
| |
| |
| |
| |
|
Gene: KANK1 |
Gene summary for KANK1 |
| Gene information | Species | Human | Gene symbol | KANK1 | Gene ID | 23189 |
| Gene name | KN motif and ankyrin repeat domains 1 | |
| Gene Alias | ANKRD15 | |
| Cytomap | 9p24.3 | |
| Gene Type | protein-coding | GO ID | GO:0000902 | UniProtAcc | Q14678 |
Top |
Malignant transformation analysis |
| Identification of the aberrant gene expression in precancerous and cancerous lesions by comparing the gene expression of stem-like cells in diseased tissues with normal stem cells |
| Entrez ID | Symbol | Replicates | Species | Organ | Tissue | Adj P-value | Log2FC | Malignancy |
| 23189 | KANK1 | CCI_2 | Human | Cervix | CC | 8.90e-11 | 1.13e+00 | 0.5249 |
| 23189 | KANK1 | CCI_3 | Human | Cervix | CC | 2.38e-25 | 1.33e+00 | 0.516 |
| 23189 | KANK1 | HTA11_347_2000001011 | Human | Colorectum | AD | 1.57e-03 | 3.92e-01 | -0.1954 |
| 23189 | KANK1 | HTA11_1391_2000001011 | Human | Colorectum | AD | 1.25e-03 | 5.77e-01 | -0.059 |
| 23189 | KANK1 | HTA11_4255_2000001011 | Human | Colorectum | SER | 3.34e-05 | 5.61e-01 | 0.0446 |
| 23189 | KANK1 | HTA11_7663_2000001011 | Human | Colorectum | SER | 3.01e-04 | 6.80e-01 | 0.0131 |
| 23189 | KANK1 | HTA11_7469_2000001011 | Human | Colorectum | AD | 6.36e-03 | -8.09e-01 | -0.0124 |
| 23189 | KANK1 | HTA11_99999965062_69753 | Human | Colorectum | MSI-H | 1.60e-32 | 1.49e+00 | 0.3487 |
| 23189 | KANK1 | HTA11_99999965104_69814 | Human | Colorectum | MSS | 2.50e-22 | 1.27e+00 | 0.281 |
| 23189 | KANK1 | HTA11_99999971662_82457 | Human | Colorectum | MSS | 5.62e-07 | 7.93e-01 | 0.3859 |
| 23189 | KANK1 | A001-C-207 | Human | Colorectum | FAP | 7.96e-04 | 1.90e-01 | 0.1278 |
| 23189 | KANK1 | A015-C-203 | Human | Colorectum | FAP | 1.76e-13 | -1.94e-01 | -0.1294 |
| 23189 | KANK1 | A002-C-201 | Human | Colorectum | FAP | 6.82e-03 | -1.92e-01 | 0.0324 |
| 23189 | KANK1 | A001-C-108 | Human | Colorectum | FAP | 2.04e-05 | -2.42e-03 | -0.0272 |
| 23189 | KANK1 | A002-C-205 | Human | Colorectum | FAP | 8.13e-14 | -3.16e-01 | -0.1236 |
| 23189 | KANK1 | A001-C-104 | Human | Colorectum | FAP | 4.15e-04 | 6.19e-02 | 0.0184 |
| 23189 | KANK1 | A015-C-006 | Human | Colorectum | FAP | 3.77e-12 | -3.73e-01 | -0.0994 |
| 23189 | KANK1 | A015-C-106 | Human | Colorectum | FAP | 6.23e-05 | 3.59e-02 | -0.0511 |
| 23189 | KANK1 | A002-C-114 | Human | Colorectum | FAP | 4.40e-15 | -5.33e-01 | -0.1561 |
| 23189 | KANK1 | A015-C-104 | Human | Colorectum | FAP | 1.74e-20 | -2.60e-01 | -0.1899 |
| Page: 1 2 3 4 5 6 |
| Tissue | Expression Dynamics | Abbreviation |
| Cervix | 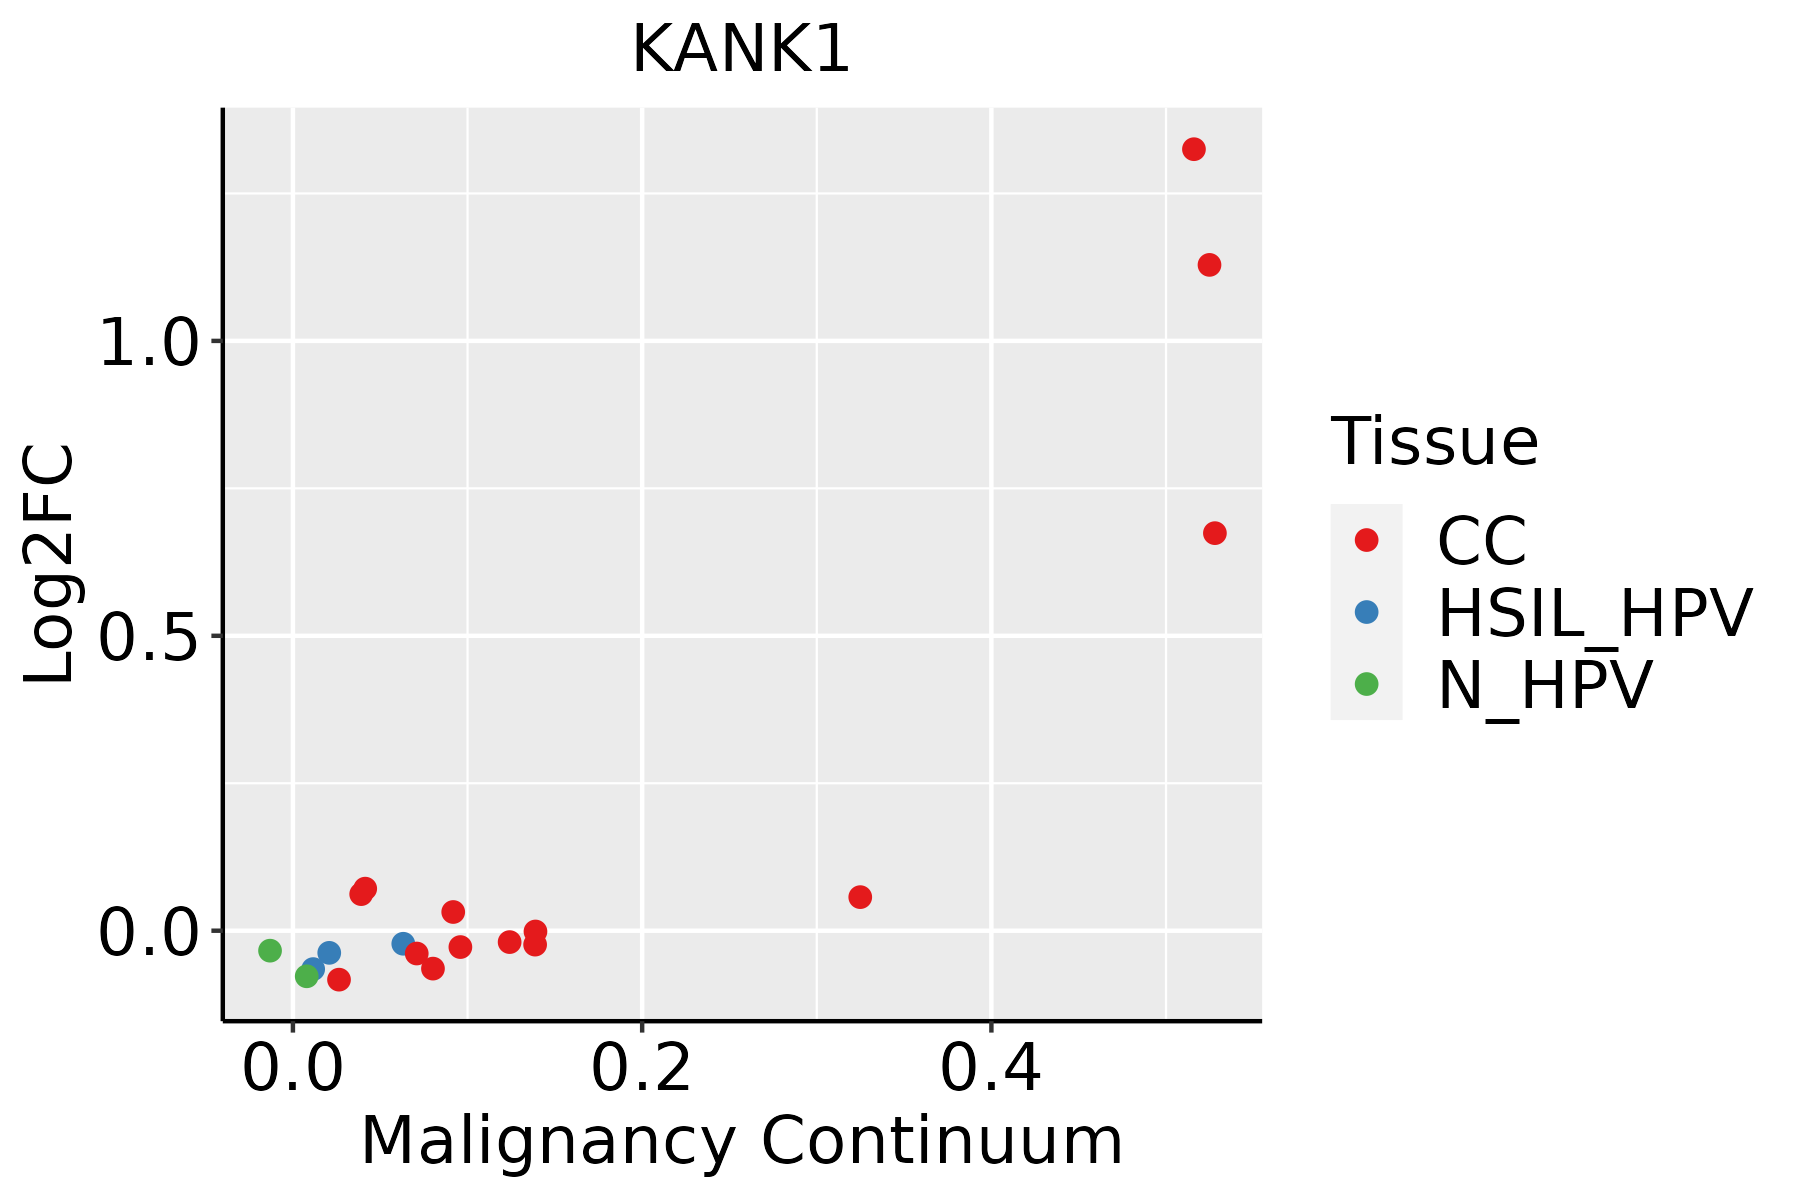 | CC: Cervix cancer |
| HSIL_HPV: HPV-infected high-grade squamous intraepithelial lesions | ||
| N_HPV: HPV-infected normal cervix | ||
| Colorectum (GSE201348) |  | FAP: Familial adenomatous polyposis |
| CRC: Colorectal cancer | ||
| Colorectum (HTA11) |  | AD: Adenomas |
| SER: Sessile serrated lesions | ||
| MSI-H: Microsatellite-high colorectal cancer | ||
| MSS: Microsatellite stable colorectal cancer | ||
| Endometrium |  | AEH: Atypical endometrial hyperplasia |
| EEC: Endometrioid Cancer | ||
| Liver | 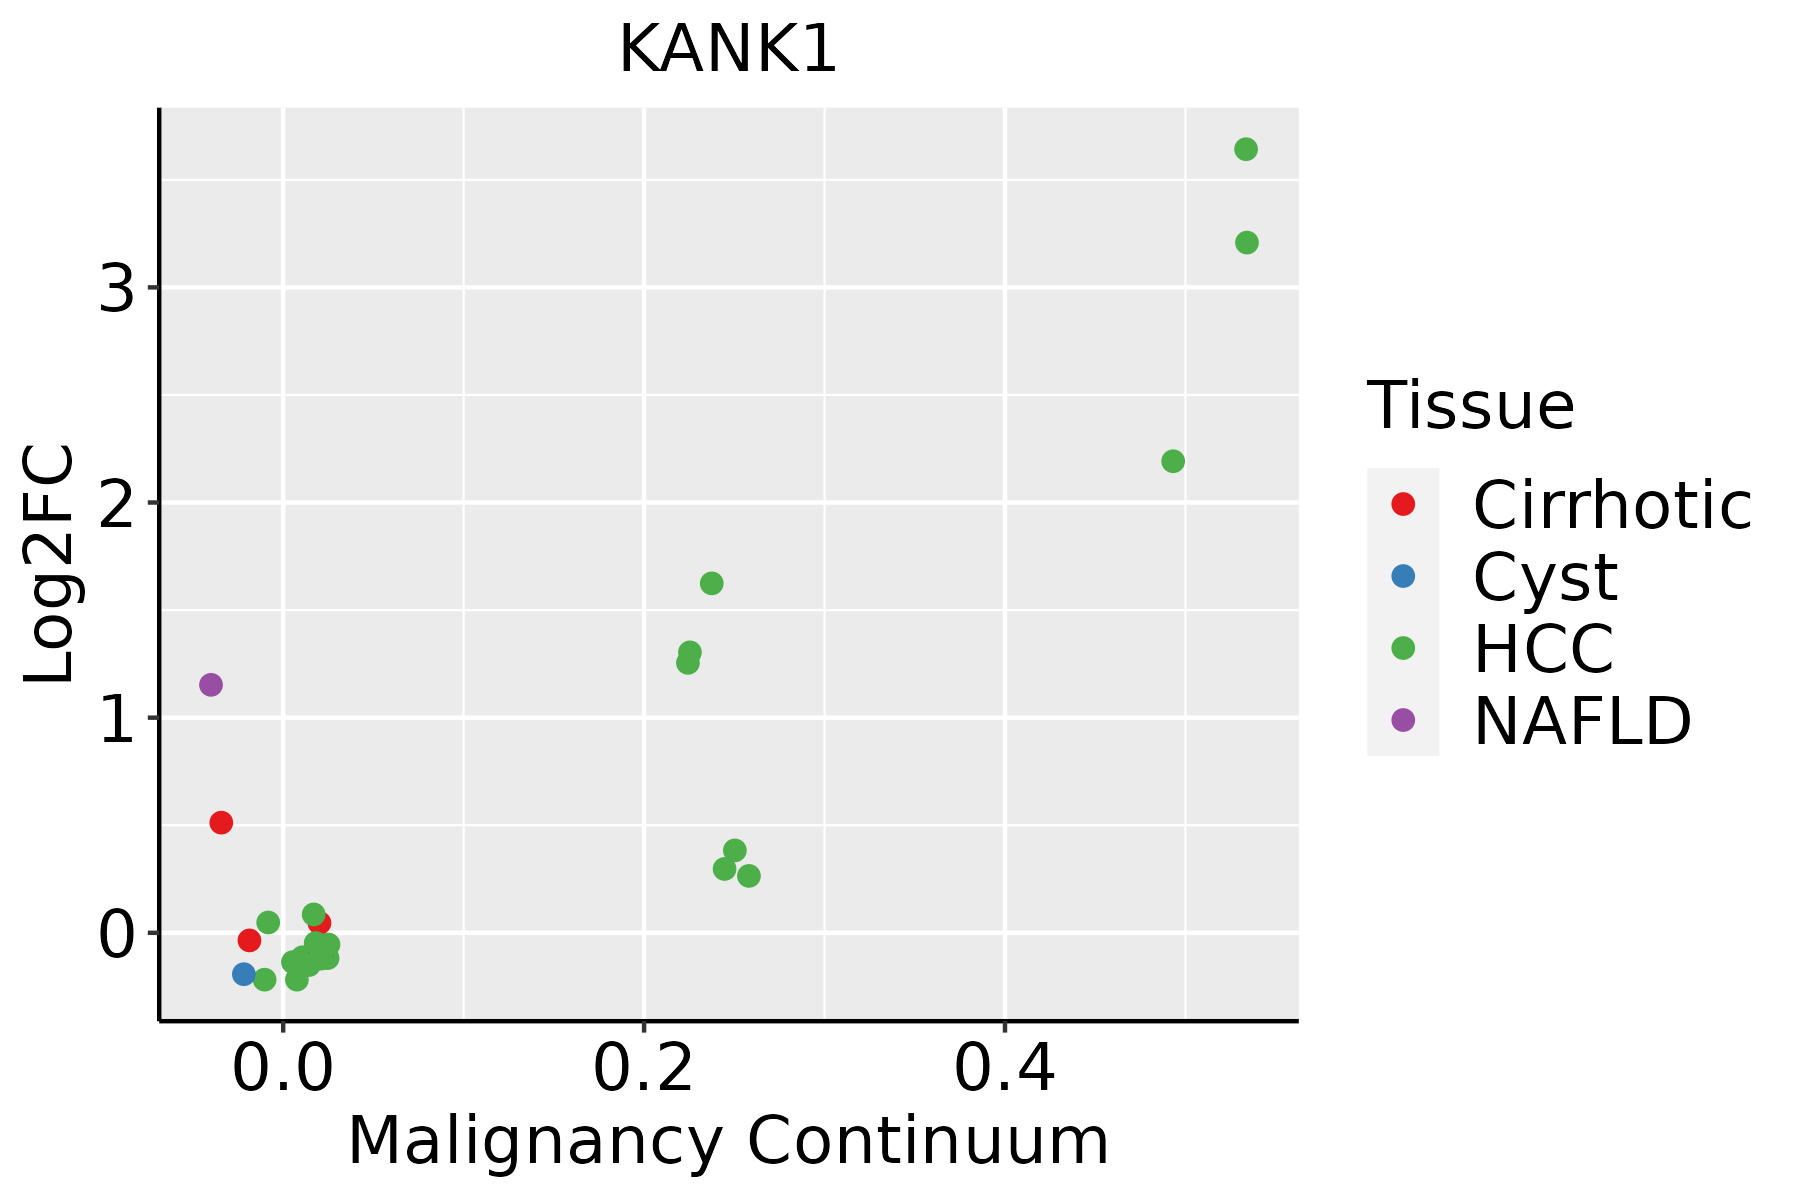 | HCC: Hepatocellular carcinoma |
| NAFLD: Non-alcoholic fatty liver disease | ||
| Lung |  | AAH: Atypical adenomatous hyperplasia |
| AIS: Adenocarcinoma in situ | ||
| IAC: Invasive lung adenocarcinoma | ||
| MIA: Minimally invasive adenocarcinoma | ||
| Oral Cavity |  | EOLP: Erosive Oral lichen planus |
| LP: leukoplakia | ||
| NEOLP: Non-erosive oral lichen planus | ||
| OSCC: Oral squamous cell carcinoma | ||
| Prostate | 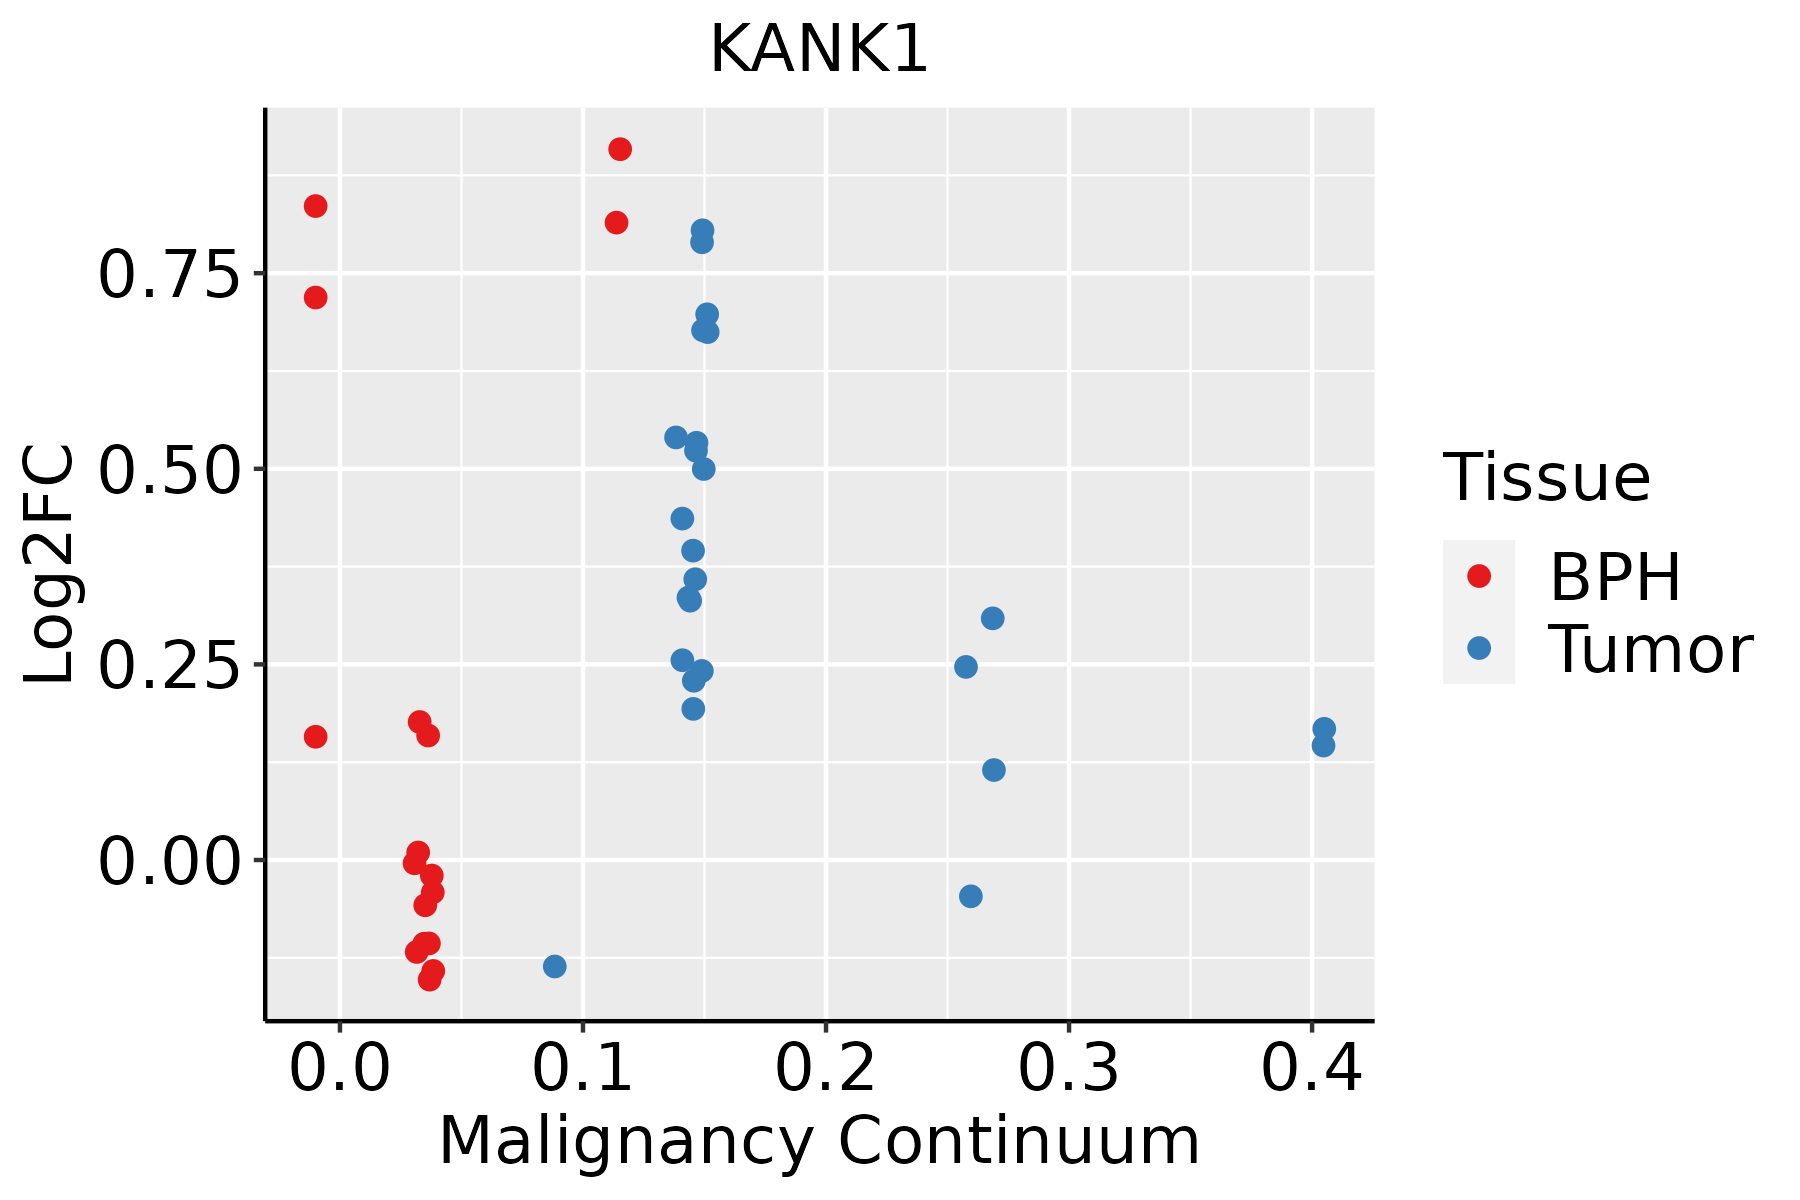 | BPH: Benign Prostatic Hyperplasia |
| Thyroid | 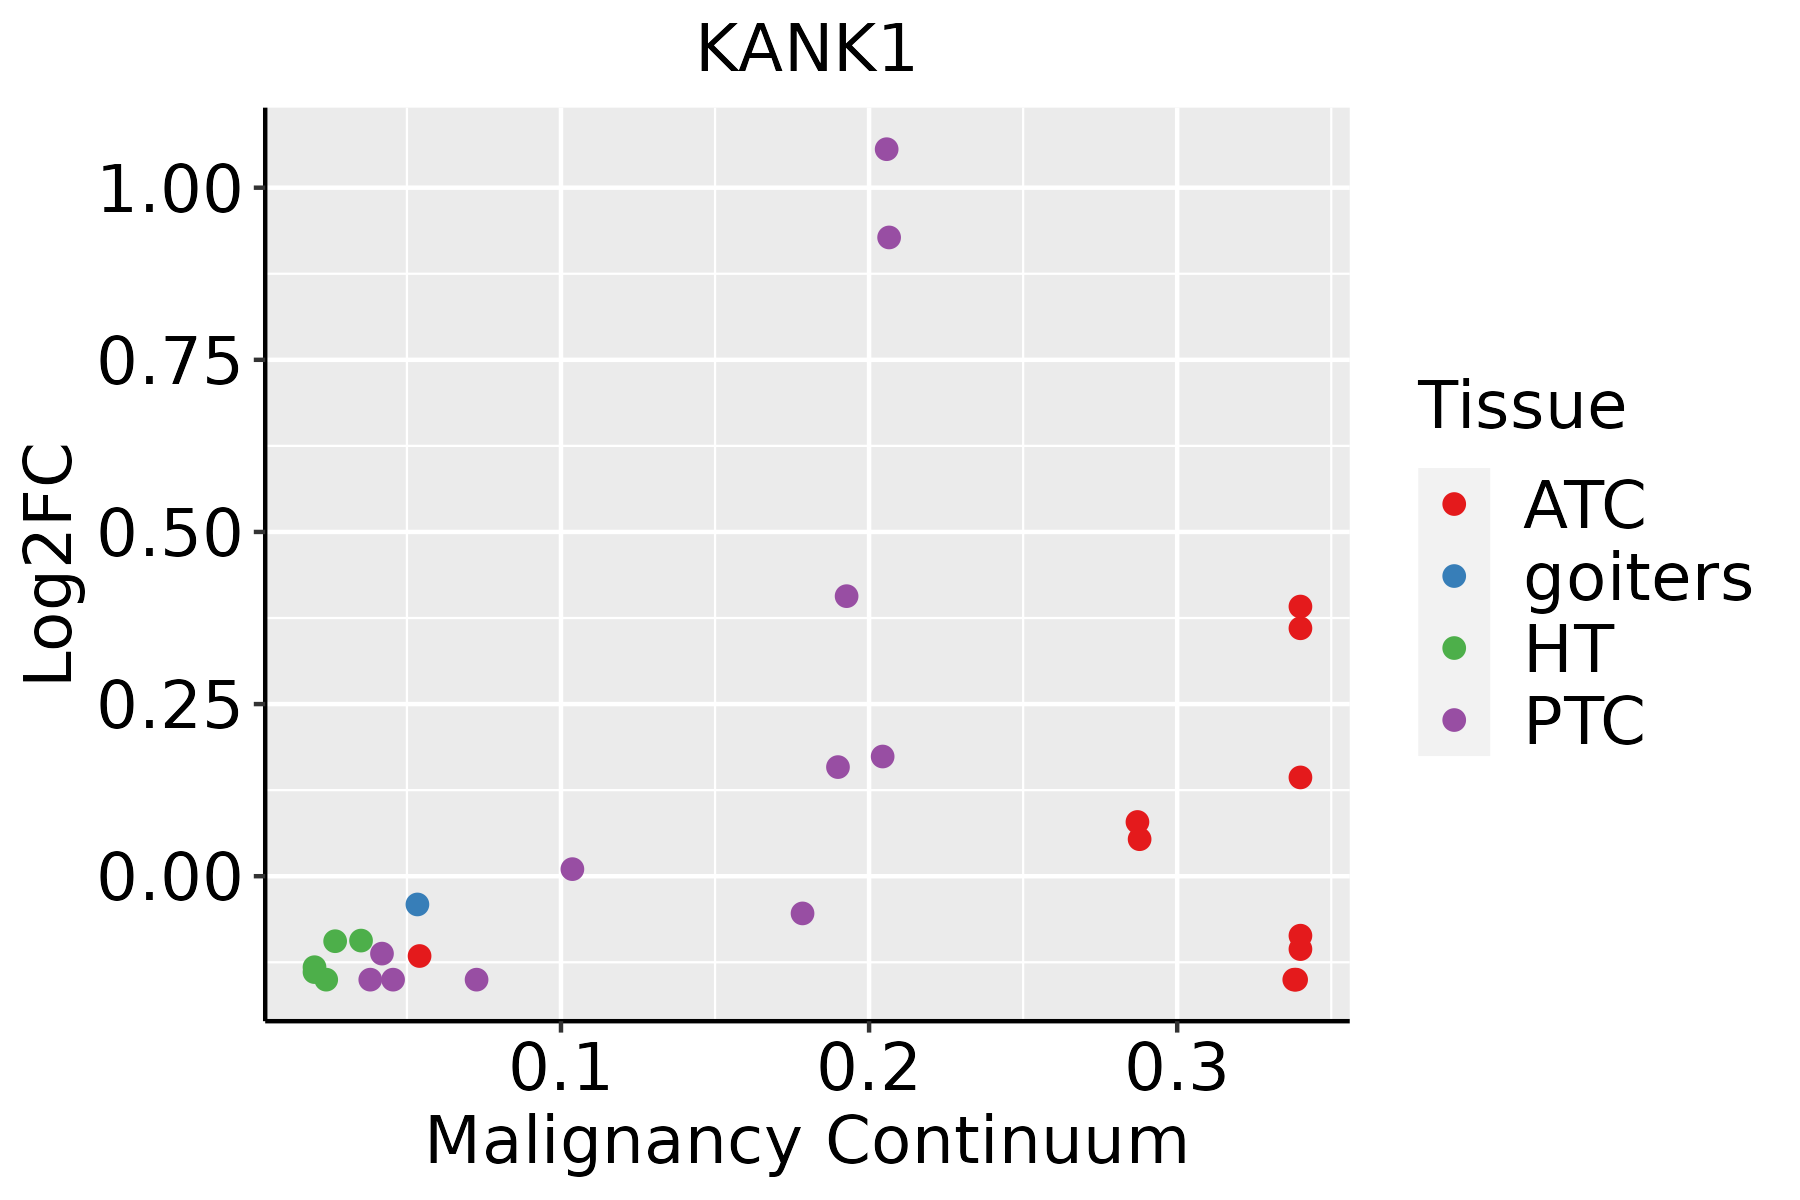 | ATC: Anaplastic thyroid cancer |
| HT: Hashimoto's thyroiditis | ||
| PTC: Papillary thyroid cancer |
| ∗log2FC in expression of this searched gene in stem-like cells from each diseased tissue sample relative to stem-like cells in normal samples in each tissue plotted against the malignancy continuum. Samples are colored based on if they are from different disease stage. |
Top |
Malignant transformation related pathway analysis |
| Find out the enriched GO biological processes and KEGG pathways involved in transition from healthy to precancer to cancer |
| Tissue | Disease Stage | Enriched GO biological Processes |
| Colorectum | AD |  |
| Colorectum | SER |  |
| Colorectum | MSS |  |
| Colorectum | MSI-H |  |
| Colorectum | FAP |  |
| ∗Top 15 enriched GO BP terms are showed in the bar plot of each disease state in each tissue. Each row represents a significant GO biological process which is colored according to the -log10(p.adjust). |
| Page: 1 2 3 4 5 6 7 8 9 |
| GO ID | Tissue | Disease Stage | Description | Gene Ratio | Bg Ratio | pvalue | p.adjust | Count |
| GO:004206010 | Cervix | CC | wound healing | 109/2311 | 422/18723 | 1.84e-14 | 1.57e-11 | 109 |
| GO:001081010 | Cervix | CC | regulation of cell-substrate adhesion | 69/2311 | 221/18723 | 8.57e-14 | 5.69e-11 | 69 |
| GO:00315898 | Cervix | CC | cell-substrate adhesion | 96/2311 | 363/18723 | 1.48e-13 | 8.85e-11 | 96 |
| GO:000701510 | Cervix | CC | actin filament organization | 109/2311 | 442/18723 | 4.92e-13 | 2.45e-10 | 109 |
| GO:002260410 | Cervix | CC | regulation of cell morphogenesis | 84/2311 | 309/18723 | 1.00e-12 | 4.29e-10 | 84 |
| GO:009013210 | Cervix | CC | epithelium migration | 90/2311 | 360/18723 | 2.45e-11 | 6.11e-09 | 90 |
| GO:00016679 | Cervix | CC | ameboidal-type cell migration | 110/2311 | 475/18723 | 2.66e-11 | 6.36e-09 | 110 |
| GO:001063110 | Cervix | CC | epithelial cell migration | 89/2311 | 357/18723 | 3.72e-11 | 8.54e-09 | 89 |
| GO:003297010 | Cervix | CC | regulation of actin filament-based process | 96/2311 | 397/18723 | 4.00e-11 | 8.54e-09 | 96 |
| GO:00071639 | Cervix | CC | establishment or maintenance of cell polarity | 63/2311 | 218/18723 | 4.25e-11 | 8.76e-09 | 63 |
| GO:009013010 | Cervix | CC | tissue migration | 90/2311 | 365/18723 | 5.42e-11 | 1.05e-08 | 90 |
| GO:190290310 | Cervix | CC | regulation of supramolecular fiber organization | 92/2311 | 383/18723 | 1.49e-10 | 2.48e-08 | 92 |
| GO:003295610 | Cervix | CC | regulation of actin cytoskeleton organization | 86/2311 | 358/18723 | 5.90e-10 | 7.51e-08 | 86 |
| GO:00510566 | Cervix | CC | regulation of small GTPase mediated signal transduction | 75/2311 | 302/18723 | 1.54e-09 | 1.74e-07 | 75 |
| GO:004325410 | Cervix | CC | regulation of protein-containing complex assembly | 96/2311 | 428/18723 | 2.91e-09 | 3.05e-07 | 96 |
| GO:00160557 | Cervix | CC | Wnt signaling pathway | 98/2311 | 444/18723 | 4.82e-09 | 4.65e-07 | 98 |
| GO:01987387 | Cervix | CC | cell-cell signaling by wnt | 98/2311 | 446/18723 | 6.16e-09 | 5.58e-07 | 98 |
| GO:00072656 | Cervix | CC | Ras protein signal transduction | 79/2311 | 337/18723 | 9.49e-09 | 7.77e-07 | 79 |
| GO:00071626 | Cervix | CC | negative regulation of cell adhesion | 72/2311 | 303/18723 | 2.36e-08 | 1.70e-06 | 72 |
| GO:00301117 | Cervix | CC | regulation of Wnt signaling pathway | 76/2311 | 328/18723 | 3.05e-08 | 2.08e-06 | 76 |
| Page: 1 2 3 4 5 6 7 8 9 10 11 12 13 14 15 16 17 18 19 20 21 22 23 24 25 26 27 28 29 30 31 32 33 34 35 36 37 38 39 40 41 42 43 44 45 46 47 48 49 50 51 52 53 54 55 56 57 58 59 60 61 62 63 64 65 66 67 |
| Pathway ID | Tissue | Disease Stage | Description | Gene Ratio | Bg Ratio | pvalue | p.adjust | qvalue | Count |
| Page: 1 |
Top |
Cell-cell communication analysis |
| Identification of potential cell-cell interactions between two cell types and their ligand-receptor pairs for different disease states |
| Ligand | Receptor | LRpair | Pathway | Tissue | Disease Stage |
| Page: 1 |
Top |
Single-cell gene regulatory network inference analysis |
| Find out the significant the regulons (TFs) and the target genes of each regulon across cell types for different disease states |
| TF | Cell Type | Tissue | Disease Stage | Target Gene | RSS | Regulon Activity |
| ∗The dot plots of a searched regulon are shown for all cell subpopulations in each disease state of each tissue based on the regulon specific score inferred using pySCENIC and by calculating the average expression. |
| Page: 1 |
Top |
Somatic mutation of malignant transformation related genes |
| Annotation of somatic variants for genes involved in malignant transformation |
| Hugo Symbol | Variant Class | Variant Classification | dbSNP RS | HGVSc | HGVSp | HGVSp Short | SWISSPROT | BIOTYPE | SIFT | PolyPhen | Tumor Sample Barcode | Tissue | Histology | Sex | Age | Stage | Therapy Types | Drugs | Outcome |
| KANK1 | SNV | Missense_Mutation | rs761714605 | c.2255N>T | p.Ser752Leu | p.S752L | Q14678 | protein_coding | deleterious(0.01) | benign(0.219) | TCGA-AC-A23H-01 | Breast | breast invasive carcinoma | Female | >=65 | I/II | Unknown | Unknown | PD |
| KANK1 | SNV | Missense_Mutation | rs775231755 | c.3806N>T | p.Thr1269Met | p.T1269M | Q14678 | protein_coding | deleterious(0) | probably_damaging(0.989) | TCGA-AC-A62V-01 | Breast | breast invasive carcinoma | Male | <65 | III/IV | Targeted Molecular therapy | denosumab | PD |
| KANK1 | SNV | Missense_Mutation | novel | c.2756N>T | p.Ser919Ile | p.S919I | Q14678 | protein_coding | tolerated(0.2) | benign(0.08) | TCGA-AN-A046-01 | Breast | breast invasive carcinoma | Female | >=65 | I/II | Unknown | Unknown | SD |
| KANK1 | SNV | Missense_Mutation | c.2482N>C | p.Glu828Gln | p.E828Q | Q14678 | protein_coding | tolerated(0.08) | probably_damaging(0.981) | TCGA-AO-A03O-01 | Breast | breast invasive carcinoma | Female | >=65 | I/II | Chemotherapy | doxorubicin | SD | |
| KANK1 | SNV | Missense_Mutation | novel | c.3775N>A | p.Asp1259Asn | p.D1259N | Q14678 | protein_coding | deleterious(0.04) | possibly_damaging(0.737) | TCGA-BH-A0B6-01 | Breast | breast invasive carcinoma | Female | <65 | I/II | Unknown | Unknown | SD |
| KANK1 | SNV | Missense_Mutation | novel | c.2071N>T | p.Leu691Phe | p.L691F | Q14678 | protein_coding | tolerated(0.41) | benign(0.003) | TCGA-BH-A0E1-01 | Breast | breast invasive carcinoma | Female | <65 | I/II | Chemotherapy | cytoxan | SD |
| KANK1 | SNV | Missense_Mutation | novel | c.847N>G | p.Thr283Ala | p.T283A | Q14678 | protein_coding | tolerated(0.09) | probably_damaging(0.917) | TCGA-BH-A0HA-01 | Breast | breast invasive carcinoma | Female | <65 | I/II | Unknown | Unknown | SD |
| KANK1 | SNV | Missense_Mutation | c.3232N>A | p.Glu1078Lys | p.E1078K | Q14678 | protein_coding | deleterious(0.04) | benign(0.147) | TCGA-BH-A0HF-01 | Breast | breast invasive carcinoma | Female | >=65 | I/II | Hormone Therapy | arimidex | SD | |
| KANK1 | SNV | Missense_Mutation | novel | c.908C>T | p.Ser303Leu | p.S303L | Q14678 | protein_coding | deleterious(0.03) | benign(0.005) | TCGA-E2-A2P6-01 | Breast | breast invasive carcinoma | Female | >=65 | I/II | Hormone Therapy | anastrozole | SD |
| KANK1 | SNV | Missense_Mutation | novel | c.1960G>A | p.Ala654Thr | p.A654T | Q14678 | protein_coding | tolerated(0.62) | benign(0) | TCGA-OL-A5RW-01 | Breast | breast invasive carcinoma | Female | <65 | I/II | Chemotherapy | adriamycin | CR |
| Page: 1 2 3 4 5 6 7 8 9 10 11 12 13 14 15 16 |
Top |
Related drugs of malignant transformation related genes |
| Identification of chemicals and drugs interact with genes involved in malignant transfromation |
| (DGIdb 4.0) |
| Entrez ID | Symbol | Category | Interaction Types | Drug Claim Name | Drug Name | PMIDs |
| Page: 1 |

Copyright 2023-Present -The University of Texas Health Science Center at Houston |