
|
|||||
|
 | |
| |
| |
| |
| |
| |
|
Gene: JUND |
Gene summary for JUND |
| Gene information | Species | Human | Gene symbol | JUND | Gene ID | 3727 |
| Gene name | JunD proto-oncogene, AP-1 transcription factor subunit | |
| Gene Alias | AP-1 | |
| Cytomap | 19p13.11 | |
| Gene Type | protein-coding | GO ID | GO:0001503 | UniProtAcc | P17535 |
Top |
Malignant transformation analysis |
| Identification of the aberrant gene expression in precancerous and cancerous lesions by comparing the gene expression of stem-like cells in diseased tissues with normal stem cells |
| Entrez ID | Symbol | Replicates | Species | Organ | Tissue | Adj P-value | Log2FC | Malignancy |
| 3727 | JUND | GSM4909281 | Human | Breast | IDC | 2.81e-18 | -6.16e-01 | 0.21 |
| 3727 | JUND | GSM4909282 | Human | Breast | IDC | 3.34e-05 | -3.72e-01 | -0.0288 |
| 3727 | JUND | GSM4909285 | Human | Breast | IDC | 2.27e-22 | -6.72e-01 | 0.21 |
| 3727 | JUND | GSM4909286 | Human | Breast | IDC | 2.66e-24 | -6.41e-01 | 0.1081 |
| 3727 | JUND | GSM4909290 | Human | Breast | IDC | 4.59e-10 | -6.03e-01 | 0.2096 |
| 3727 | JUND | GSM4909291 | Human | Breast | IDC | 6.16e-07 | 4.49e-01 | 0.1753 |
| 3727 | JUND | GSM4909293 | Human | Breast | IDC | 5.51e-51 | 8.27e-01 | 0.1581 |
| 3727 | JUND | GSM4909294 | Human | Breast | IDC | 6.19e-06 | -3.06e-01 | 0.2022 |
| 3727 | JUND | GSM4909296 | Human | Breast | IDC | 3.16e-08 | -3.86e-01 | 0.1524 |
| 3727 | JUND | GSM4909297 | Human | Breast | IDC | 5.89e-30 | -6.39e-01 | 0.1517 |
| 3727 | JUND | GSM4909301 | Human | Breast | IDC | 1.52e-30 | 5.55e-01 | 0.1577 |
| 3727 | JUND | GSM4909303 | Human | Breast | IDC | 4.47e-11 | 6.50e-01 | 0.0438 |
| 3727 | JUND | GSM4909304 | Human | Breast | IDC | 2.71e-14 | 4.39e-01 | 0.1636 |
| 3727 | JUND | GSM4909306 | Human | Breast | IDC | 1.38e-10 | -4.98e-01 | 0.1564 |
| 3727 | JUND | GSM4909307 | Human | Breast | IDC | 1.68e-08 | -4.63e-01 | 0.1569 |
| 3727 | JUND | GSM4909308 | Human | Breast | IDC | 6.04e-07 | -1.77e-01 | 0.158 |
| 3727 | JUND | GSM4909311 | Human | Breast | IDC | 3.96e-31 | -3.44e-01 | 0.1534 |
| 3727 | JUND | GSM4909313 | Human | Breast | IDC | 4.00e-07 | 3.05e-01 | 0.0391 |
| 3727 | JUND | GSM4909315 | Human | Breast | IDC | 1.71e-06 | 2.17e-01 | 0.21 |
| 3727 | JUND | GSM4909319 | Human | Breast | IDC | 2.05e-40 | -5.52e-01 | 0.1563 |
| Page: 1 2 3 4 5 6 7 8 9 10 11 12 13 14 |
| Tissue | Expression Dynamics | Abbreviation |
| Breast |  | IDC: Invasive ductal carcinoma |
| DCIS: Ductal carcinoma in situ | ||
| Precancer(BRCA1-mut): Precancerous lesion from BRCA1 mutation carriers | ||
| Cervix | 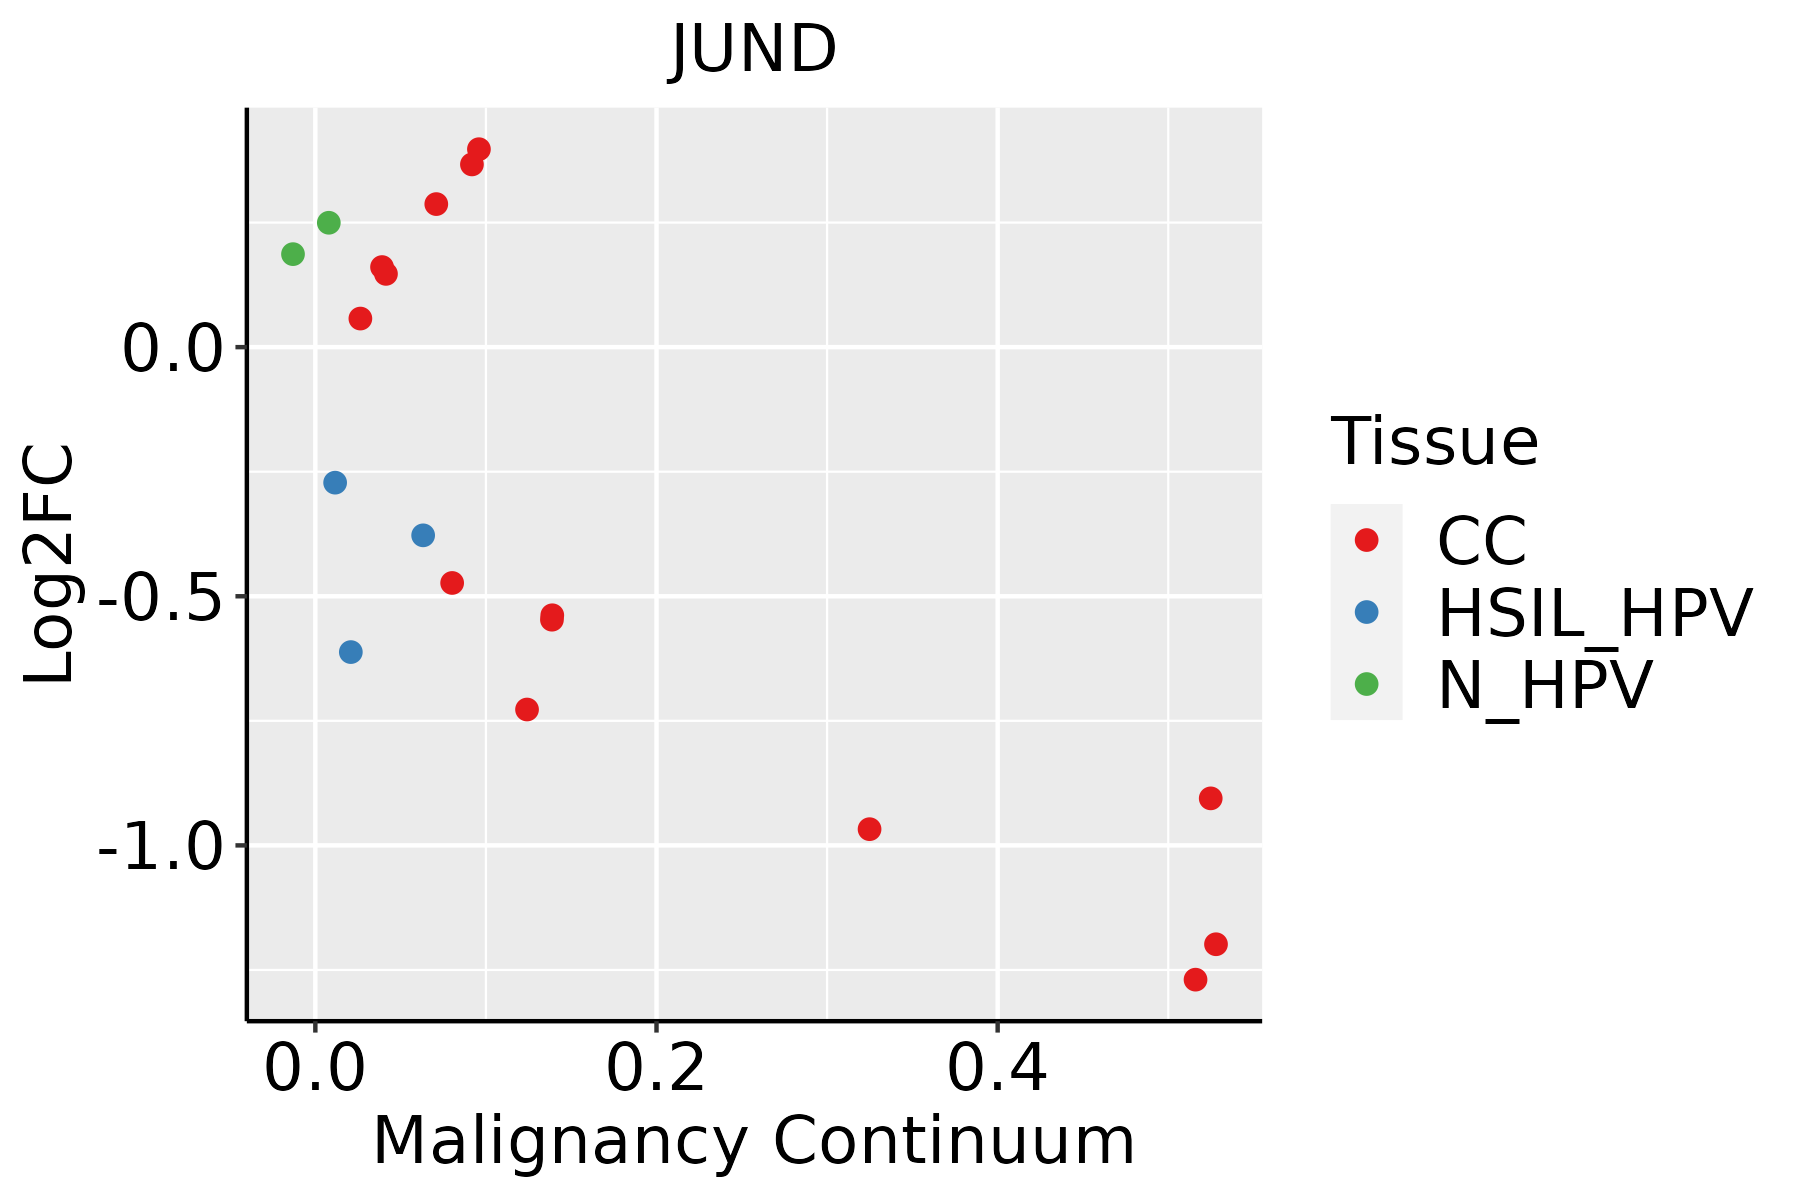 | CC: Cervix cancer |
| HSIL_HPV: HPV-infected high-grade squamous intraepithelial lesions | ||
| N_HPV: HPV-infected normal cervix | ||
| Colorectum (GSE201348) | 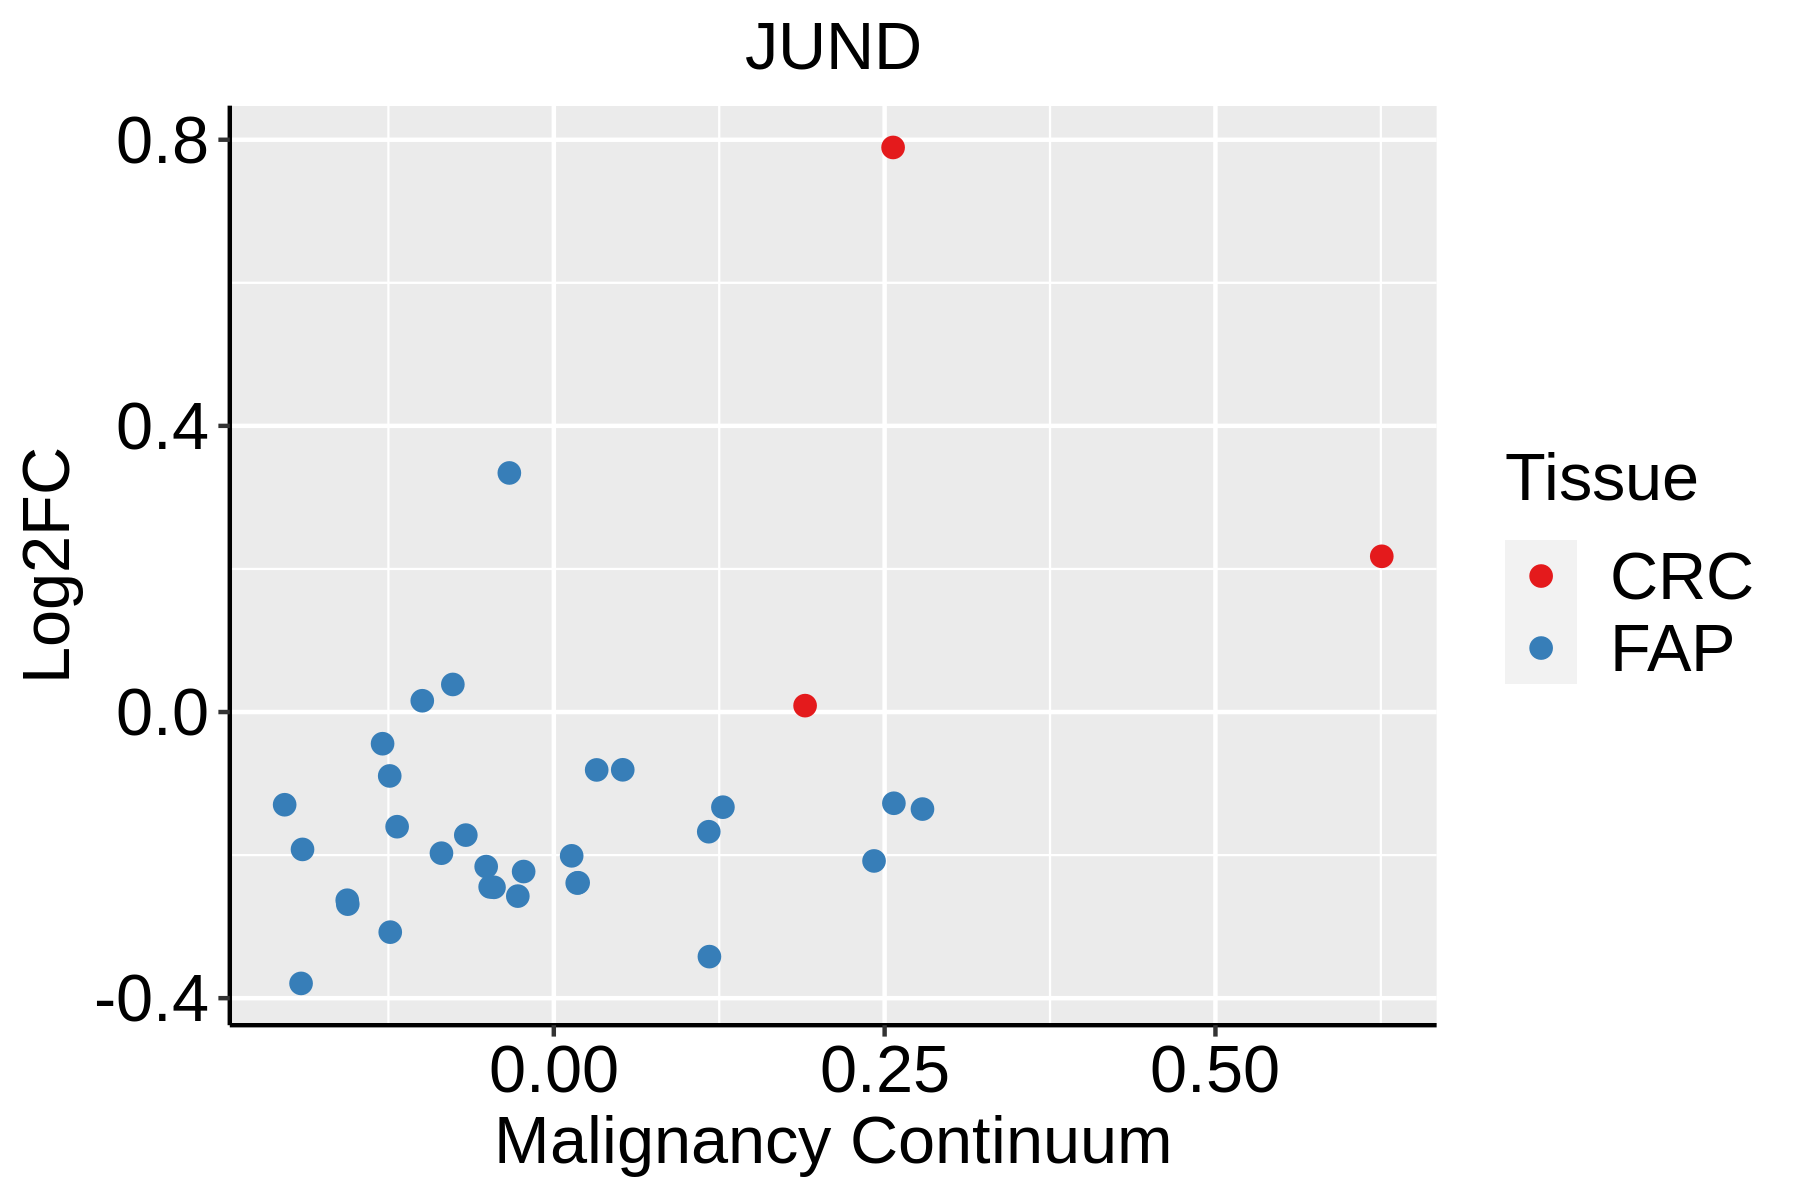 | FAP: Familial adenomatous polyposis |
| CRC: Colorectal cancer | ||
| Colorectum (HTA11) |  | AD: Adenomas |
| SER: Sessile serrated lesions | ||
| MSI-H: Microsatellite-high colorectal cancer | ||
| MSS: Microsatellite stable colorectal cancer | ||
| Endometrium | 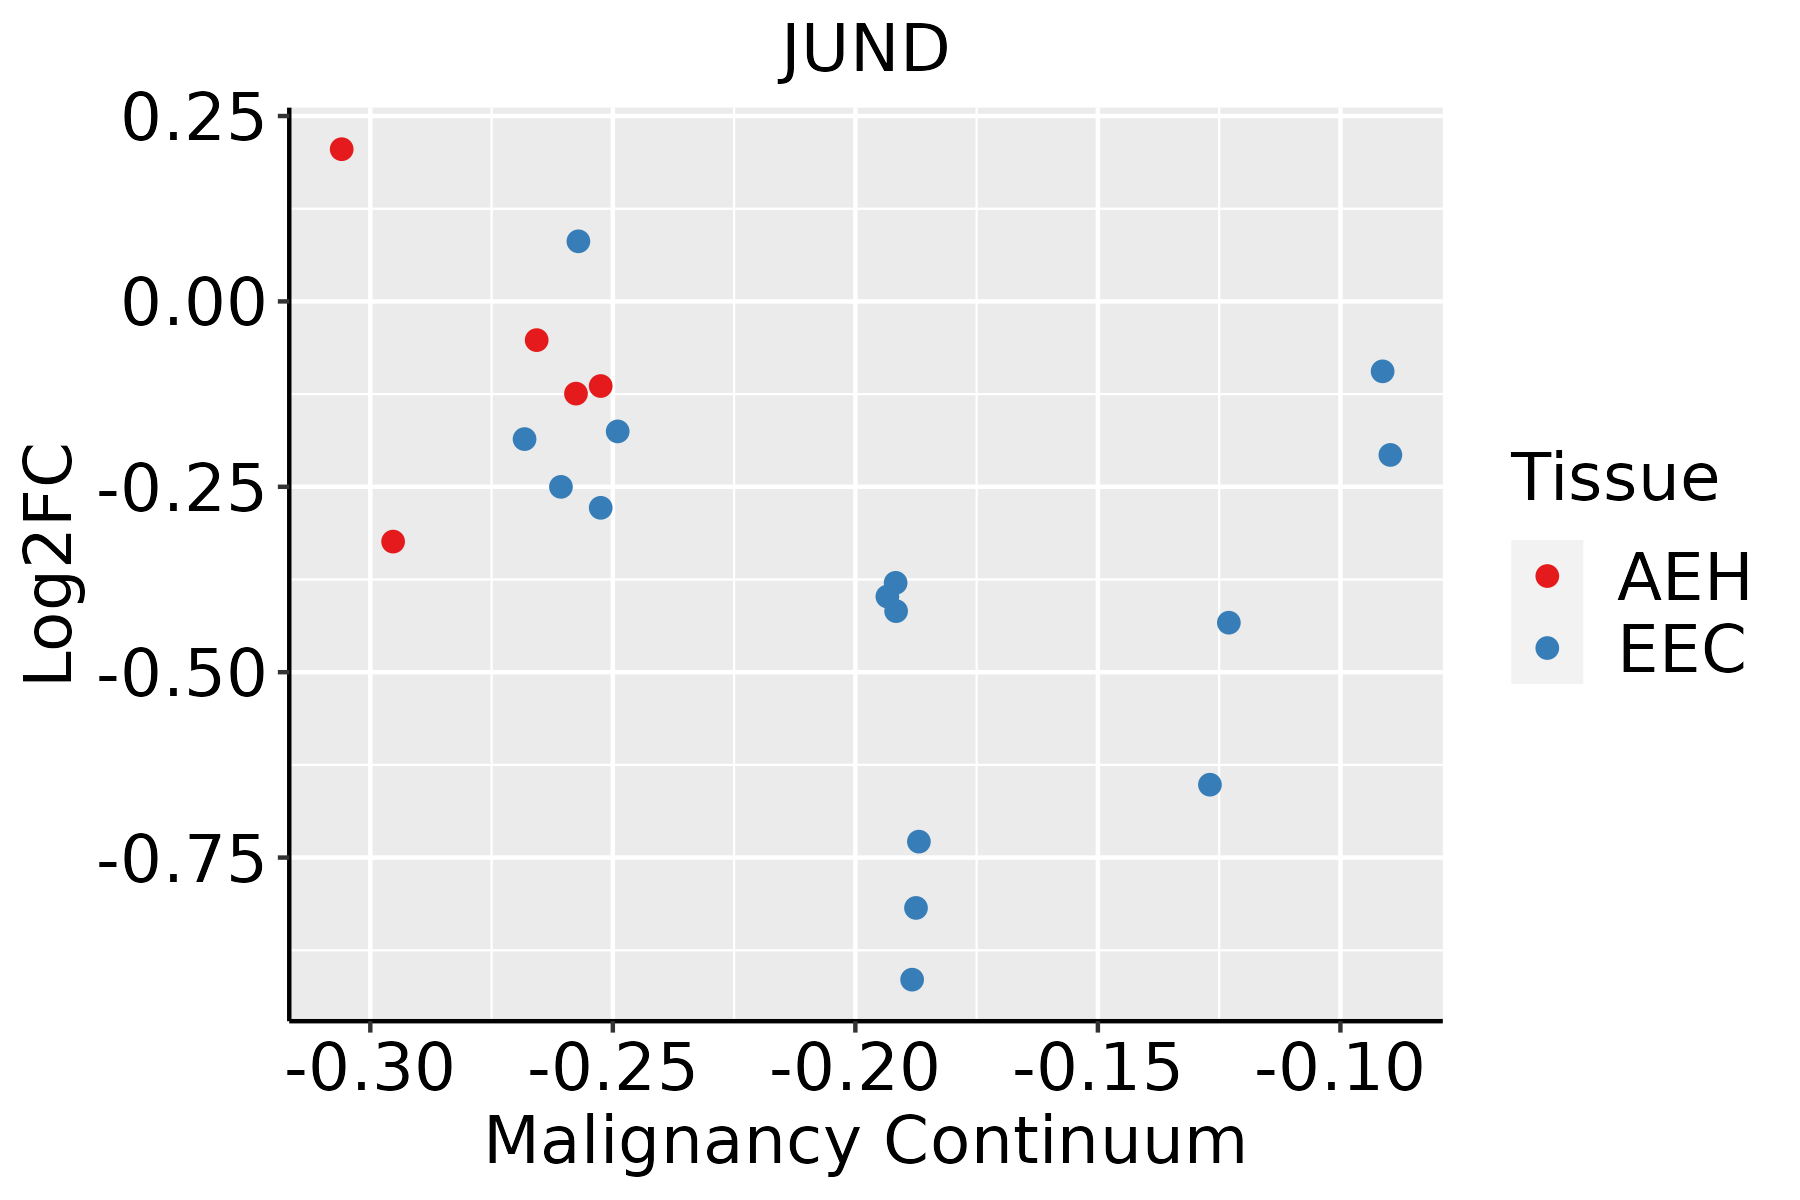 | AEH: Atypical endometrial hyperplasia |
| EEC: Endometrioid Cancer | ||
| Esophagus |  | ESCC: Esophageal squamous cell carcinoma |
| HGIN: High-grade intraepithelial neoplasias | ||
| LGIN: Low-grade intraepithelial neoplasias | ||
| GC | 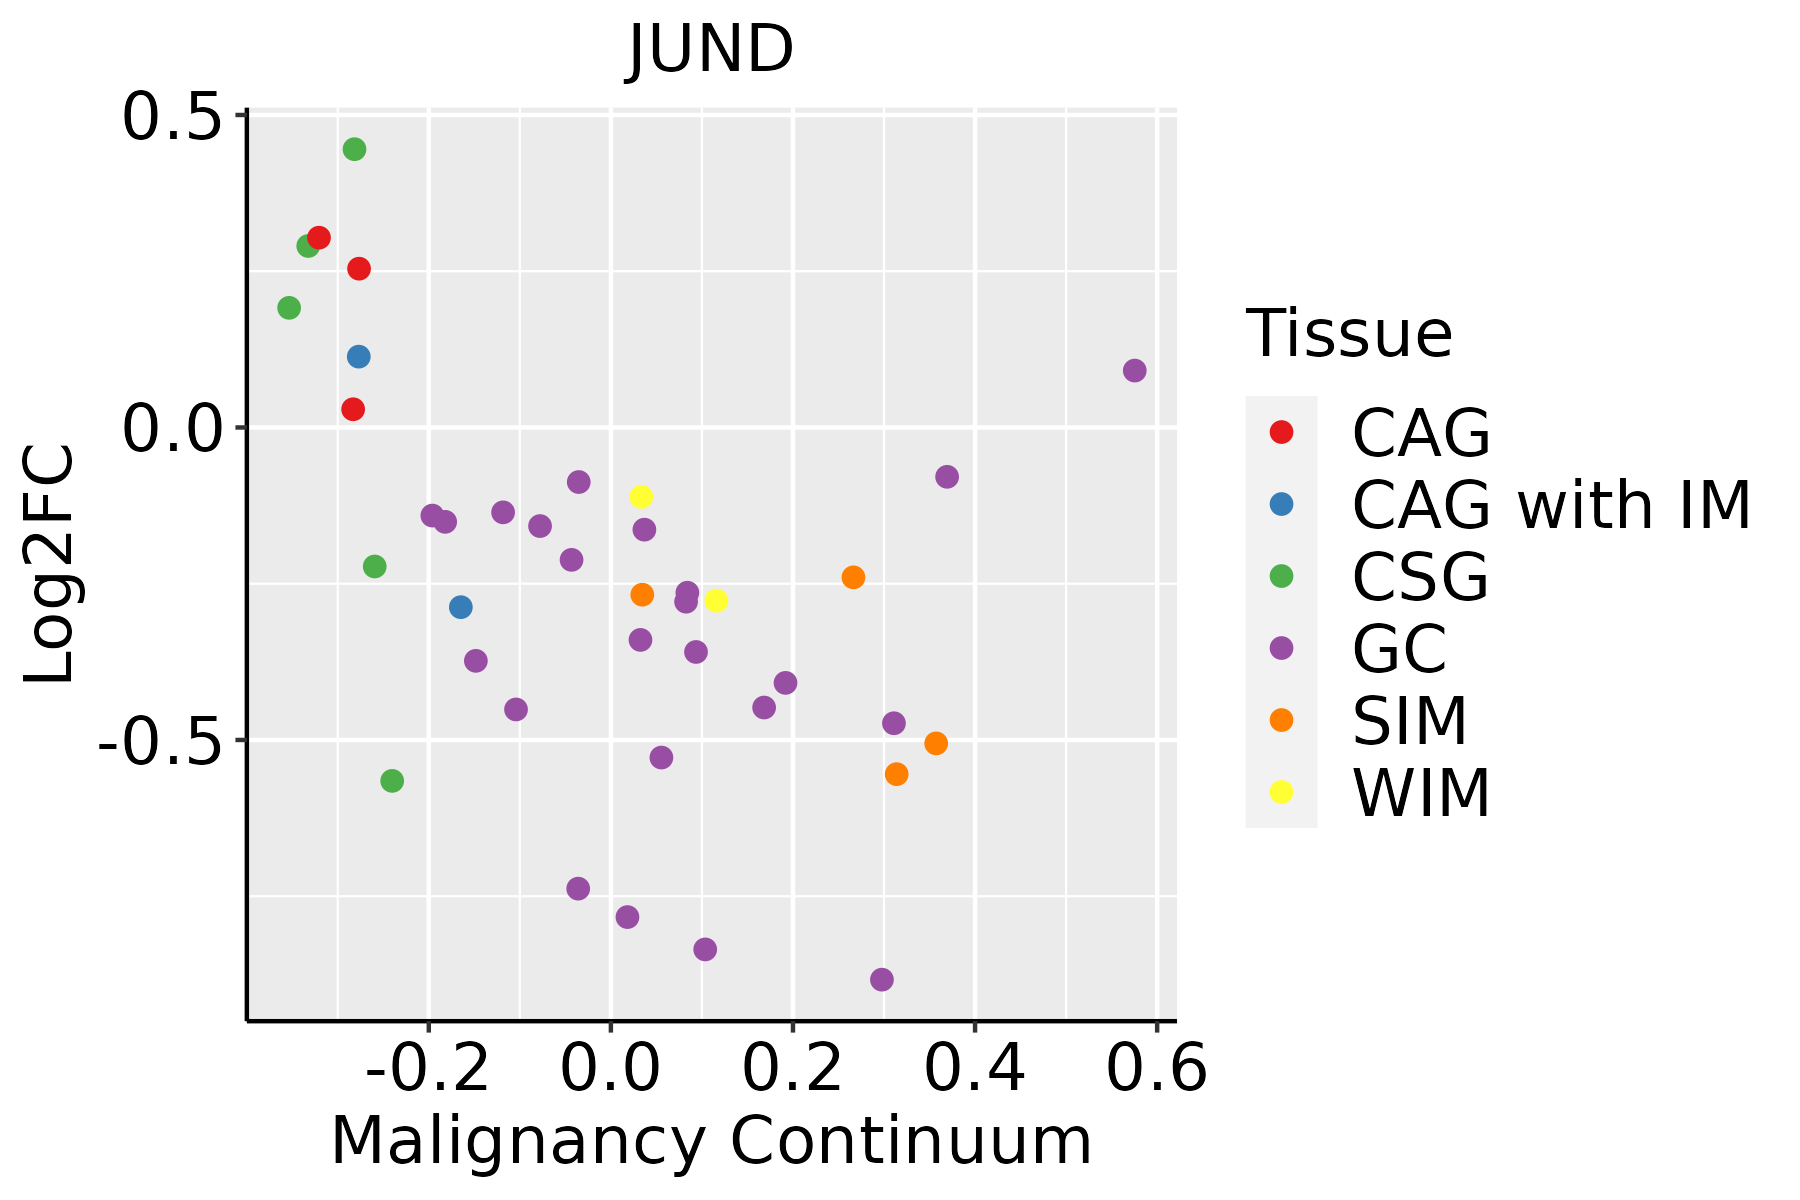 | CAG: Chronic atrophic gastritis |
| CAG with IM: Chronic atrophic gastritis with intestinal metaplasia | ||
| CSG: Chronic superficial gastritis | ||
| GC: Gastric cancer | ||
| SIM: Severe intestinal metaplasia | ||
| WIM: Wild intestinal metaplasia | ||
| Liver | 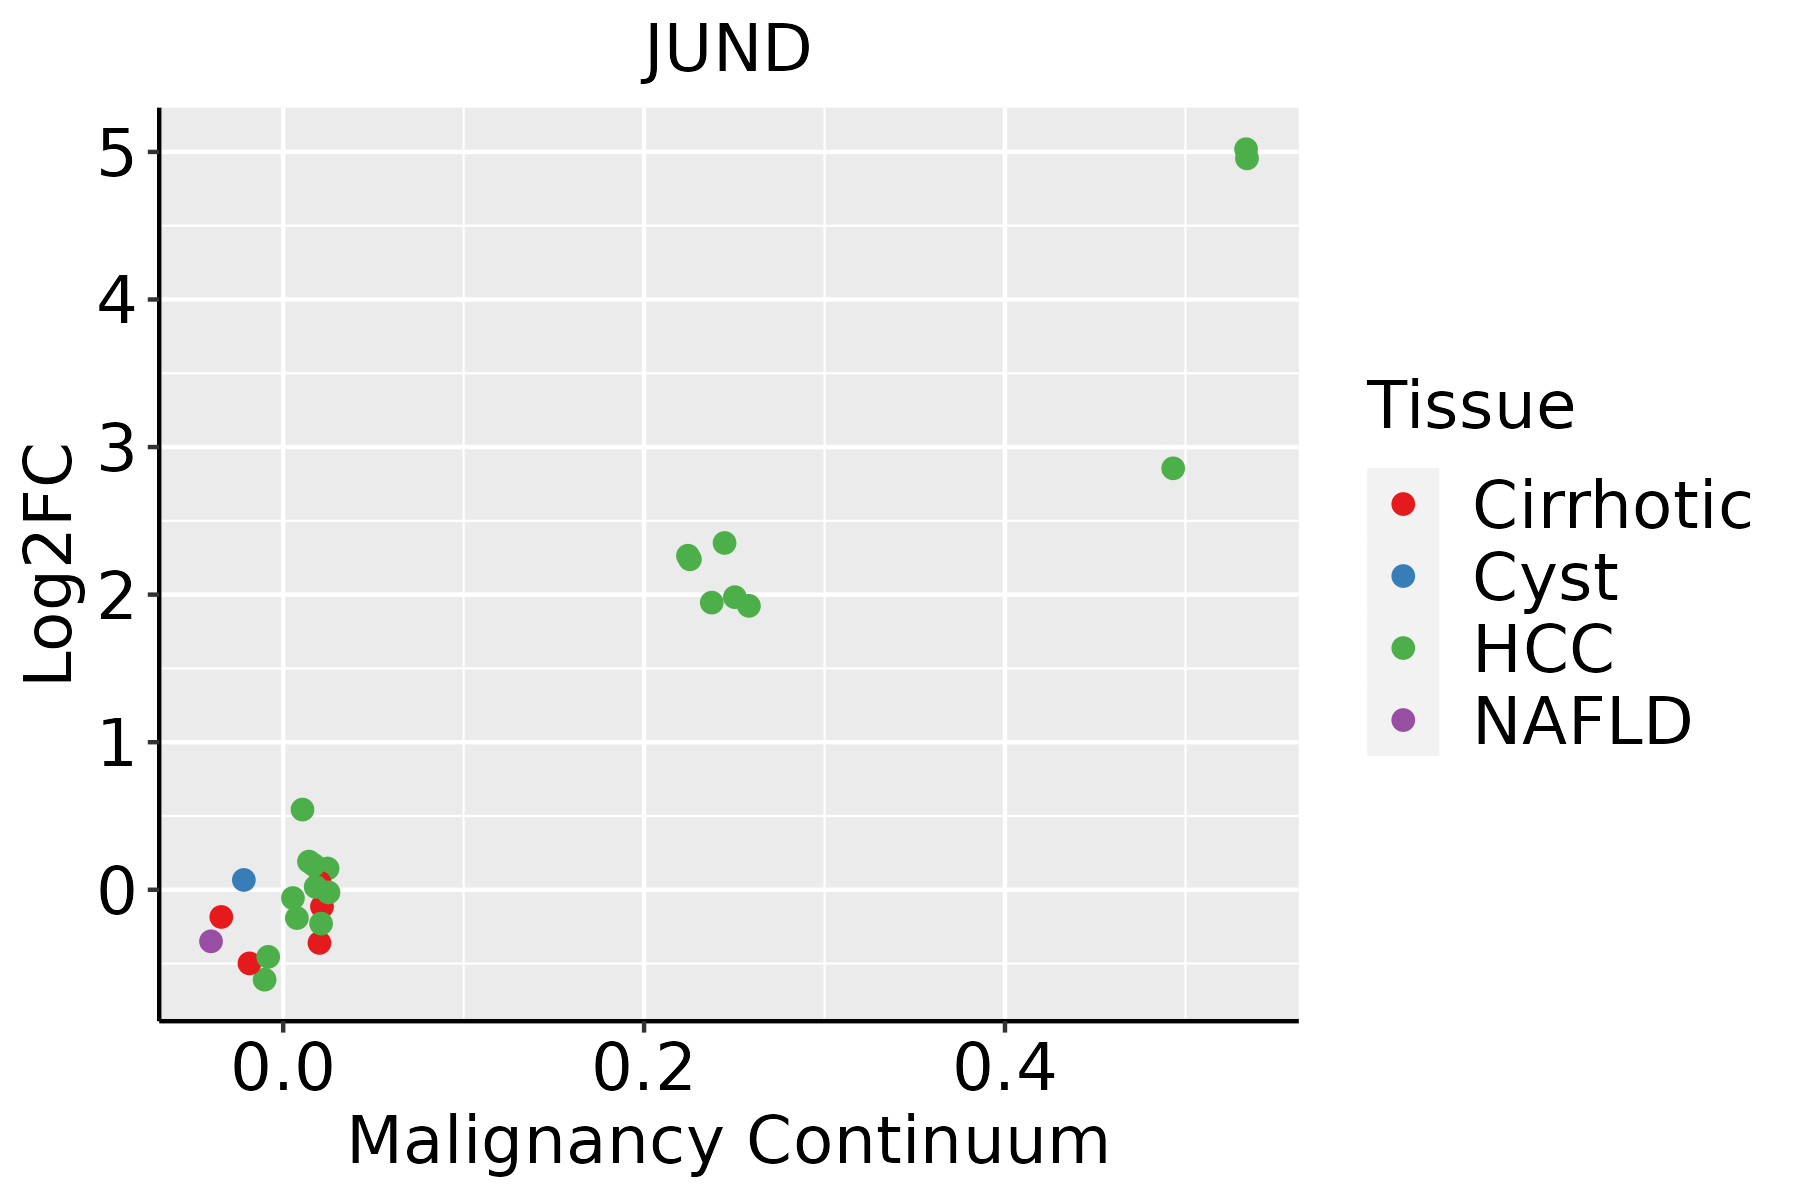 | HCC: Hepatocellular carcinoma |
| NAFLD: Non-alcoholic fatty liver disease | ||
| Oral Cavity | 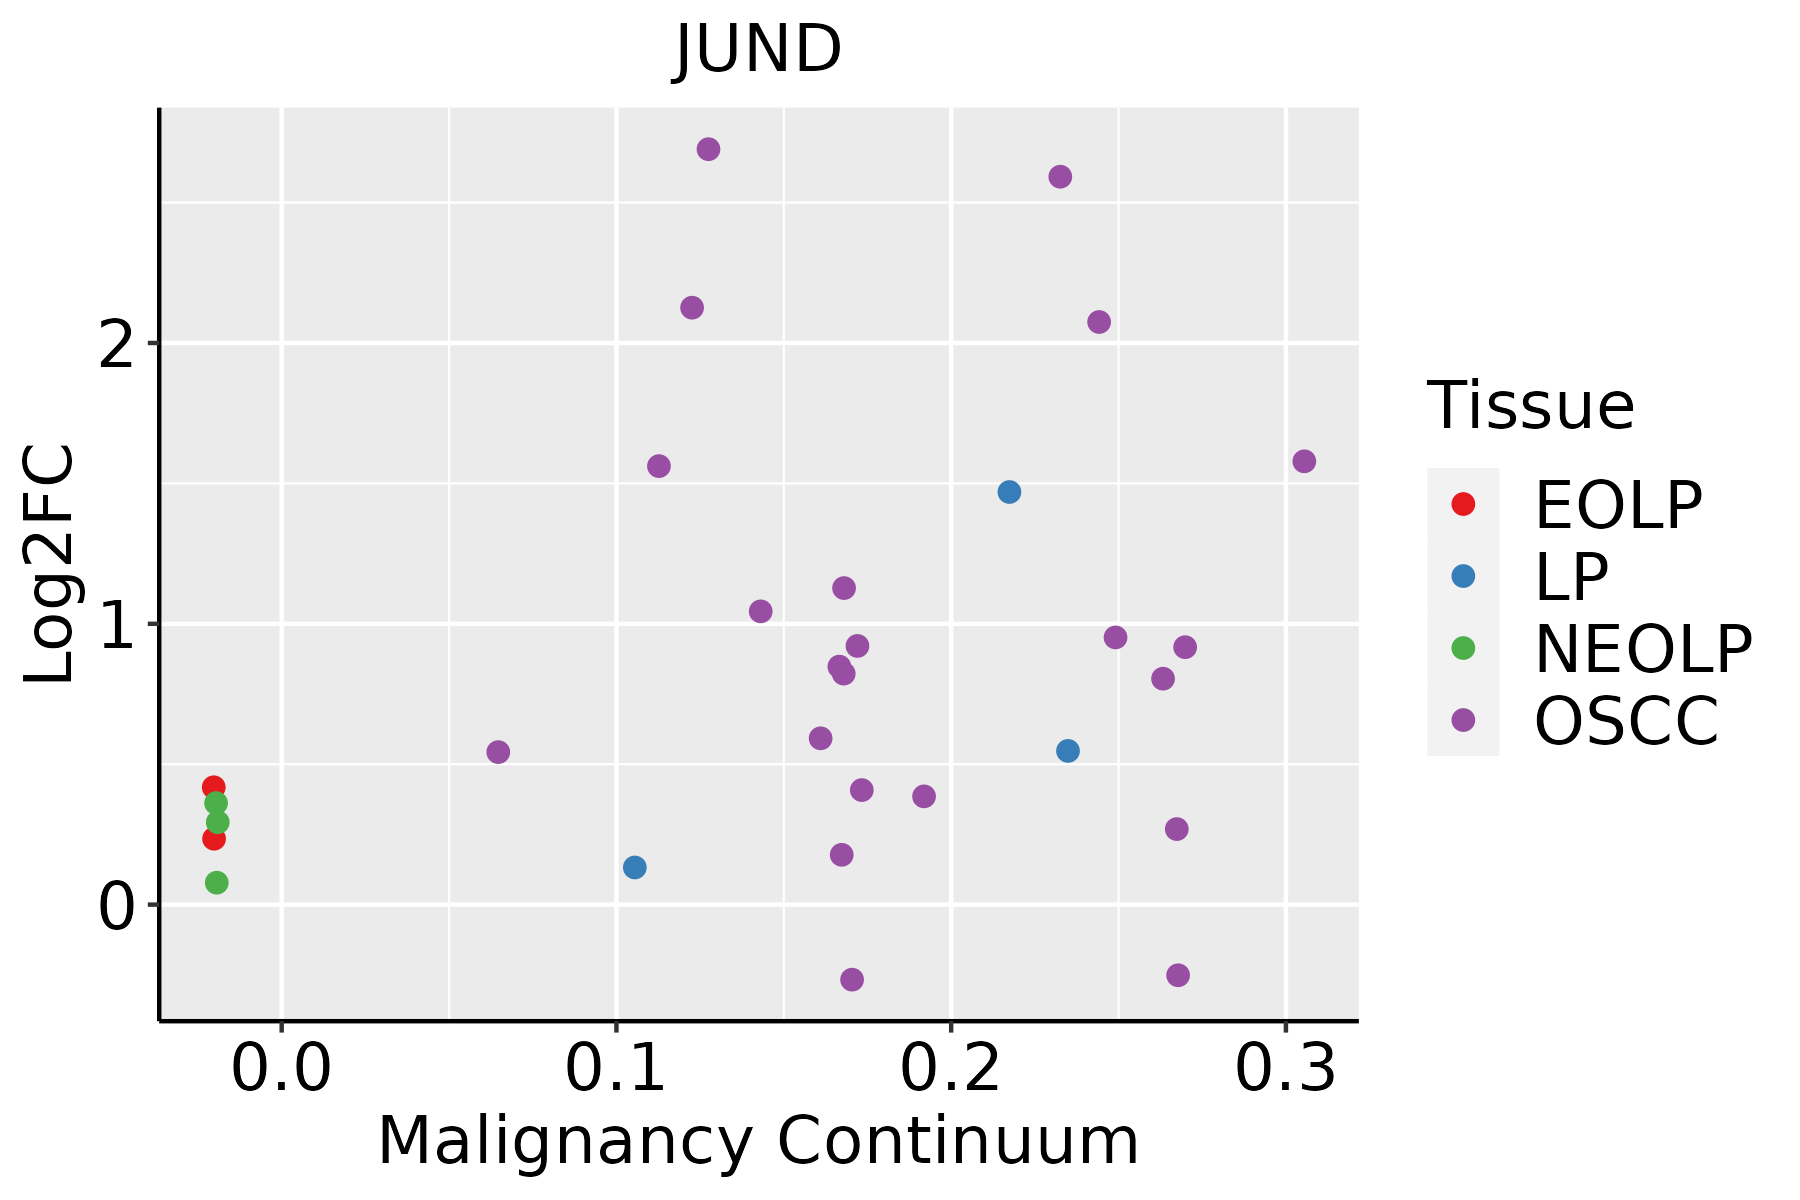 | EOLP: Erosive Oral lichen planus |
| LP: leukoplakia | ||
| NEOLP: Non-erosive oral lichen planus | ||
| OSCC: Oral squamous cell carcinoma | ||
| Prostate |  | BPH: Benign Prostatic Hyperplasia |
| Skin | 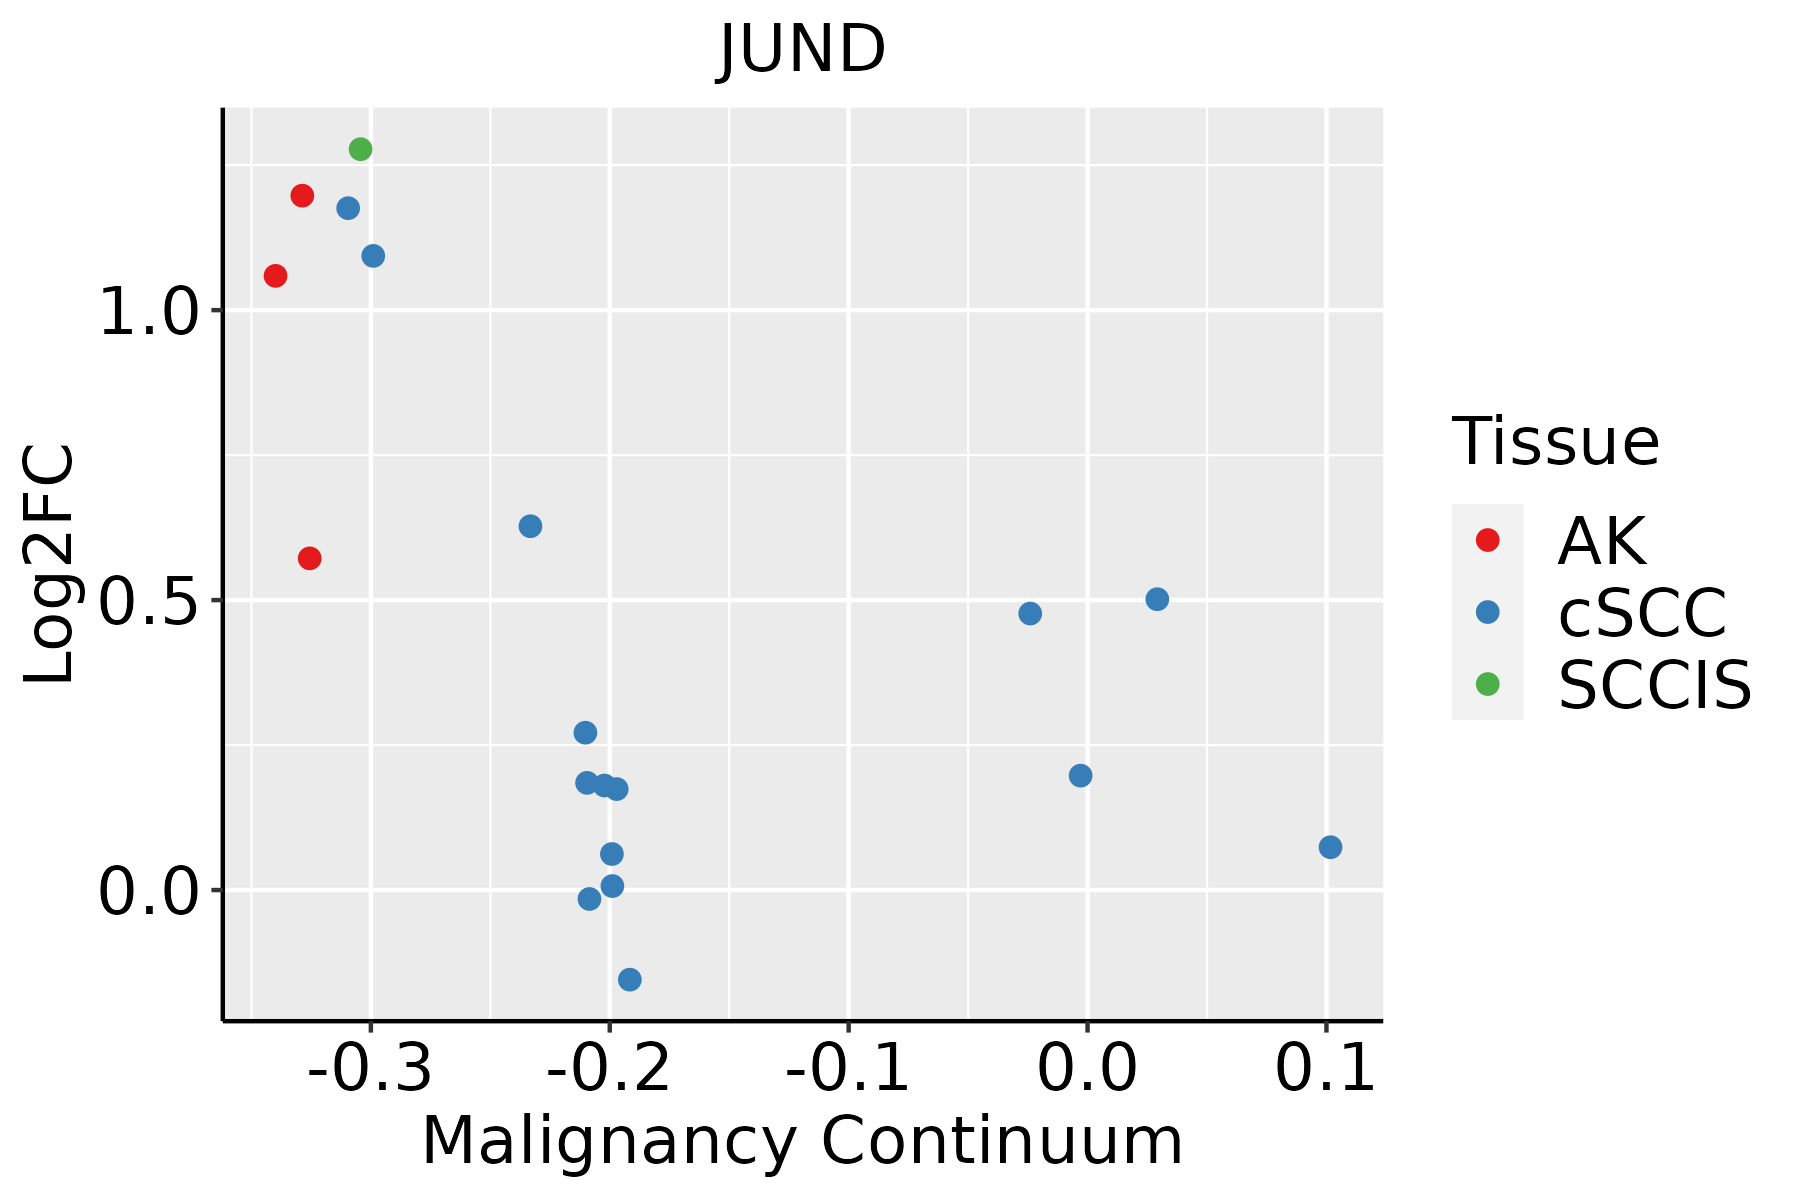 | AK: Actinic keratosis |
| cSCC: Cutaneous squamous cell carcinoma | ||
| SCCIS:squamous cell carcinoma in situ | ||
| Thyroid | 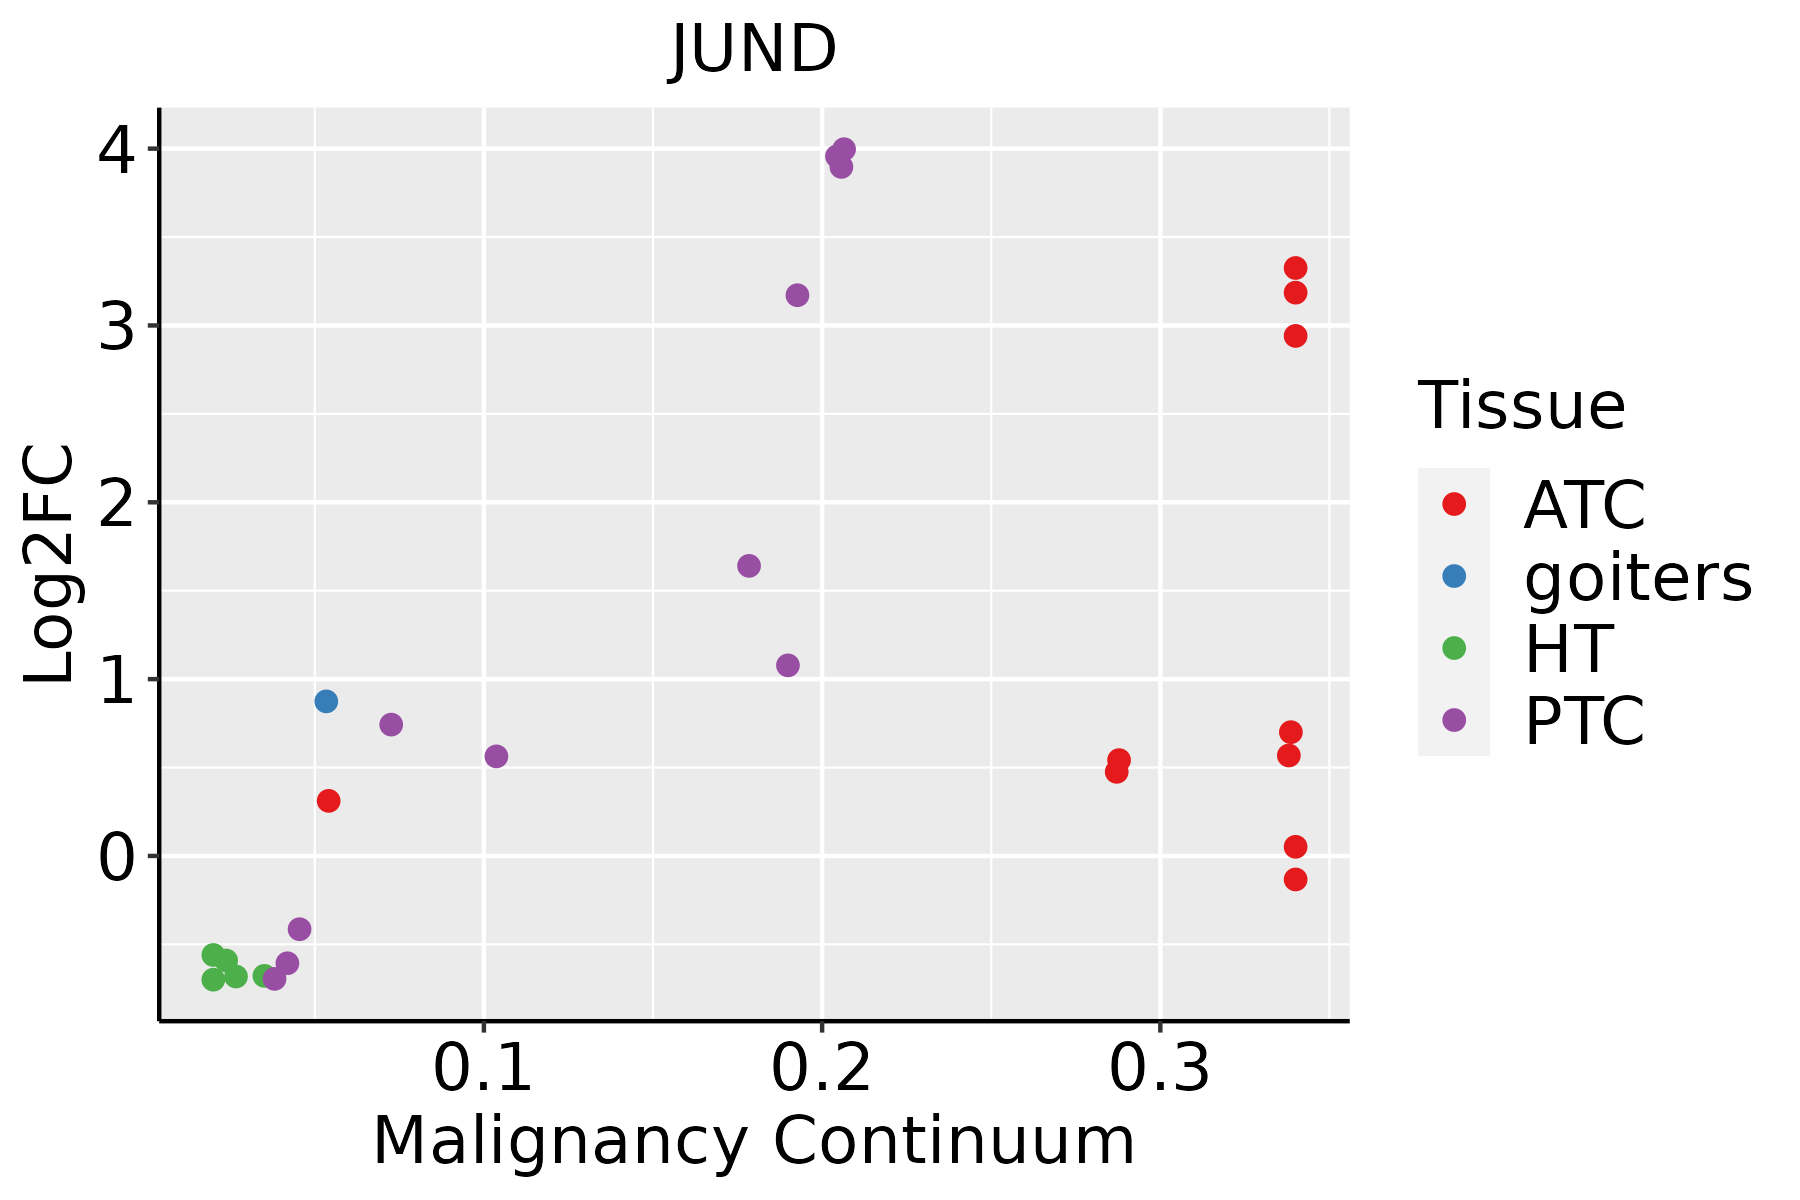 | ATC: Anaplastic thyroid cancer |
| HT: Hashimoto's thyroiditis | ||
| PTC: Papillary thyroid cancer |
| ∗log2FC in expression of this searched gene in stem-like cells from each diseased tissue sample relative to stem-like cells in normal samples in each tissue plotted against the malignancy continuum. Samples are colored based on if they are from different disease stage. |
Top |
Malignant transformation related pathway analysis |
| Find out the enriched GO biological processes and KEGG pathways involved in transition from healthy to precancer to cancer |
| Tissue | Disease Stage | Enriched GO biological Processes |
| Colorectum | AD |  |
| Colorectum | SER |  |
| Colorectum | MSS |  |
| Colorectum | MSI-H |  |
| Colorectum | FAP |  |
| ∗Top 15 enriched GO BP terms are showed in the bar plot of each disease state in each tissue. Each row represents a significant GO biological process which is colored according to the -log10(p.adjust). |
| Page: 1 2 3 4 5 6 7 8 9 |
| GO ID | Tissue | Disease Stage | Description | Gene Ratio | Bg Ratio | pvalue | p.adjust | Count |
| GO:00100389 | Breast | Precancer | response to metal ion | 47/1080 | 373/18723 | 3.88e-07 | 1.79e-05 | 47 |
| GO:00075688 | Breast | Precancer | aging | 41/1080 | 339/18723 | 5.95e-06 | 1.71e-04 | 41 |
| GO:00022378 | Breast | Precancer | response to molecule of bacterial origin | 43/1080 | 363/18723 | 6.05e-06 | 1.72e-04 | 43 |
| GO:00324968 | Breast | Precancer | response to lipopolysaccharide | 41/1080 | 343/18723 | 7.94e-06 | 2.17e-04 | 41 |
| GO:00093148 | Breast | Precancer | response to radiation | 47/1080 | 456/18723 | 8.39e-05 | 1.62e-03 | 47 |
| GO:00016496 | Breast | Precancer | osteoblast differentiation | 27/1080 | 229/18723 | 3.35e-04 | 4.73e-03 | 27 |
| GO:00712488 | Breast | Precancer | cellular response to metal ion | 24/1080 | 197/18723 | 4.35e-04 | 5.79e-03 | 24 |
| GO:00712418 | Breast | Precancer | cellular response to inorganic substance | 26/1080 | 226/18723 | 6.23e-04 | 7.78e-03 | 26 |
| GO:00515925 | Breast | Precancer | response to calcium ion | 18/1080 | 149/18723 | 2.37e-03 | 2.19e-02 | 18 |
| GO:00096126 | Breast | Precancer | response to mechanical stimulus | 23/1080 | 216/18723 | 3.41e-03 | 2.85e-02 | 23 |
| GO:00015036 | Breast | Precancer | ossification | 36/1080 | 408/18723 | 7.53e-03 | 4.98e-02 | 36 |
| GO:001003814 | Breast | IDC | response to metal ion | 65/1434 | 373/18723 | 2.95e-10 | 3.42e-08 | 65 |
| GO:000756813 | Breast | IDC | aging | 52/1434 | 339/18723 | 1.14e-06 | 5.10e-05 | 52 |
| GO:000931412 | Breast | IDC | response to radiation | 62/1434 | 456/18723 | 6.91e-06 | 2.10e-04 | 62 |
| GO:000961211 | Breast | IDC | response to mechanical stimulus | 34/1434 | 216/18723 | 4.59e-05 | 1.03e-03 | 34 |
| GO:000164912 | Breast | IDC | osteoblast differentiation | 35/1434 | 229/18723 | 6.64e-05 | 1.35e-03 | 35 |
| GO:003249612 | Breast | IDC | response to lipopolysaccharide | 47/1434 | 343/18723 | 7.13e-05 | 1.43e-03 | 47 |
| GO:000223712 | Breast | IDC | response to molecule of bacterial origin | 49/1434 | 363/18723 | 7.40e-05 | 1.47e-03 | 49 |
| GO:00434348 | Breast | IDC | response to peptide hormone | 54/1434 | 414/18723 | 8.25e-05 | 1.61e-03 | 54 |
| GO:000150311 | Breast | IDC | ossification | 50/1434 | 408/18723 | 6.51e-04 | 8.04e-03 | 50 |
| Page: 1 2 3 4 5 6 7 8 9 10 11 12 13 14 15 16 17 18 19 20 21 22 23 |
| Pathway ID | Tissue | Disease Stage | Description | Gene Ratio | Bg Ratio | pvalue | p.adjust | qvalue | Count |
| hsa0465716 | Breast | Precancer | IL-17 signaling pathway | 20/684 | 94/8465 | 4.74e-05 | 4.54e-04 | 3.48e-04 | 20 |
| hsa0465717 | Breast | Precancer | IL-17 signaling pathway | 20/684 | 94/8465 | 4.74e-05 | 4.54e-04 | 3.48e-04 | 20 |
| hsa0465721 | Breast | IDC | IL-17 signaling pathway | 18/867 | 94/8465 | 6.39e-03 | 3.30e-02 | 2.47e-02 | 18 |
| hsa0465731 | Breast | IDC | IL-17 signaling pathway | 18/867 | 94/8465 | 6.39e-03 | 3.30e-02 | 2.47e-02 | 18 |
| hsa0465741 | Breast | DCIS | IL-17 signaling pathway | 18/846 | 94/8465 | 4.95e-03 | 2.67e-02 | 1.96e-02 | 18 |
| hsa0465751 | Breast | DCIS | IL-17 signaling pathway | 18/846 | 94/8465 | 4.95e-03 | 2.67e-02 | 1.96e-02 | 18 |
| hsa0465718 | Cervix | CC | IL-17 signaling pathway | 31/1267 | 94/8465 | 8.71e-06 | 7.43e-05 | 4.39e-05 | 31 |
| hsa0492812 | Cervix | CC | Parathyroid hormone synthesis, secretion and action | 27/1267 | 106/8465 | 3.12e-03 | 1.19e-02 | 7.03e-03 | 27 |
| hsa040109 | Cervix | CC | MAPK signaling pathway | 62/1267 | 302/8465 | 4.89e-03 | 1.67e-02 | 9.86e-03 | 62 |
| hsa0465719 | Cervix | CC | IL-17 signaling pathway | 31/1267 | 94/8465 | 8.71e-06 | 7.43e-05 | 4.39e-05 | 31 |
| hsa0492813 | Cervix | CC | Parathyroid hormone synthesis, secretion and action | 27/1267 | 106/8465 | 3.12e-03 | 1.19e-02 | 7.03e-03 | 27 |
| hsa0401012 | Cervix | CC | MAPK signaling pathway | 62/1267 | 302/8465 | 4.89e-03 | 1.67e-02 | 9.86e-03 | 62 |
| hsa0465742 | Cervix | N_HPV | IL-17 signaling pathway | 16/349 | 94/8465 | 1.20e-06 | 1.64e-05 | 1.28e-05 | 16 |
| hsa0465752 | Cervix | N_HPV | IL-17 signaling pathway | 16/349 | 94/8465 | 1.20e-06 | 1.64e-05 | 1.28e-05 | 16 |
| hsa04928 | Colorectum | AD | Parathyroid hormone synthesis, secretion and action | 38/2092 | 106/8465 | 6.60e-03 | 2.77e-02 | 1.76e-02 | 38 |
| hsa049281 | Colorectum | AD | Parathyroid hormone synthesis, secretion and action | 38/2092 | 106/8465 | 6.60e-03 | 2.77e-02 | 1.76e-02 | 38 |
| hsa049282 | Colorectum | SER | Parathyroid hormone synthesis, secretion and action | 31/1580 | 106/8465 | 5.20e-03 | 3.28e-02 | 2.38e-02 | 31 |
| hsa049283 | Colorectum | SER | Parathyroid hormone synthesis, secretion and action | 31/1580 | 106/8465 | 5.20e-03 | 3.28e-02 | 2.38e-02 | 31 |
| hsa049284 | Colorectum | MSS | Parathyroid hormone synthesis, secretion and action | 37/1875 | 106/8465 | 1.72e-03 | 9.13e-03 | 5.59e-03 | 37 |
| hsa049285 | Colorectum | MSS | Parathyroid hormone synthesis, secretion and action | 37/1875 | 106/8465 | 1.72e-03 | 9.13e-03 | 5.59e-03 | 37 |
| Page: 1 2 3 4 |
Top |
Cell-cell communication analysis |
| Identification of potential cell-cell interactions between two cell types and their ligand-receptor pairs for different disease states |
| Ligand | Receptor | LRpair | Pathway | Tissue | Disease Stage |
| Page: 1 |
Top |
Single-cell gene regulatory network inference analysis |
| Find out the significant the regulons (TFs) and the target genes of each regulon across cell types for different disease states |
| TF | Cell Type | Tissue | Disease Stage | Target Gene | RSS | Regulon Activity |
| ∗The dot plots of a searched regulon are shown for all cell subpopulations in each disease state of each tissue based on the regulon specific score inferred using pySCENIC and by calculating the average expression. |
| Page: 1 |
Top |
Somatic mutation of malignant transformation related genes |
| Annotation of somatic variants for genes involved in malignant transformation |
| Hugo Symbol | Variant Class | Variant Classification | dbSNP RS | HGVSc | HGVSp | HGVSp Short | SWISSPROT | BIOTYPE | SIFT | PolyPhen | Tumor Sample Barcode | Tissue | Histology | Sex | Age | Stage | Therapy Types | Drugs | Outcome |
| JUND | SNV | Missense_Mutation | novel | c.412N>A | p.Glu138Lys | p.E138K | P17535 | protein_coding | deleterious(0) | possibly_damaging(0.812) | TCGA-C5-A1BQ-01 | Cervix | cervical & endocervical cancer | Female | >=65 | III/IV | Chemotherapy | cisplatin | CR |
| JUND | SNV | Missense_Mutation | c.790N>T | p.Asp264Tyr | p.D264Y | P17535 | protein_coding | deleterious(0) | possibly_damaging(0.907) | TCGA-EK-A2PG-01 | Cervix | cervical & endocervical cancer | Female | >=65 | I/II | Unknown | Unknown | SD | |
| JUND | SNV | Missense_Mutation | c.856N>T | p.Arg286Cys | p.R286C | P17535 | protein_coding | deleterious(0) | probably_damaging(0.922) | TCGA-FU-A40J-01 | Cervix | cervical & endocervical cancer | Female | <65 | III/IV | Chemotherapy | carboplatin | CR | |
| JUND | SNV | Missense_Mutation | c.344N>T | p.Thr115Ile | p.T115I | P17535 | protein_coding | tolerated(0.16) | probably_damaging(0.999) | TCGA-CK-4951-01 | Colorectum | colon adenocarcinoma | Female | >=65 | I/II | Unknown | Unknown | PD | |
| JUND | SNV | Missense_Mutation | novel | c.979A>G | p.Lys327Glu | p.K327E | P17535 | protein_coding | deleterious(0) | possibly_damaging(0.895) | TCGA-A5-A2K5-01 | Endometrium | uterine corpus endometrioid carcinoma | Female | >=65 | I/II | Unknown | Unknown | SD |
| JUND | SNV | Missense_Mutation | rs751981092 | c.436G>A | p.Asp146Asn | p.D146N | P17535 | protein_coding | deleterious(0.04) | probably_damaging(0.954) | TCGA-UB-A7MA-01 | Liver | liver hepatocellular carcinoma | Female | <65 | I/II | Chemotherapy | gemcitabine | PD |
| JUND | SNV | Missense_Mutation | c.654N>T | p.Glu218Asp | p.E218D | P17535 | protein_coding | tolerated(0.79) | benign(0.003) | TCGA-55-8507-01 | Lung | lung adenocarcinoma | Male | <65 | I/II | Unknown | Unknown | SD | |
| JUND | SNV | Missense_Mutation | c.362C>T | p.Ser121Leu | p.S121L | P17535 | protein_coding | tolerated(0.08) | benign(0.013) | TCGA-39-5031-01 | Lung | lung squamous cell carcinoma | Female | >=65 | I/II | Unknown | Unknown | SD | |
| JUND | SNV | Missense_Mutation | novel | c.410C>T | p.Ala137Val | p.A137V | P17535 | protein_coding | deleterious(0.02) | possibly_damaging(0.645) | TCGA-77-A5GH-01 | Lung | lung squamous cell carcinoma | Male | >=65 | I/II | Unknown | Unknown | SD |
| JUND | deletion | Frame_Shift_Del | novel | c.256_289delNNNNNNNNNNNNNNNNNNNNNNNNNNNNNNNNNN | p.Gly86SerfsTer101 | p.G86Sfs*101 | P17535 | protein_coding | TCGA-62-8394-01 | Lung | lung adenocarcinoma | Female | >=65 | III/IV | Chemotherapy | carboplatin | SD |
| Page: 1 2 |
Top |
Related drugs of malignant transformation related genes |
| Identification of chemicals and drugs interact with genes involved in malignant transfromation |
| (DGIdb 4.0) |
| Entrez ID | Symbol | Category | Interaction Types | Drug Claim Name | Drug Name | PMIDs |
| 3727 | JUND | TRANSCRIPTION FACTOR BINDING, TRANSCRIPTION FACTOR COMPLEX, TUMOR SUPPRESSOR, TRANSCRIPTION FACTOR | CLOZAPINE | CLOZAPINE | 12093589 |
| Page: 1 |

Copyright 2023-Present -The University of Texas Health Science Center at Houston |