| Tissue | Expression Dynamics | Abbreviation |
| Breast |  | IDC: Invasive ductal carcinoma |
| DCIS: Ductal carcinoma in situ |
| Precancer(BRCA1-mut): Precancerous lesion from BRCA1 mutation carriers |
| Cervix | 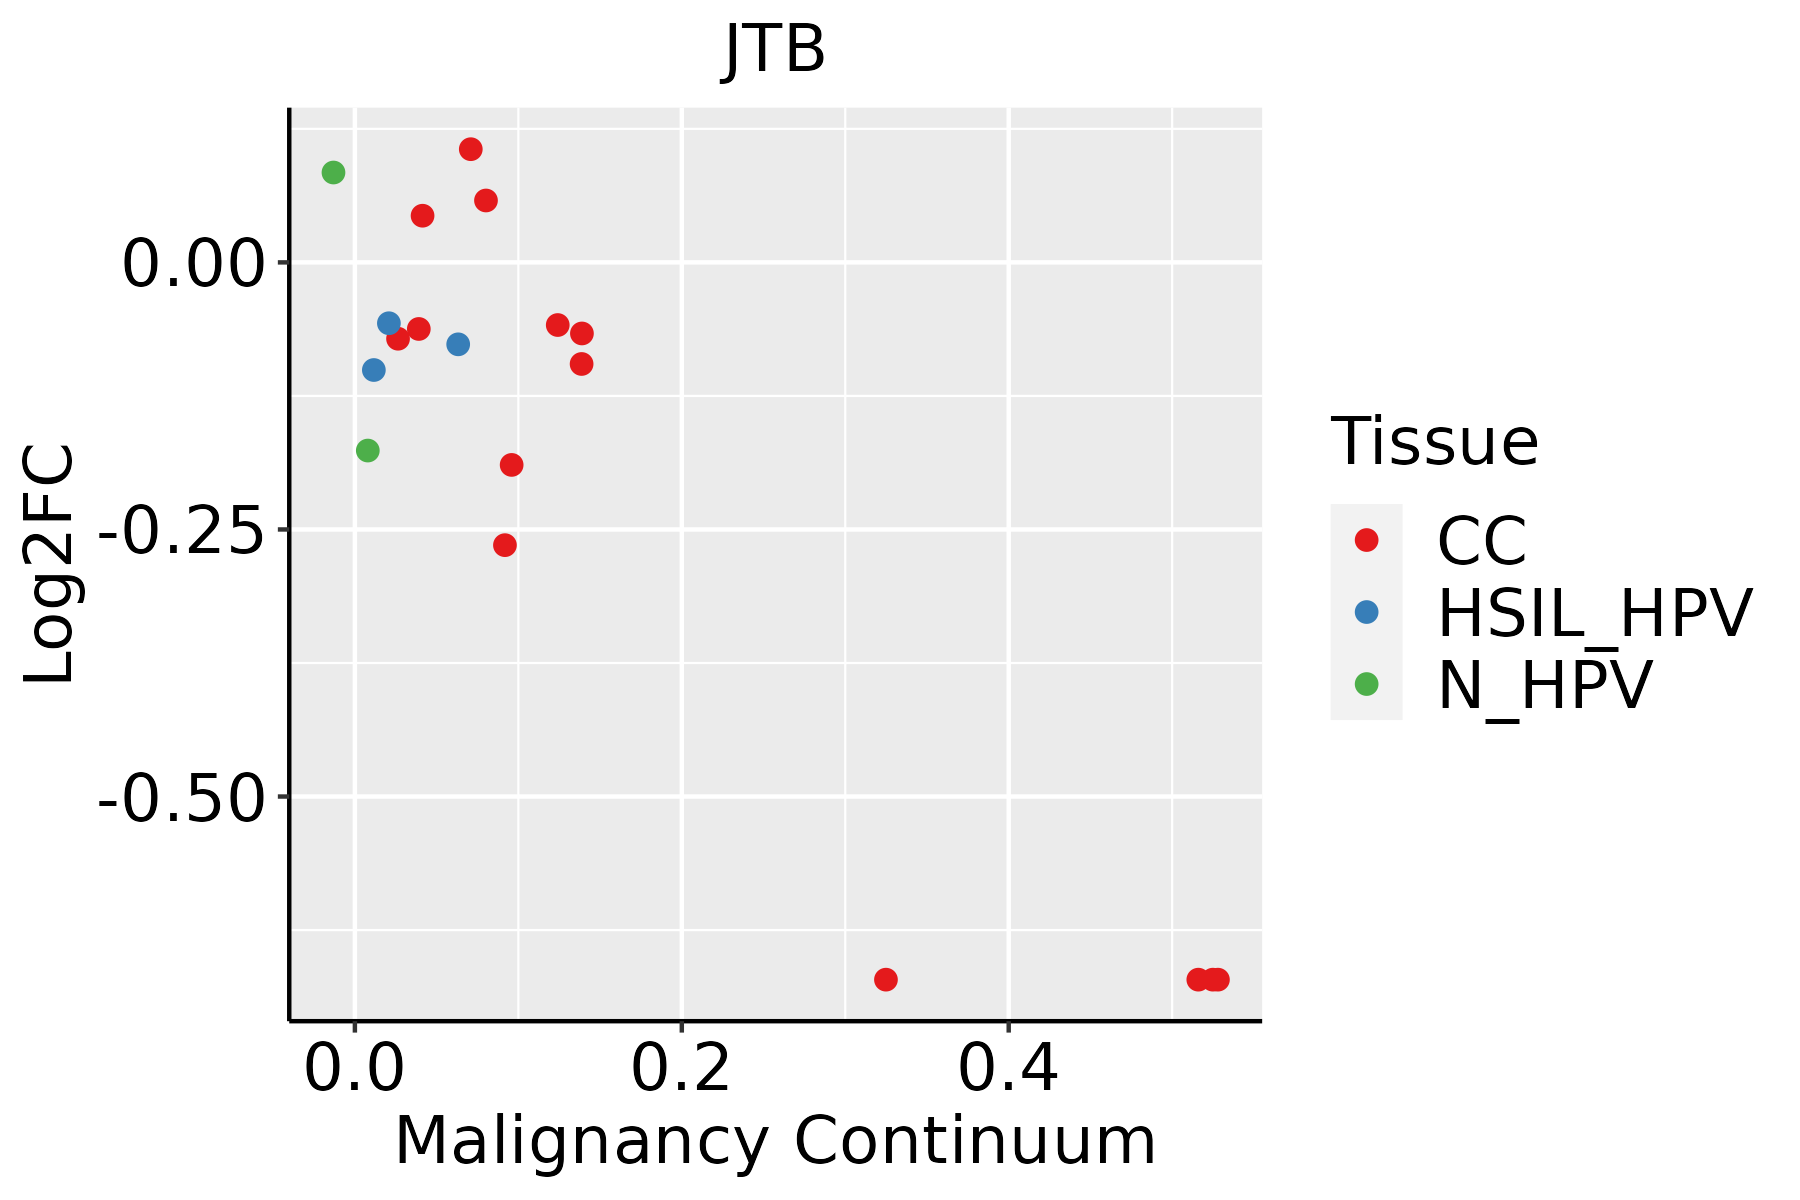 | CC: Cervix cancer |
| HSIL_HPV: HPV-infected high-grade squamous intraepithelial lesions |
| N_HPV: HPV-infected normal cervix |
| Colorectum (GSE201348) |  | FAP: Familial adenomatous polyposis |
| CRC: Colorectal cancer |
| Colorectum (HTA11) |  | AD: Adenomas |
| SER: Sessile serrated lesions |
| MSI-H: Microsatellite-high colorectal cancer |
| MSS: Microsatellite stable colorectal cancer |
| Endometrium | 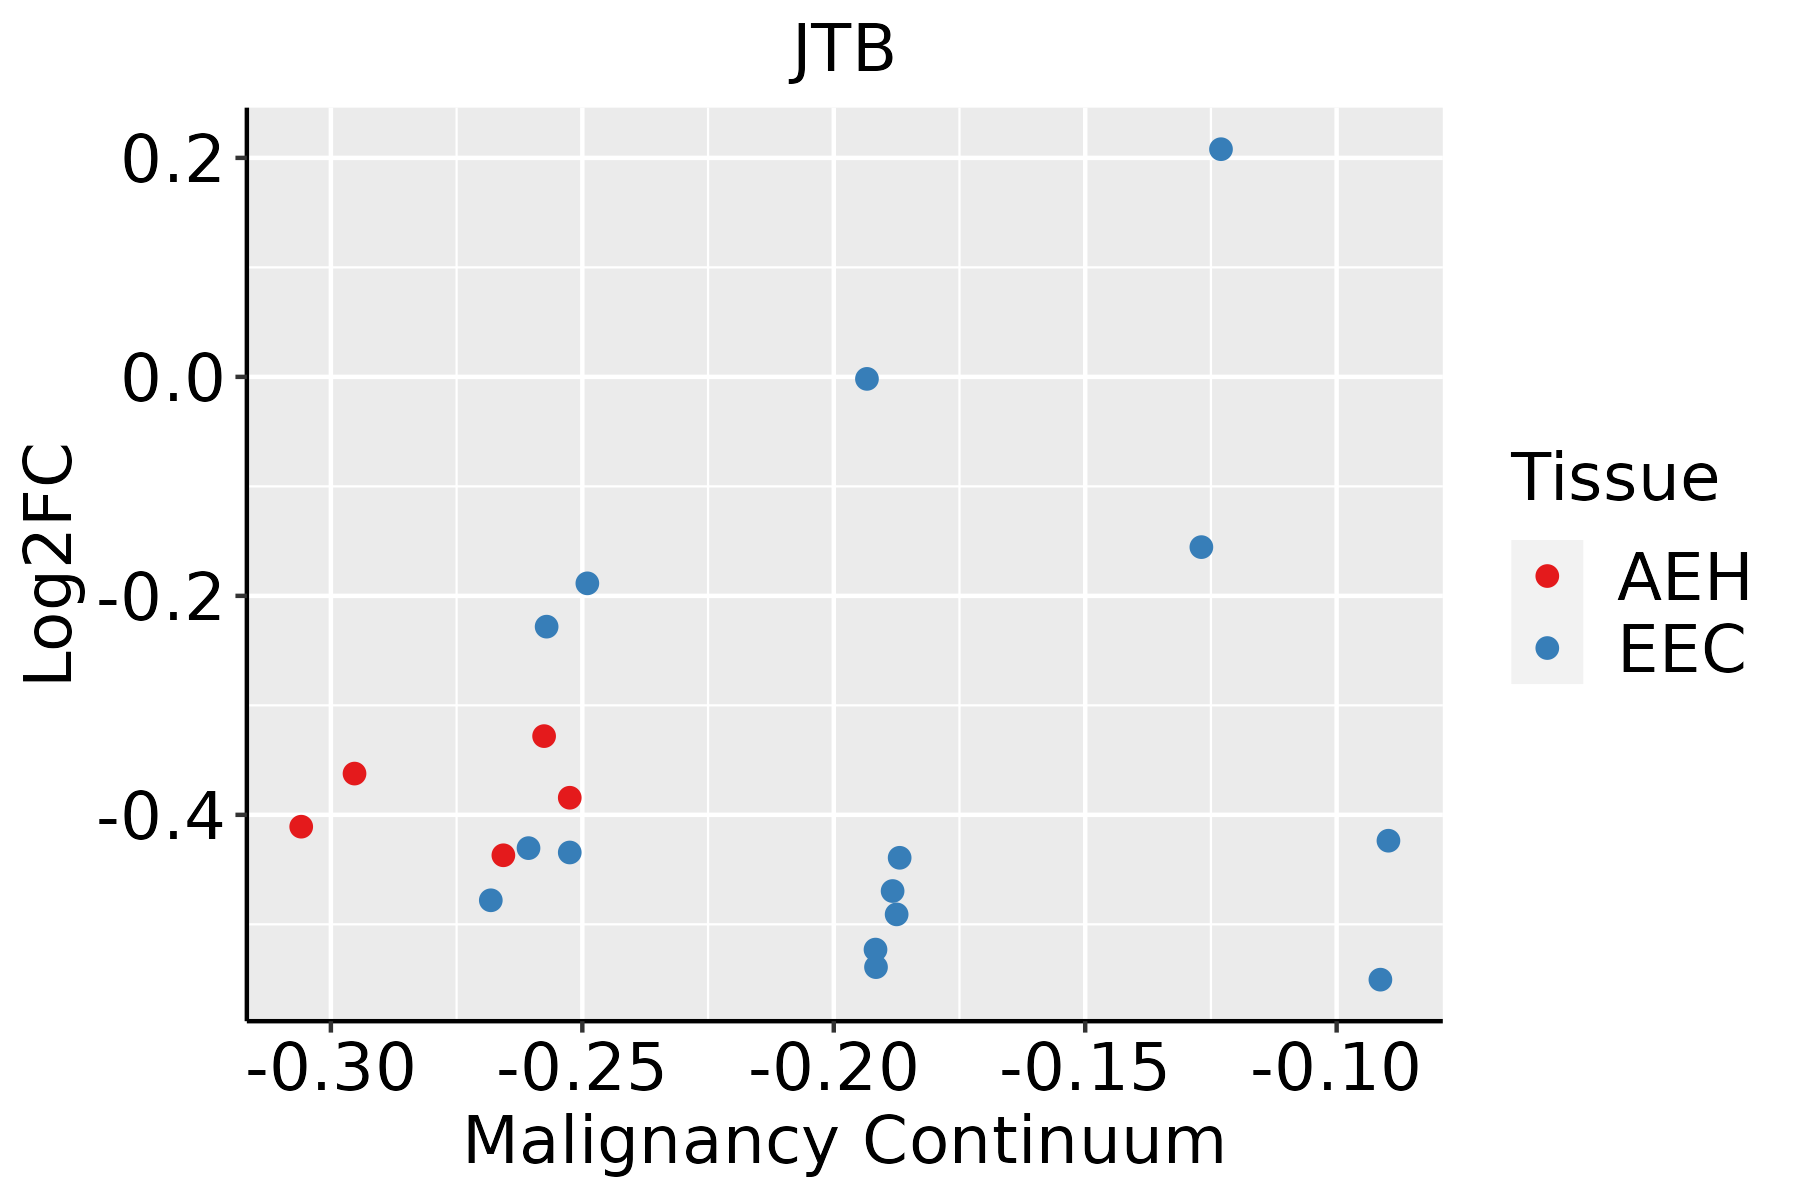 | AEH: Atypical endometrial hyperplasia |
| EEC: Endometrioid Cancer |
| Esophagus | 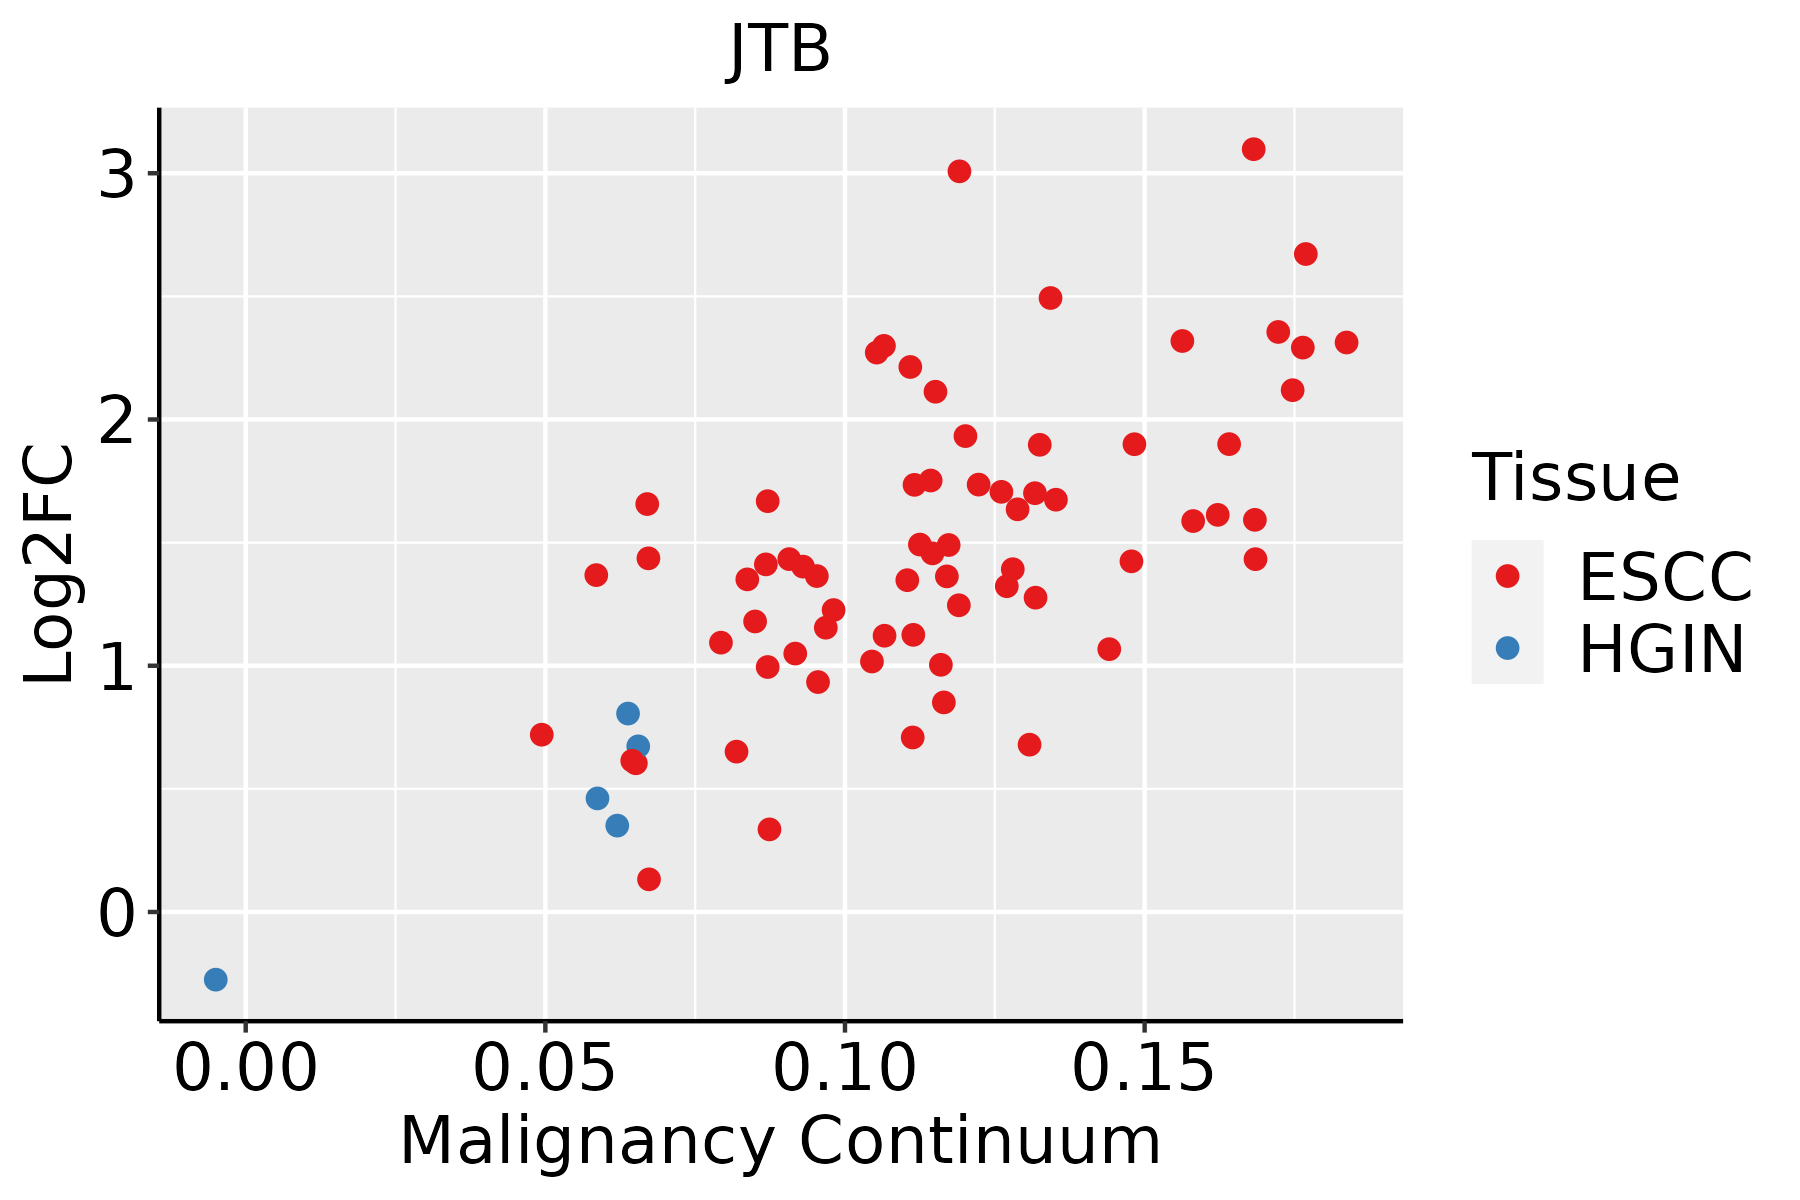 | ESCC: Esophageal squamous cell carcinoma |
| HGIN: High-grade intraepithelial neoplasias |
| LGIN: Low-grade intraepithelial neoplasias |
| Liver |  | HCC: Hepatocellular carcinoma |
| NAFLD: Non-alcoholic fatty liver disease |
| Oral Cavity |  | EOLP: Erosive Oral lichen planus |
| LP: leukoplakia |
| NEOLP: Non-erosive oral lichen planus |
| OSCC: Oral squamous cell carcinoma |
| Prostate |  | BPH: Benign Prostatic Hyperplasia |
| Skin | 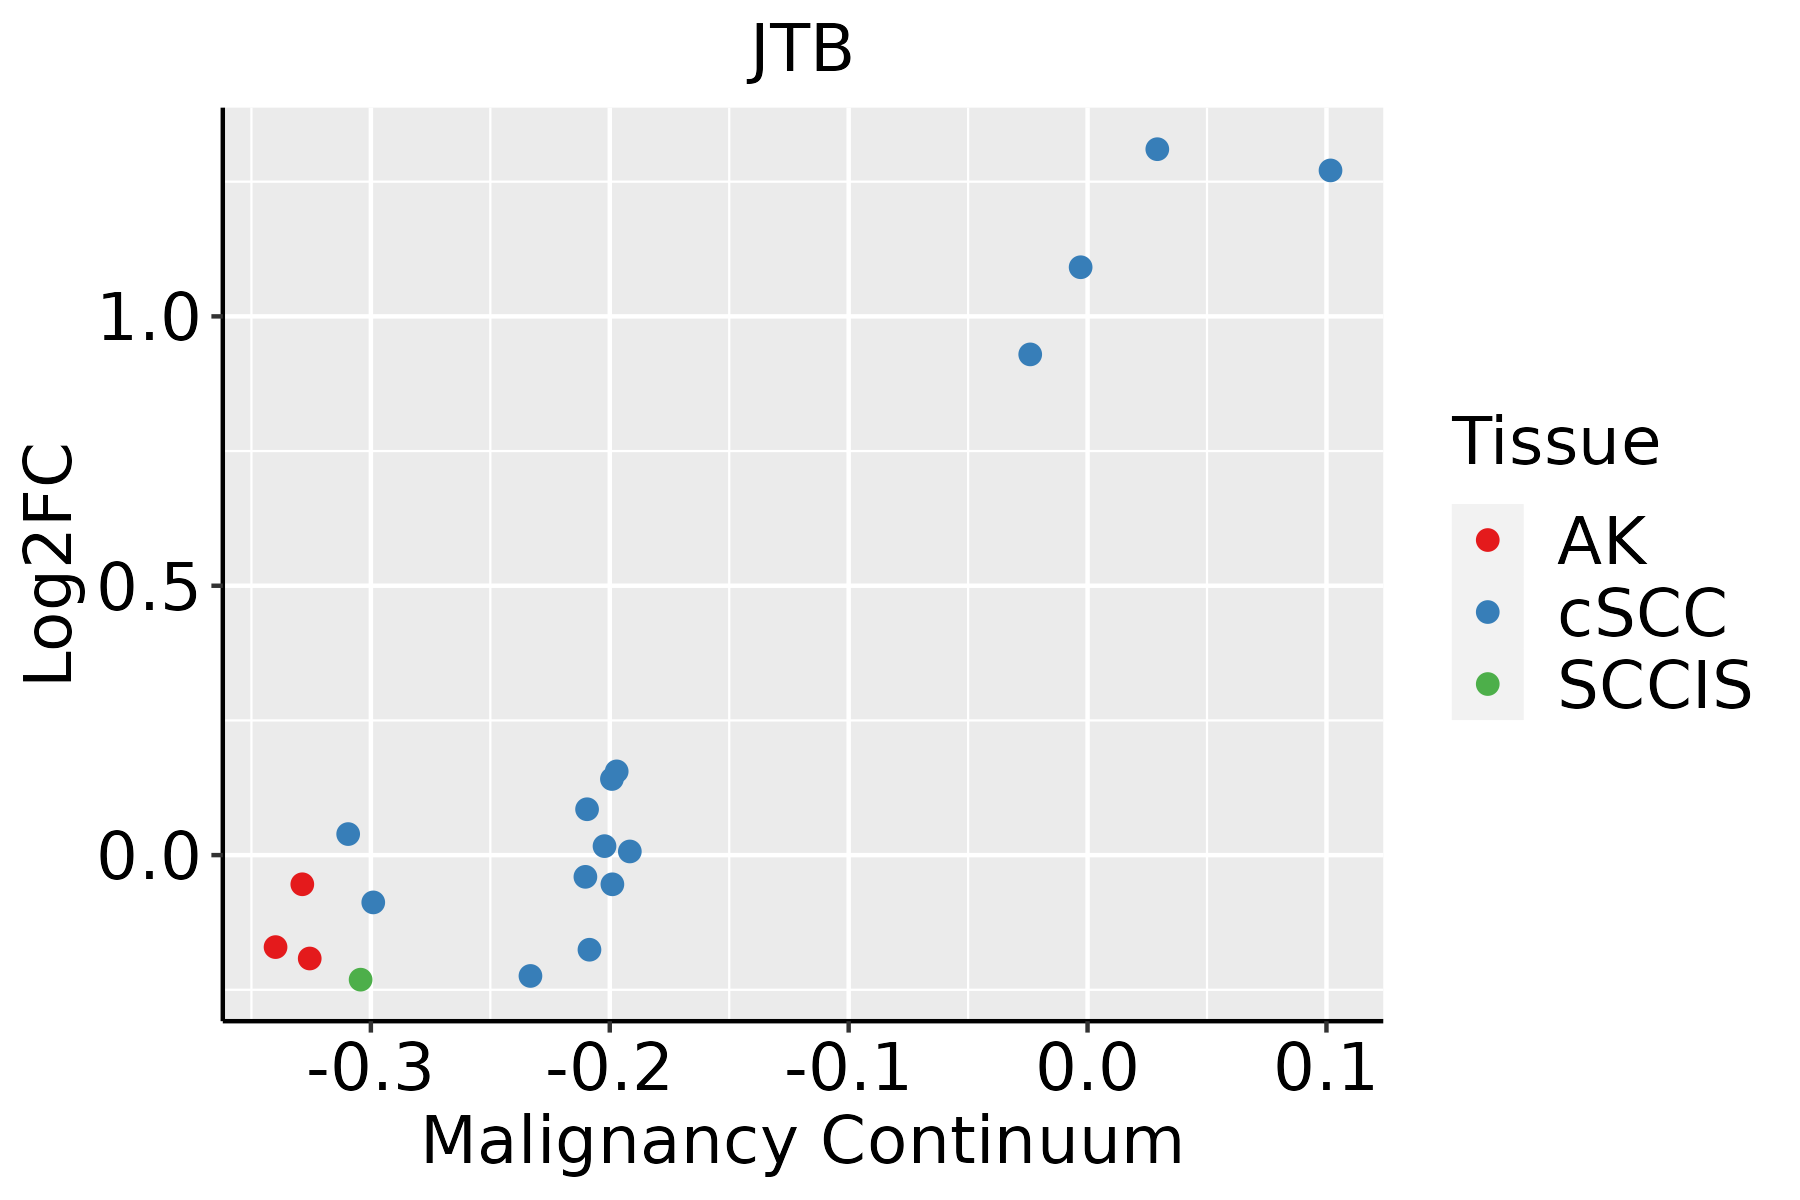 | AK: Actinic keratosis |
| cSCC: Cutaneous squamous cell carcinoma |
| SCCIS:squamous cell carcinoma in situ |
| Thyroid |  | ATC: Anaplastic thyroid cancer |
| HT: Hashimoto's thyroiditis |
| PTC: Papillary thyroid cancer |
| GO ID | Tissue | Disease Stage | Description | Gene Ratio | Bg Ratio | pvalue | p.adjust | Count |
| GO:00336749 | Breast | Precancer | positive regulation of kinase activity | 42/1080 | 467/18723 | 2.94e-03 | 2.54e-02 | 42 |
| GO:003367410 | Cervix | CC | positive regulation of kinase activity | 101/2311 | 467/18723 | 8.66e-09 | 7.22e-07 | 101 |
| GO:00458608 | Cervix | CC | positive regulation of protein kinase activity | 85/2311 | 386/18723 | 5.61e-08 | 3.29e-06 | 85 |
| GO:00009107 | Cervix | CC | cytokinesis | 37/2311 | 173/18723 | 5.40e-04 | 5.23e-03 | 37 |
| GO:004586023 | Cervix | N_HPV | positive regulation of protein kinase activity | 22/534 | 386/18723 | 1.73e-03 | 1.75e-02 | 22 |
| GO:003367422 | Cervix | N_HPV | positive regulation of kinase activity | 25/534 | 467/18723 | 2.05e-03 | 1.98e-02 | 25 |
| GO:0000910 | Colorectum | AD | cytokinesis | 59/3918 | 173/18723 | 3.74e-05 | 6.75e-04 | 59 |
| GO:0033674 | Colorectum | AD | positive regulation of kinase activity | 131/3918 | 467/18723 | 1.28e-04 | 1.85e-03 | 131 |
| GO:0061640 | Colorectum | AD | cytoskeleton-dependent cytokinesis | 37/3918 | 100/18723 | 1.58e-04 | 2.20e-03 | 37 |
| GO:0045860 | Colorectum | AD | positive regulation of protein kinase activity | 107/3918 | 386/18723 | 8.01e-04 | 7.92e-03 | 107 |
| GO:0000281 | Colorectum | AD | mitotic cytokinesis | 25/3918 | 71/18723 | 3.77e-03 | 2.65e-02 | 25 |
| GO:00009101 | Colorectum | SER | cytokinesis | 45/2897 | 173/18723 | 2.28e-04 | 3.93e-03 | 45 |
| GO:00616401 | Colorectum | SER | cytoskeleton-dependent cytokinesis | 29/2897 | 100/18723 | 4.25e-04 | 6.25e-03 | 29 |
| GO:00336741 | Colorectum | SER | positive regulation of kinase activity | 95/2897 | 467/18723 | 2.62e-03 | 2.41e-02 | 95 |
| GO:00458601 | Colorectum | SER | positive regulation of protein kinase activity | 79/2897 | 386/18723 | 4.85e-03 | 3.79e-02 | 79 |
| GO:00336742 | Colorectum | MSS | positive regulation of kinase activity | 122/3467 | 467/18723 | 2.50e-05 | 5.21e-04 | 122 |
| GO:00458602 | Colorectum | MSS | positive regulation of protein kinase activity | 102/3467 | 386/18723 | 6.93e-05 | 1.20e-03 | 102 |
| GO:00009102 | Colorectum | MSS | cytokinesis | 49/3467 | 173/18723 | 1.02e-03 | 1.02e-02 | 49 |
| GO:00002811 | Colorectum | MSS | mitotic cytokinesis | 23/3467 | 71/18723 | 3.55e-03 | 2.63e-02 | 23 |
| GO:00336743 | Colorectum | MSI-H | positive regulation of kinase activity | 53/1319 | 467/18723 | 3.99e-04 | 8.98e-03 | 53 |
| Hugo Symbol | Variant Class | Variant Classification | dbSNP RS | HGVSc | HGVSp | HGVSp Short | SWISSPROT | BIOTYPE | SIFT | PolyPhen | Tumor Sample Barcode | Tissue | Histology | Sex | Age | Stage | Therapy Types | Drugs | Outcome |
| JTB | SNV | Missense_Mutation | novel | c.303N>A | p.Met101Ile | p.M101I | O76095 | protein_coding | deleterious(0.01) | benign(0.081) | TCGA-AN-A0AM-01 | Breast | breast invasive carcinoma | Female | <65 | I/II | Unknown | Unknown | SD |
| JTB | SNV | Missense_Mutation | | c.184C>T | p.Pro62Ser | p.P62S | O76095 | protein_coding | tolerated(0.14) | benign(0.038) | TCGA-IR-A3LK-01 | Cervix | cervical & endocervical cancer | Female | >=65 | I/II | Chemotherapy | cisplatin | PD |
| JTB | SNV | Missense_Mutation | rs778131192 | c.121G>A | p.Ala41Thr | p.A41T | O76095 | protein_coding | tolerated(0.63) | benign(0.038) | TCGA-AA-A022-01 | Colorectum | colon adenocarcinoma | Female | >=65 | I/II | Unknown | Unknown | SD |
| JTB | SNV | Missense_Mutation | novel | c.22N>A | p.Pro8Thr | p.P8T | O76095 | protein_coding | tolerated_low_confidence(0.21) | benign(0.007) | TCGA-A5-A7WJ-01 | Endometrium | uterine corpus endometrioid carcinoma | Female | <65 | I/II | Unknown | Unknown | SD |
| JTB | SNV | Missense_Mutation | novel | c.79N>T | p.Leu27Phe | p.L27F | O76095 | protein_coding | tolerated(0.31) | benign(0.005) | TCGA-AP-A1DK-01 | Endometrium | uterine corpus endometrioid carcinoma | Female | <65 | I/II | Unknown | Unknown | SD |
| JTB | SNV | Missense_Mutation | | c.92A>G | p.Glu31Gly | p.E31G | O76095 | protein_coding | tolerated(0.1) | benign(0.006) | TCGA-BK-A0C9-01 | Endometrium | uterine corpus endometrioid carcinoma | Female | <65 | I/II | Unknown | Unknown | SD |
| JTB | SNV | Missense_Mutation | novel | c.413N>T | p.Lys138Met | p.K138M | O76095 | protein_coding | deleterious(0) | probably_damaging(0.999) | TCGA-D1-A175-01 | Endometrium | uterine corpus endometrioid carcinoma | Female | <65 | I/II | Chemotherapy | paclitaxel | SD |
| JTB | SNV | Missense_Mutation | novel | c.134N>C | p.Asn45Thr | p.N45T | O76095 | protein_coding | tolerated(0.75) | benign(0.003) | TCGA-EO-A3B0-01 | Endometrium | uterine corpus endometrioid carcinoma | Female | <65 | III/IV | Unknown | Unknown | SD |
| JTB | SNV | Missense_Mutation | | c.101N>A | p.Val34Glu | p.V34E | O76095 | protein_coding | tolerated(0.14) | benign(0.005) | TCGA-35-5375-01 | Lung | lung adenocarcinoma | Male | <65 | III/IV | Unknown | Unknown | SD |
| JTB | SNV | Missense_Mutation | novel | c.430N>A | p.Glu144Lys | p.E144K | O76095 | protein_coding | deleterious(0.01) | possibly_damaging(0.823) | TCGA-CV-A45O-01 | Oral cavity | head & neck squamous cell carcinoma | Male | <65 | I/II | Unknown | Unknown | SD |


