
|
|||||
|
 | |
| |
| |
| |
| |
| |
|
Gene: JOSD2 |
Gene summary for JOSD2 |
| Gene information | Species | Human | Gene symbol | JOSD2 | Gene ID | 126119 |
| Gene name | Josephin domain containing 2 | |
| Gene Alias | SBBI54 | |
| Cytomap | 19q13.33 | |
| Gene Type | protein-coding | GO ID | GO:0006464 | UniProtAcc | A0A024R4G2 |
Top |
Malignant transformation analysis |
| Identification of the aberrant gene expression in precancerous and cancerous lesions by comparing the gene expression of stem-like cells in diseased tissues with normal stem cells |
| Entrez ID | Symbol | Replicates | Species | Organ | Tissue | Adj P-value | Log2FC | Malignancy |
| 126119 | JOSD2 | LZE2T | Human | Esophagus | ESCC | 2.22e-03 | 8.13e-01 | 0.082 |
| 126119 | JOSD2 | LZE4T | Human | Esophagus | ESCC | 1.20e-18 | 5.94e-01 | 0.0811 |
| 126119 | JOSD2 | LZE5T | Human | Esophagus | ESCC | 1.18e-05 | 4.10e-01 | 0.0514 |
| 126119 | JOSD2 | LZE7T | Human | Esophagus | ESCC | 5.00e-10 | 3.97e-01 | 0.0667 |
| 126119 | JOSD2 | LZE8T | Human | Esophagus | ESCC | 8.50e-20 | 4.45e-01 | 0.067 |
| 126119 | JOSD2 | LZE20T | Human | Esophagus | ESCC | 1.38e-05 | 1.91e-01 | 0.0662 |
| 126119 | JOSD2 | LZE22D1 | Human | Esophagus | HGIN | 8.96e-03 | 1.21e-01 | 0.0595 |
| 126119 | JOSD2 | LZE22T | Human | Esophagus | ESCC | 6.95e-09 | 4.10e-01 | 0.068 |
| 126119 | JOSD2 | LZE24T | Human | Esophagus | ESCC | 1.75e-22 | 6.67e-01 | 0.0596 |
| 126119 | JOSD2 | LZE21T | Human | Esophagus | ESCC | 1.14e-02 | 4.87e-01 | 0.0655 |
| 126119 | JOSD2 | LZE6T | Human | Esophagus | ESCC | 5.04e-13 | 6.16e-01 | 0.0845 |
| 126119 | JOSD2 | P1T-E | Human | Esophagus | ESCC | 3.82e-15 | 6.57e-01 | 0.0875 |
| 126119 | JOSD2 | P2T-E | Human | Esophagus | ESCC | 7.78e-24 | 4.79e-01 | 0.1177 |
| 126119 | JOSD2 | P4T-E | Human | Esophagus | ESCC | 2.01e-27 | 6.80e-01 | 0.1323 |
| 126119 | JOSD2 | P5T-E | Human | Esophagus | ESCC | 6.90e-27 | 4.85e-01 | 0.1327 |
| 126119 | JOSD2 | P8T-E | Human | Esophagus | ESCC | 8.53e-45 | 8.74e-01 | 0.0889 |
| 126119 | JOSD2 | P9T-E | Human | Esophagus | ESCC | 2.24e-27 | 5.80e-01 | 0.1131 |
| 126119 | JOSD2 | P10T-E | Human | Esophagus | ESCC | 1.52e-24 | 6.08e-01 | 0.116 |
| 126119 | JOSD2 | P11T-E | Human | Esophagus | ESCC | 3.07e-34 | 1.16e+00 | 0.1426 |
| 126119 | JOSD2 | P12T-E | Human | Esophagus | ESCC | 4.88e-21 | 4.66e-01 | 0.1122 |
| Page: 1 2 3 4 5 6 7 |
| Tissue | Expression Dynamics | Abbreviation |
| Esophagus |  | ESCC: Esophageal squamous cell carcinoma |
| HGIN: High-grade intraepithelial neoplasias | ||
| LGIN: Low-grade intraepithelial neoplasias | ||
| Liver | 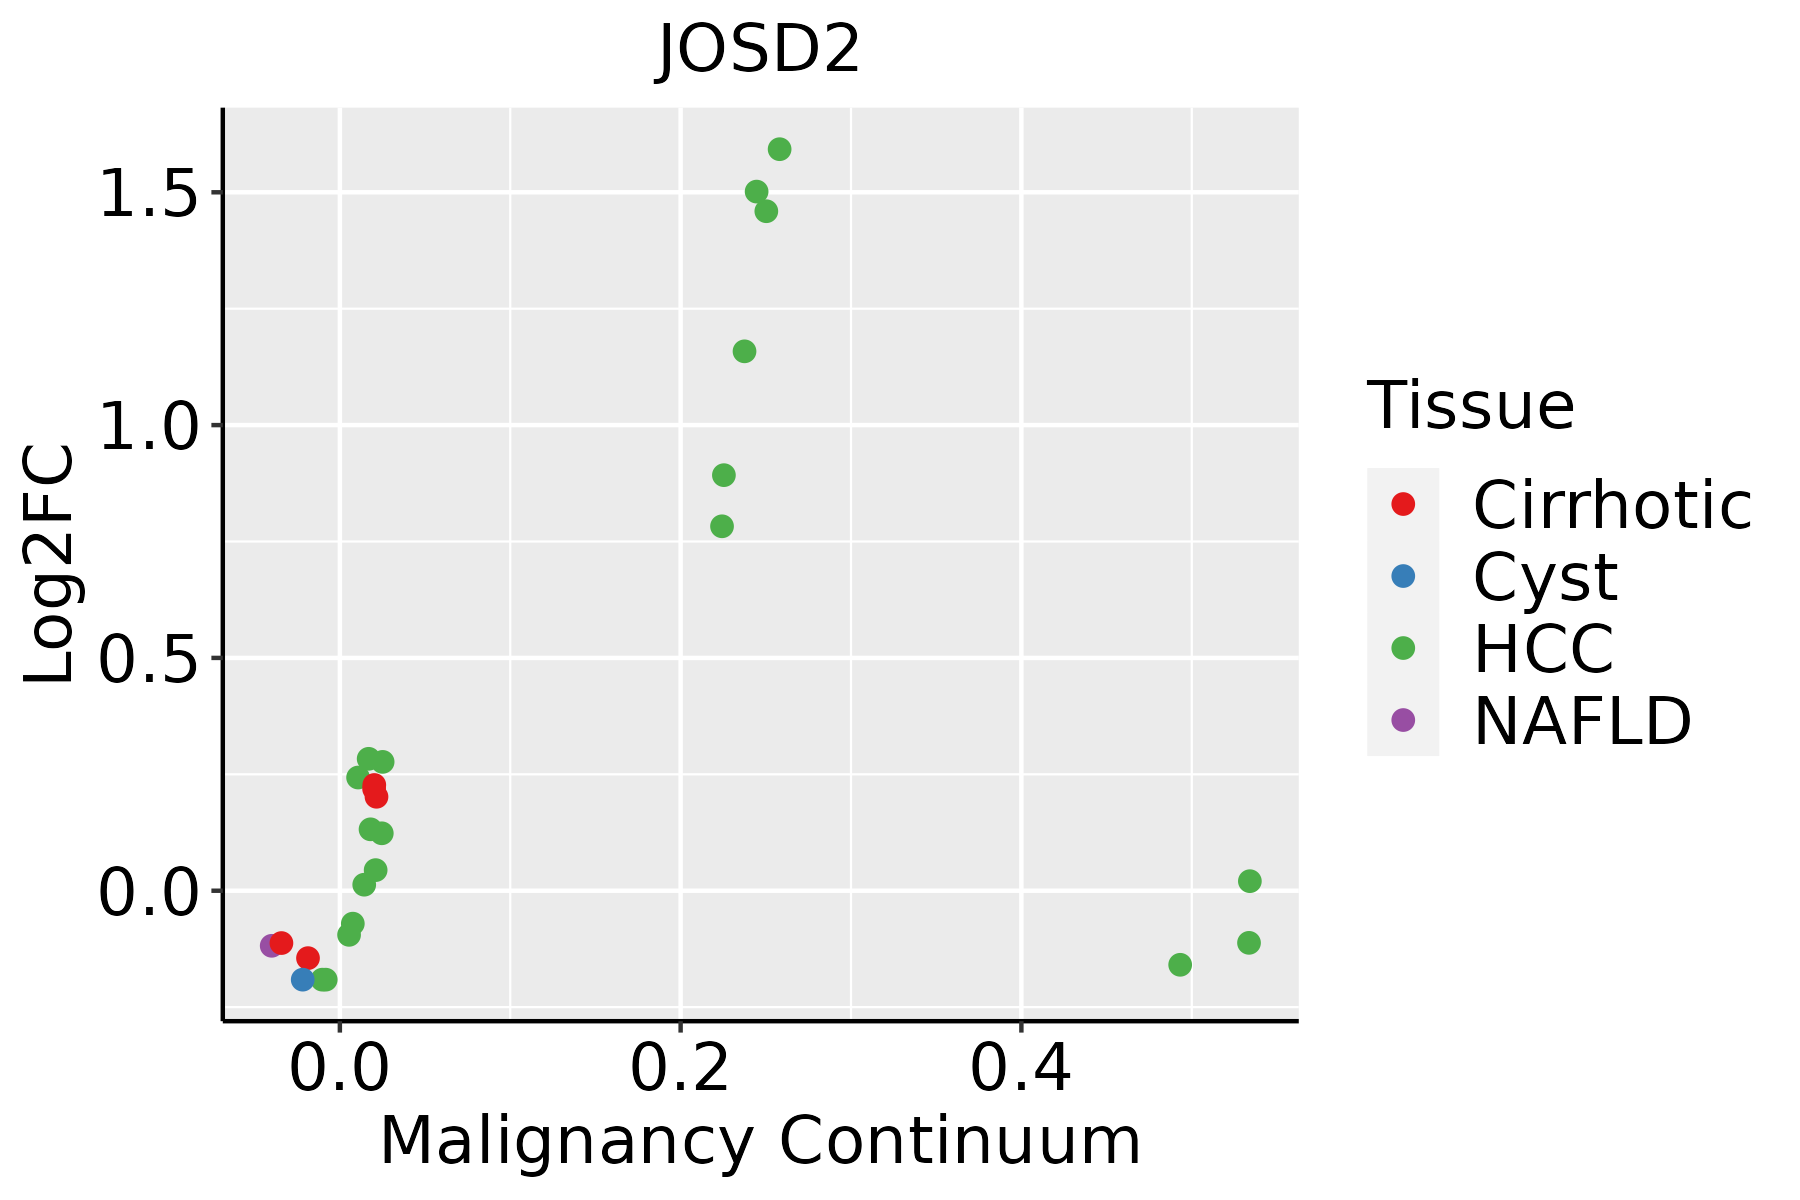 | HCC: Hepatocellular carcinoma |
| NAFLD: Non-alcoholic fatty liver disease | ||
| Oral Cavity | 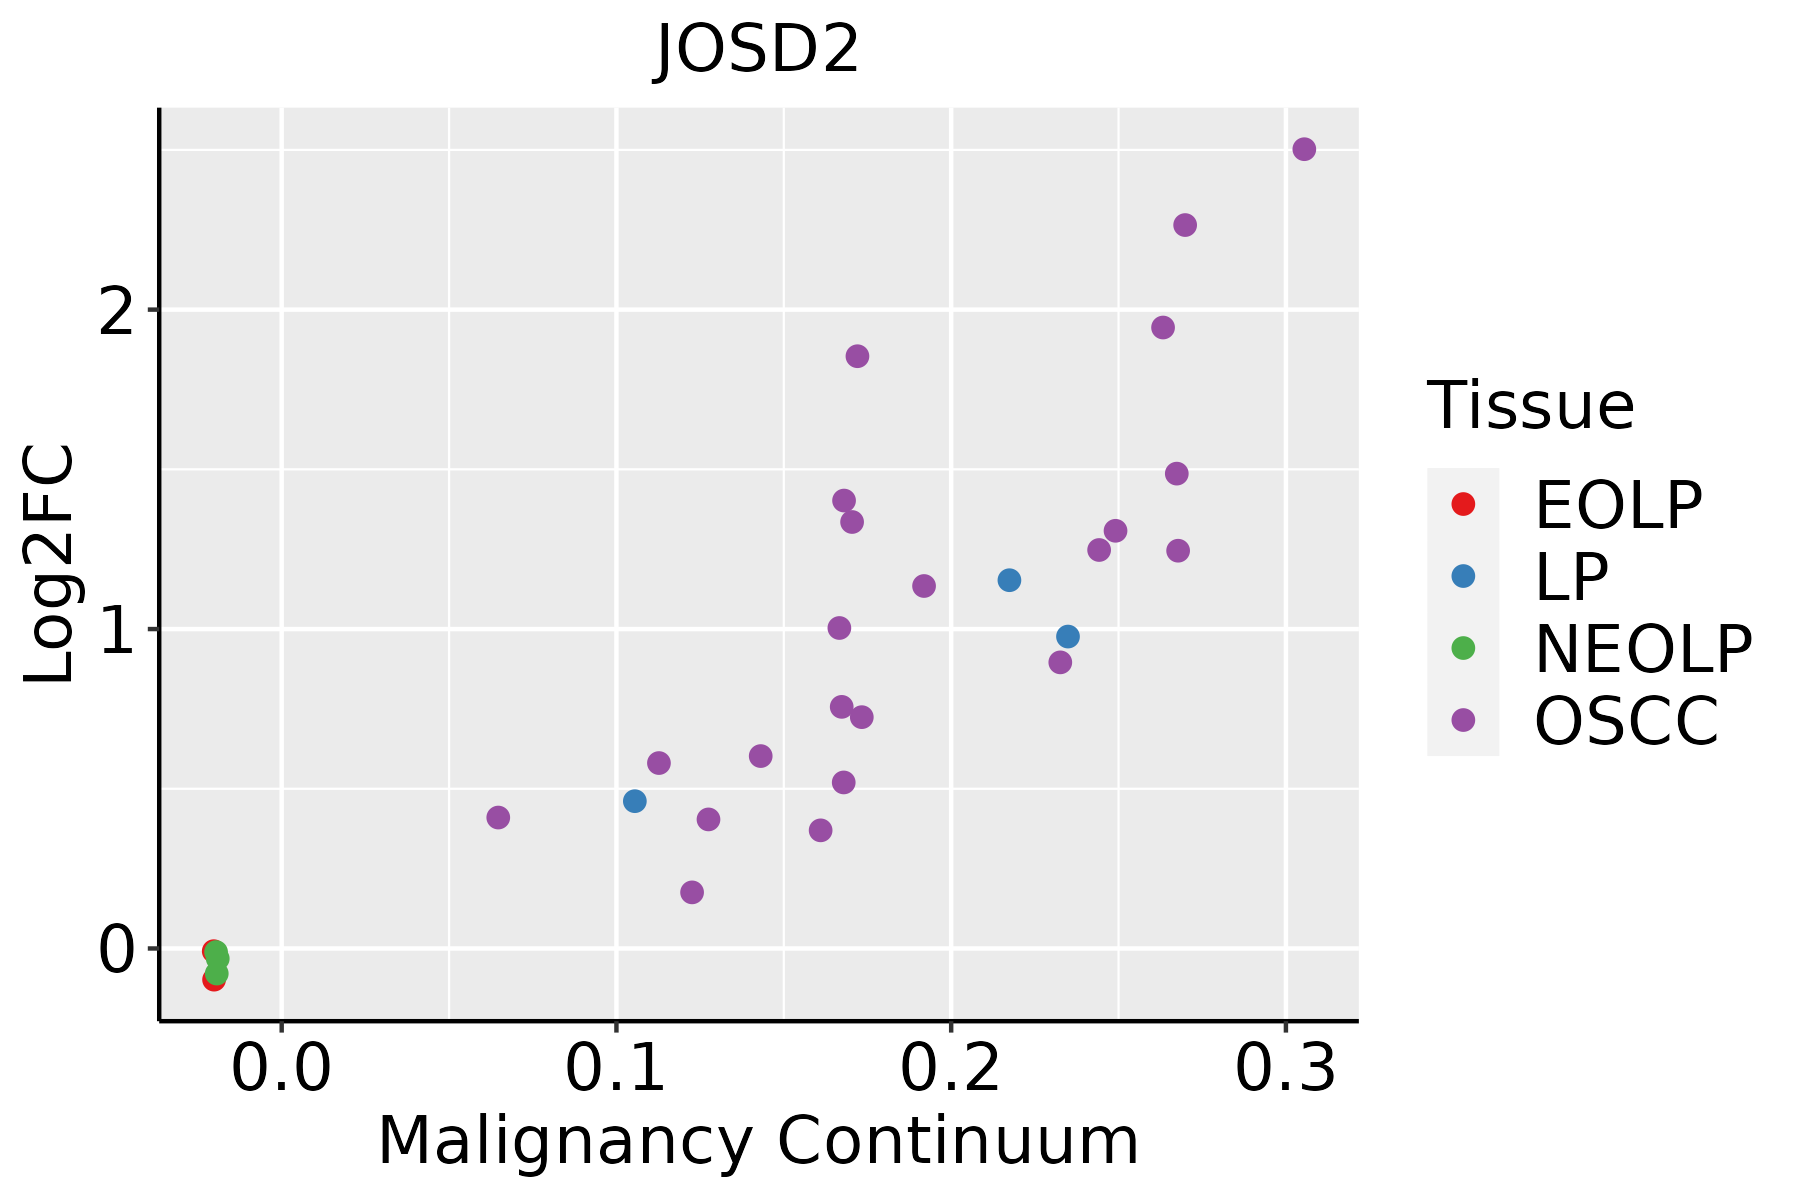 | EOLP: Erosive Oral lichen planus |
| LP: leukoplakia | ||
| NEOLP: Non-erosive oral lichen planus | ||
| OSCC: Oral squamous cell carcinoma | ||
| Skin | 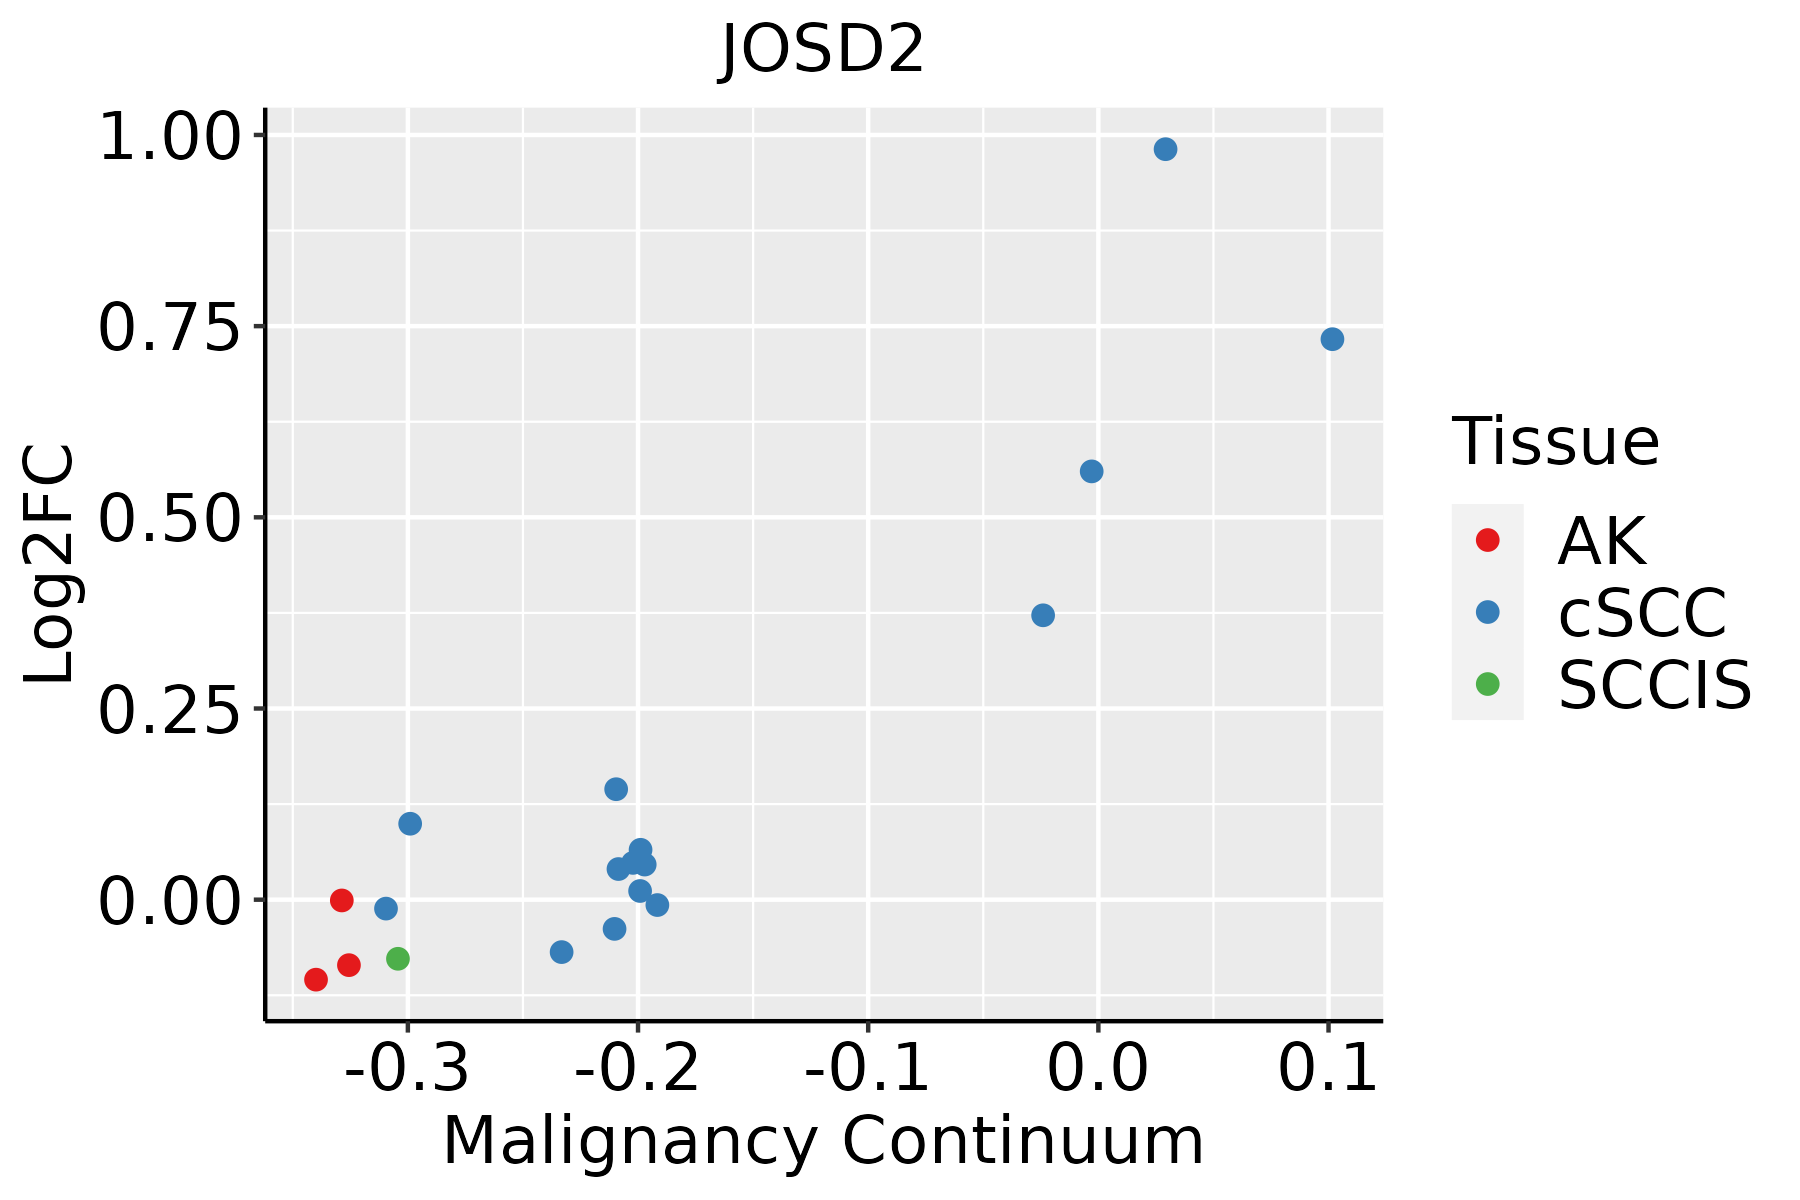 | AK: Actinic keratosis |
| cSCC: Cutaneous squamous cell carcinoma | ||
| SCCIS:squamous cell carcinoma in situ | ||
| Thyroid |  | ATC: Anaplastic thyroid cancer |
| HT: Hashimoto's thyroiditis | ||
| PTC: Papillary thyroid cancer |
| ∗log2FC in expression of this searched gene in stem-like cells from each diseased tissue sample relative to stem-like cells in normal samples in each tissue plotted against the malignancy continuum. Samples are colored based on if they are from different disease stage. |
Top |
Malignant transformation related pathway analysis |
| Find out the enriched GO biological processes and KEGG pathways involved in transition from healthy to precancer to cancer |
| Tissue | Disease Stage | Enriched GO biological Processes |
| Colorectum | AD |  |
| Colorectum | SER |  |
| Colorectum | MSS |  |
| Colorectum | MSI-H |  |
| Colorectum | FAP |  |
| ∗Top 15 enriched GO BP terms are showed in the bar plot of each disease state in each tissue. Each row represents a significant GO biological process which is colored according to the -log10(p.adjust). |
| Page: 1 2 3 4 5 6 7 8 9 |
| GO ID | Tissue | Disease Stage | Description | Gene Ratio | Bg Ratio | pvalue | p.adjust | Count |
| GO:00706463 | Esophagus | HGIN | protein modification by small protein removal | 34/2587 | 157/18723 | 4.68e-03 | 4.02e-02 | 34 |
| GO:007064612 | Esophagus | ESCC | protein modification by small protein removal | 95/8552 | 157/18723 | 1.25e-04 | 8.56e-04 | 95 |
| GO:00165793 | Esophagus | ESCC | protein deubiquitination | 79/8552 | 139/18723 | 5.23e-03 | 1.97e-02 | 79 |
| GO:00706461 | Liver | HCC | protein modification by small protein removal | 91/7958 | 157/18723 | 6.50e-05 | 5.92e-04 | 91 |
| GO:00165791 | Liver | HCC | protein deubiquitination | 78/7958 | 139/18723 | 8.13e-04 | 4.87e-03 | 78 |
| GO:00706462 | Oral cavity | OSCC | protein modification by small protein removal | 77/7305 | 157/18723 | 6.55e-03 | 2.43e-02 | 77 |
| GO:00706464 | Skin | cSCC | protein modification by small protein removal | 55/4864 | 157/18723 | 7.29e-03 | 3.46e-02 | 55 |
| GO:00706465 | Thyroid | PTC | protein modification by small protein removal | 71/5968 | 157/18723 | 3.03e-04 | 2.12e-03 | 71 |
| GO:00165794 | Thyroid | PTC | protein deubiquitination | 59/5968 | 139/18723 | 5.50e-03 | 2.50e-02 | 59 |
| GO:007064613 | Thyroid | ATC | protein modification by small protein removal | 71/6293 | 157/18723 | 1.59e-03 | 7.99e-03 | 71 |
| Page: 1 |
| Pathway ID | Tissue | Disease Stage | Description | Gene Ratio | Bg Ratio | pvalue | p.adjust | qvalue | Count |
| Page: 1 |
Top |
Cell-cell communication analysis |
| Identification of potential cell-cell interactions between two cell types and their ligand-receptor pairs for different disease states |
| Ligand | Receptor | LRpair | Pathway | Tissue | Disease Stage |
| Page: 1 |
Top |
Single-cell gene regulatory network inference analysis |
| Find out the significant the regulons (TFs) and the target genes of each regulon across cell types for different disease states |
| TF | Cell Type | Tissue | Disease Stage | Target Gene | RSS | Regulon Activity |
| ∗The dot plots of a searched regulon are shown for all cell subpopulations in each disease state of each tissue based on the regulon specific score inferred using pySCENIC and by calculating the average expression. |
| Page: 1 |
Top |
Somatic mutation of malignant transformation related genes |
| Annotation of somatic variants for genes involved in malignant transformation |
| Hugo Symbol | Variant Class | Variant Classification | dbSNP RS | HGVSc | HGVSp | HGVSp Short | SWISSPROT | BIOTYPE | SIFT | PolyPhen | Tumor Sample Barcode | Tissue | Histology | Sex | Age | Stage | Therapy Types | Drugs | Outcome |
| JOSD2 | SNV | Missense_Mutation | c.146N>T | p.Arg49Met | p.R49M | Q8TAC2 | protein_coding | deleterious(0.01) | probably_damaging(0.917) | TCGA-CK-4951-01 | Colorectum | colon adenocarcinoma | Female | >=65 | I/II | Unknown | Unknown | PD | |
| JOSD2 | SNV | Missense_Mutation | novel | c.500N>G | p.Leu167Arg | p.L167R | Q8TAC2 | protein_coding | tolerated(0.44) | benign(0.337) | TCGA-AJ-A23O-01 | Endometrium | uterine corpus endometrioid carcinoma | Female | >=65 | I/II | Unknown | Unknown | SD |
| JOSD2 | SNV | Missense_Mutation | novel | c.4N>C | p.Ser2Pro | p.S2P | Q8TAC2 | protein_coding | deleterious_low_confidence(0.03) | benign(0.063) | TCGA-AP-A1DV-01 | Endometrium | uterine corpus endometrioid carcinoma | Female | <65 | I/II | Unknown | Unknown | SD |
| JOSD2 | SNV | Missense_Mutation | novel | c.176N>G | p.His59Arg | p.H59R | Q8TAC2 | protein_coding | deleterious(0.03) | probably_damaging(0.987) | TCGA-AP-A1E0-01 | Endometrium | uterine corpus endometrioid carcinoma | Female | <65 | III/IV | Chemotherapy | paclitaxel | SD |
| JOSD2 | SNV | Missense_Mutation | novel | c.269G>T | p.Arg90Met | p.R90M | Q8TAC2 | protein_coding | deleterious(0) | probably_damaging(0.996) | TCGA-BK-A6W3-01 | Endometrium | uterine corpus endometrioid carcinoma | Female | <65 | I/II | Unknown | Unknown | SD |
| JOSD2 | SNV | Missense_Mutation | rs201074779 | c.434C>T | p.Ala145Val | p.A145V | Q8TAC2 | protein_coding | tolerated(0.15) | possibly_damaging(0.553) | TCGA-BS-A0UF-01 | Endometrium | uterine corpus endometrioid carcinoma | Female | >=65 | I/II | Unknown | Unknown | SD |
| JOSD2 | SNV | Missense_Mutation | rs370080842 | c.146G>A | p.Arg49Lys | p.R49K | Q8TAC2 | protein_coding | tolerated(0.09) | possibly_damaging(0.514) | TCGA-BS-A0UF-01 | Endometrium | uterine corpus endometrioid carcinoma | Female | >=65 | I/II | Unknown | Unknown | SD |
| JOSD2 | SNV | Missense_Mutation | rs752079881 | c.163N>T | p.Arg55Trp | p.R55W | Q8TAC2 | protein_coding | tolerated(0.68) | possibly_damaging(0.787) | TCGA-D1-A175-01 | Endometrium | uterine corpus endometrioid carcinoma | Female | <65 | I/II | Chemotherapy | paclitaxel | SD |
| JOSD2 | SNV | Missense_Mutation | rs529983360 | c.485N>T | p.Ala162Val | p.A162V | Q8TAC2 | protein_coding | tolerated(0.3) | benign(0.005) | TCGA-EO-A22R-01 | Endometrium | uterine corpus endometrioid carcinoma | Female | <65 | I/II | Unknown | Unknown | SD |
| JOSD2 | SNV | Missense_Mutation | novel | c.271N>G | p.Arg91Gly | p.R91G | Q8TAC2 | protein_coding | deleterious(0.05) | probably_damaging(0.987) | TCGA-UB-A7MB-01 | Liver | liver hepatocellular carcinoma | Male | <65 | I/II | Targeted Molecular therapy | sorafenib | PD |
| Page: 1 2 |
Top |
Related drugs of malignant transformation related genes |
| Identification of chemicals and drugs interact with genes involved in malignant transfromation |
| (DGIdb 4.0) |
| Entrez ID | Symbol | Category | Interaction Types | Drug Claim Name | Drug Name | PMIDs |
| Page: 1 |

Copyright 2023-Present -The University of Texas Health Science Center at Houston |