
|
|||||
|
 | |
| |
| |
| |
| |
| |
|
Gene: JOSD1 |
Gene summary for JOSD1 |
| Gene information | Species | Human | Gene symbol | JOSD1 | Gene ID | 9929 |
| Gene name | Josephin domain containing 1 | |
| Gene Alias | dJ508I15.2 | |
| Cytomap | 22q13.1 | |
| Gene Type | protein-coding | GO ID | GO:0006464 | UniProtAcc | A0A024R1P5 |
Top |
Malignant transformation analysis |
| Identification of the aberrant gene expression in precancerous and cancerous lesions by comparing the gene expression of stem-like cells in diseased tissues with normal stem cells |
| Entrez ID | Symbol | Replicates | Species | Organ | Tissue | Adj P-value | Log2FC | Malignancy |
| 9929 | JOSD1 | HTA11_411_2000001011 | Human | Colorectum | SER | 4.32e-04 | 7.69e-01 | -0.2602 |
| 9929 | JOSD1 | HTA11_83_2000001011 | Human | Colorectum | SER | 1.02e-02 | 3.48e-01 | -0.1526 |
| 9929 | JOSD1 | HTA11_99999971662_82457 | Human | Colorectum | MSS | 3.73e-04 | 2.87e-01 | 0.3859 |
| 9929 | JOSD1 | LZE4T | Human | Esophagus | ESCC | 1.76e-07 | 2.26e-02 | 0.0811 |
| 9929 | JOSD1 | LZE7T | Human | Esophagus | ESCC | 2.26e-06 | 8.88e-02 | 0.0667 |
| 9929 | JOSD1 | LZE8T | Human | Esophagus | ESCC | 2.21e-04 | -6.19e-02 | 0.067 |
| 9929 | JOSD1 | LZE24T | Human | Esophagus | ESCC | 1.63e-17 | 3.43e-01 | 0.0596 |
| 9929 | JOSD1 | LZE21T | Human | Esophagus | ESCC | 1.77e-07 | 2.99e-01 | 0.0655 |
| 9929 | JOSD1 | LZE6T | Human | Esophagus | ESCC | 1.03e-05 | -2.50e-02 | 0.0845 |
| 9929 | JOSD1 | P1T-E | Human | Esophagus | ESCC | 5.44e-06 | 6.09e-01 | 0.0875 |
| 9929 | JOSD1 | P2T-E | Human | Esophagus | ESCC | 1.27e-13 | 2.23e-01 | 0.1177 |
| 9929 | JOSD1 | P4T-E | Human | Esophagus | ESCC | 1.47e-21 | 2.58e-01 | 0.1323 |
| 9929 | JOSD1 | P5T-E | Human | Esophagus | ESCC | 4.08e-17 | 1.93e-01 | 0.1327 |
| 9929 | JOSD1 | P8T-E | Human | Esophagus | ESCC | 4.29e-17 | 1.44e-01 | 0.0889 |
| 9929 | JOSD1 | P9T-E | Human | Esophagus | ESCC | 4.64e-13 | 2.98e-01 | 0.1131 |
| 9929 | JOSD1 | P10T-E | Human | Esophagus | ESCC | 1.21e-18 | 3.07e-01 | 0.116 |
| 9929 | JOSD1 | P11T-E | Human | Esophagus | ESCC | 3.42e-06 | 9.30e-02 | 0.1426 |
| 9929 | JOSD1 | P12T-E | Human | Esophagus | ESCC | 4.22e-11 | 2.74e-01 | 0.1122 |
| 9929 | JOSD1 | P15T-E | Human | Esophagus | ESCC | 2.20e-12 | 8.14e-02 | 0.1149 |
| 9929 | JOSD1 | P16T-E | Human | Esophagus | ESCC | 6.60e-20 | 1.28e-01 | 0.1153 |
| Page: 1 2 3 4 5 6 |
| Tissue | Expression Dynamics | Abbreviation |
| Colorectum (GSE201348) | 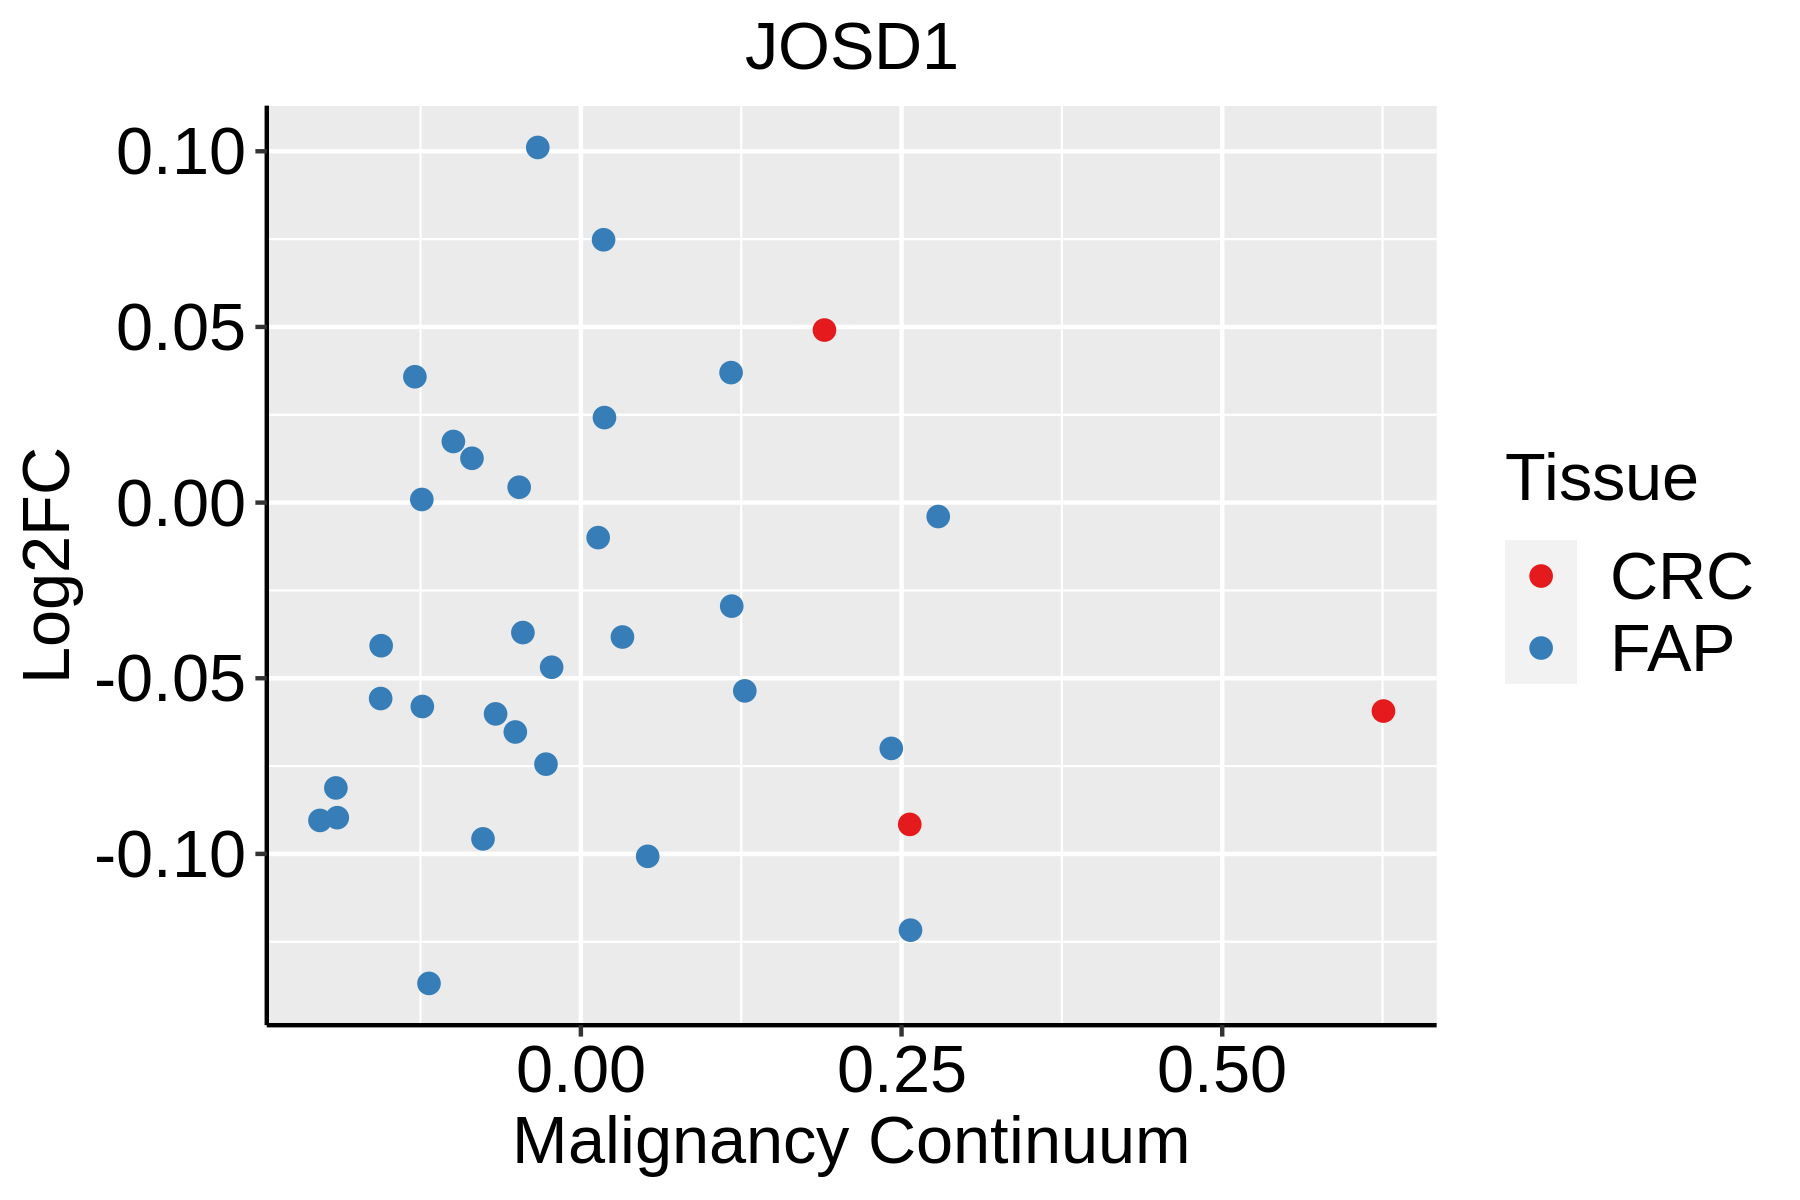 | FAP: Familial adenomatous polyposis |
| CRC: Colorectal cancer | ||
| Colorectum (HTA11) |  | AD: Adenomas |
| SER: Sessile serrated lesions | ||
| MSI-H: Microsatellite-high colorectal cancer | ||
| MSS: Microsatellite stable colorectal cancer | ||
| Esophagus |  | ESCC: Esophageal squamous cell carcinoma |
| HGIN: High-grade intraepithelial neoplasias | ||
| LGIN: Low-grade intraepithelial neoplasias | ||
| Liver | 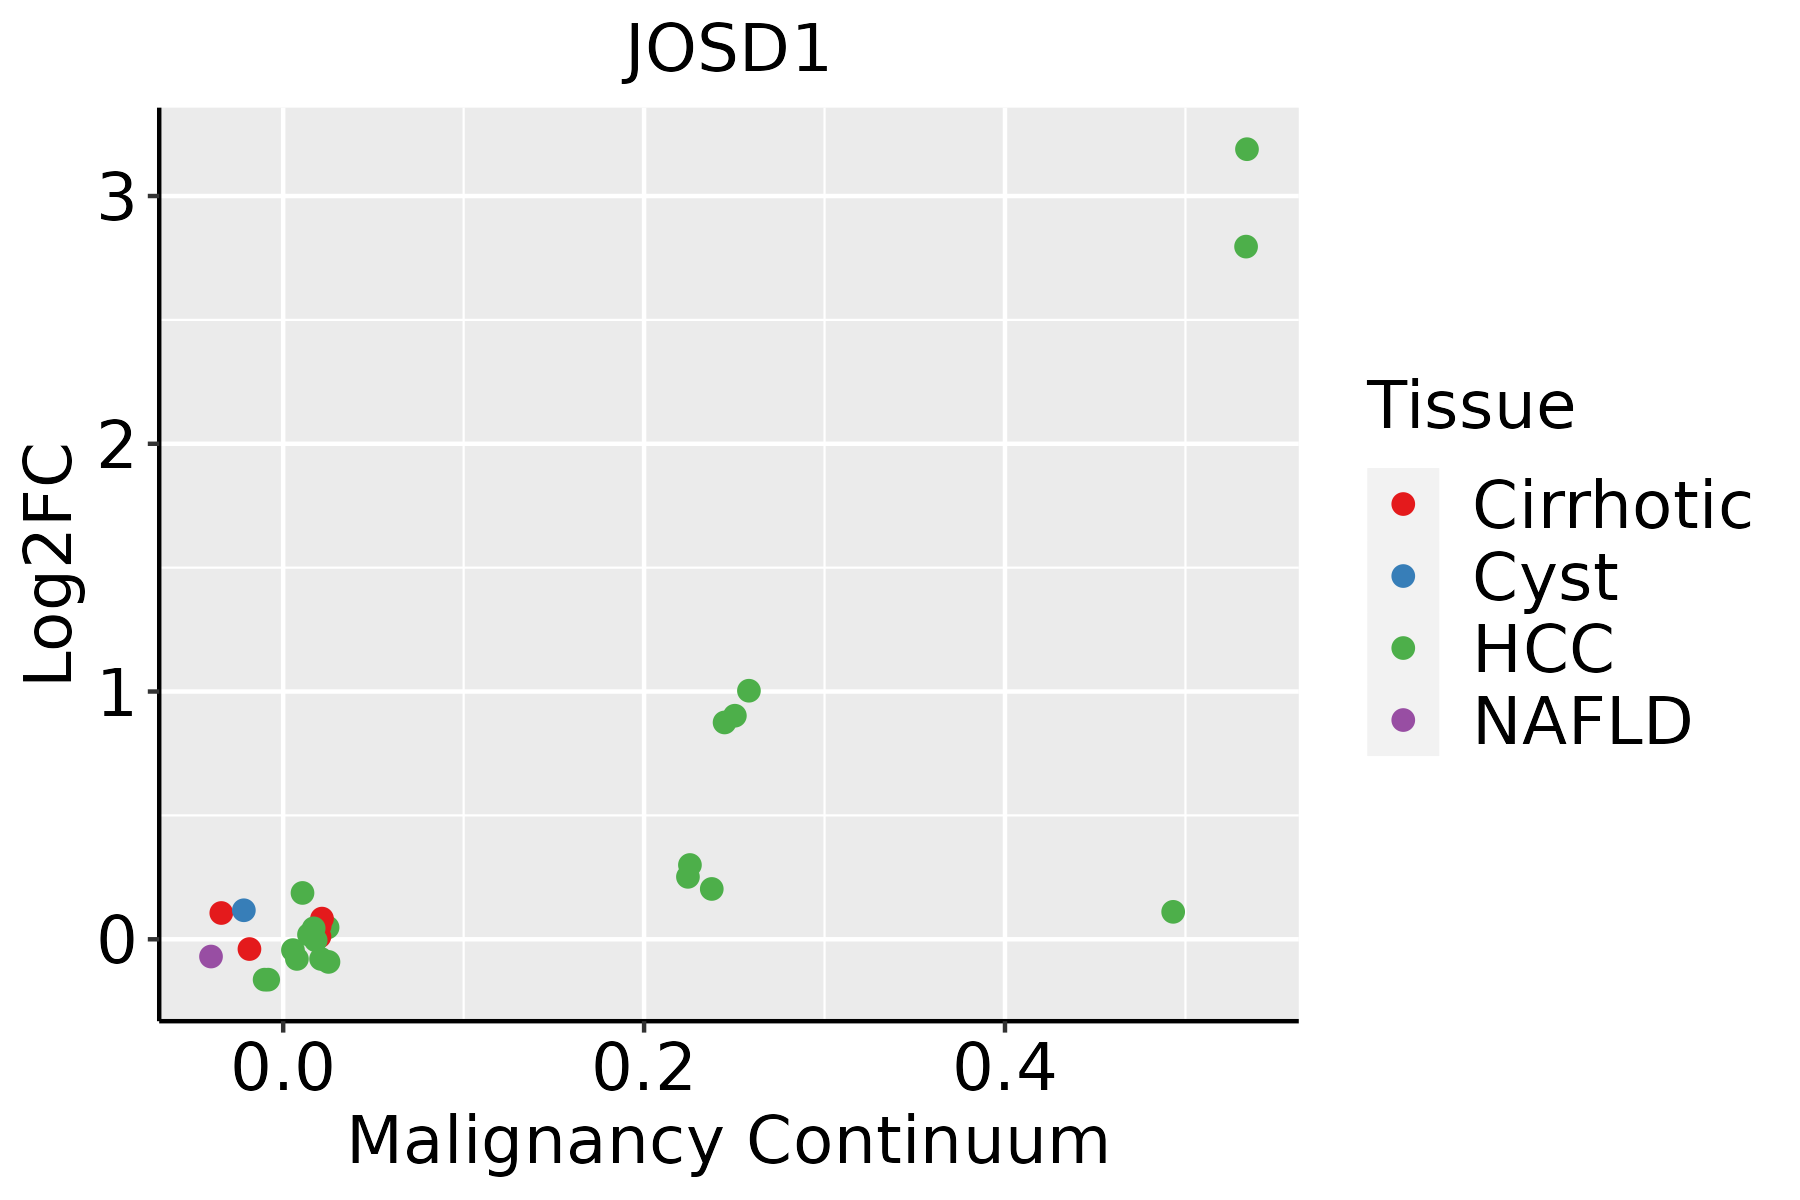 | HCC: Hepatocellular carcinoma |
| NAFLD: Non-alcoholic fatty liver disease | ||
| Oral Cavity | 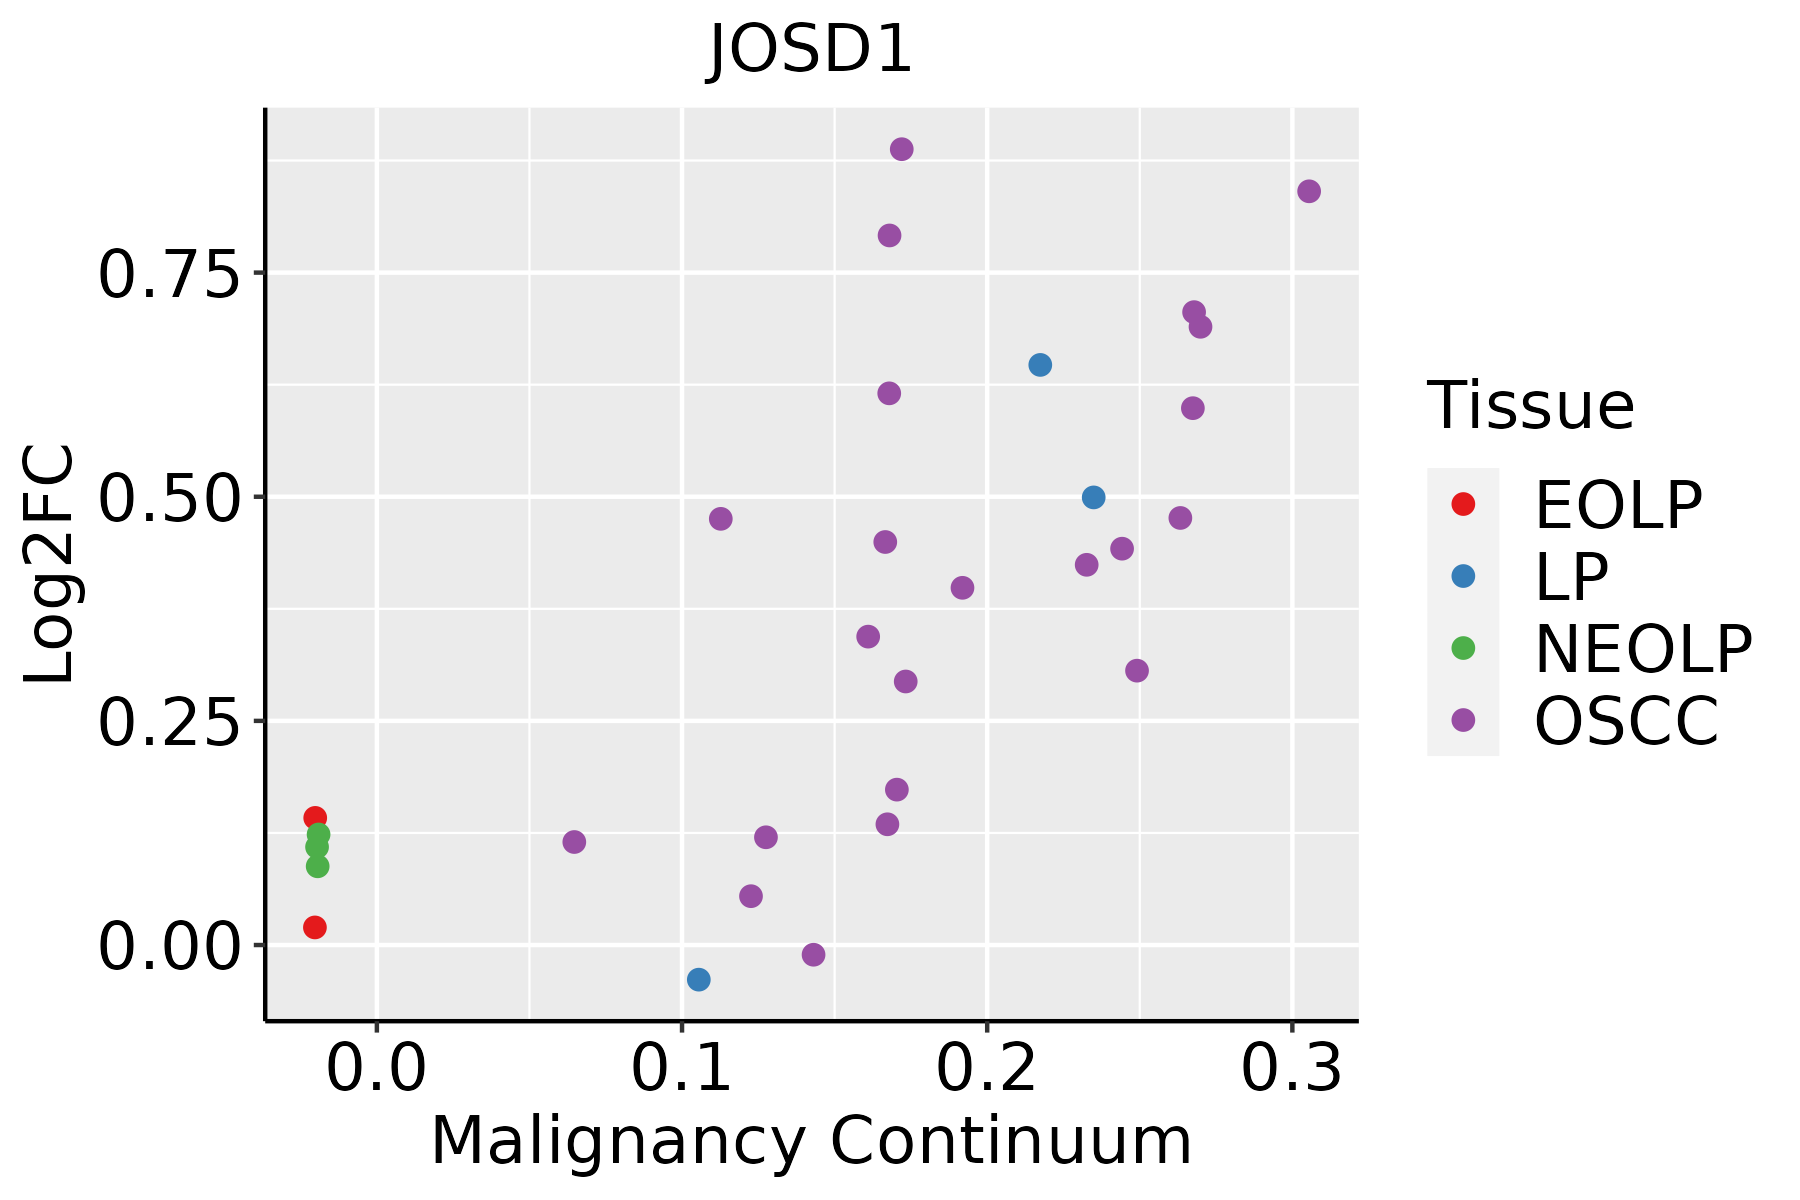 | EOLP: Erosive Oral lichen planus |
| LP: leukoplakia | ||
| NEOLP: Non-erosive oral lichen planus | ||
| OSCC: Oral squamous cell carcinoma | ||
| Skin | 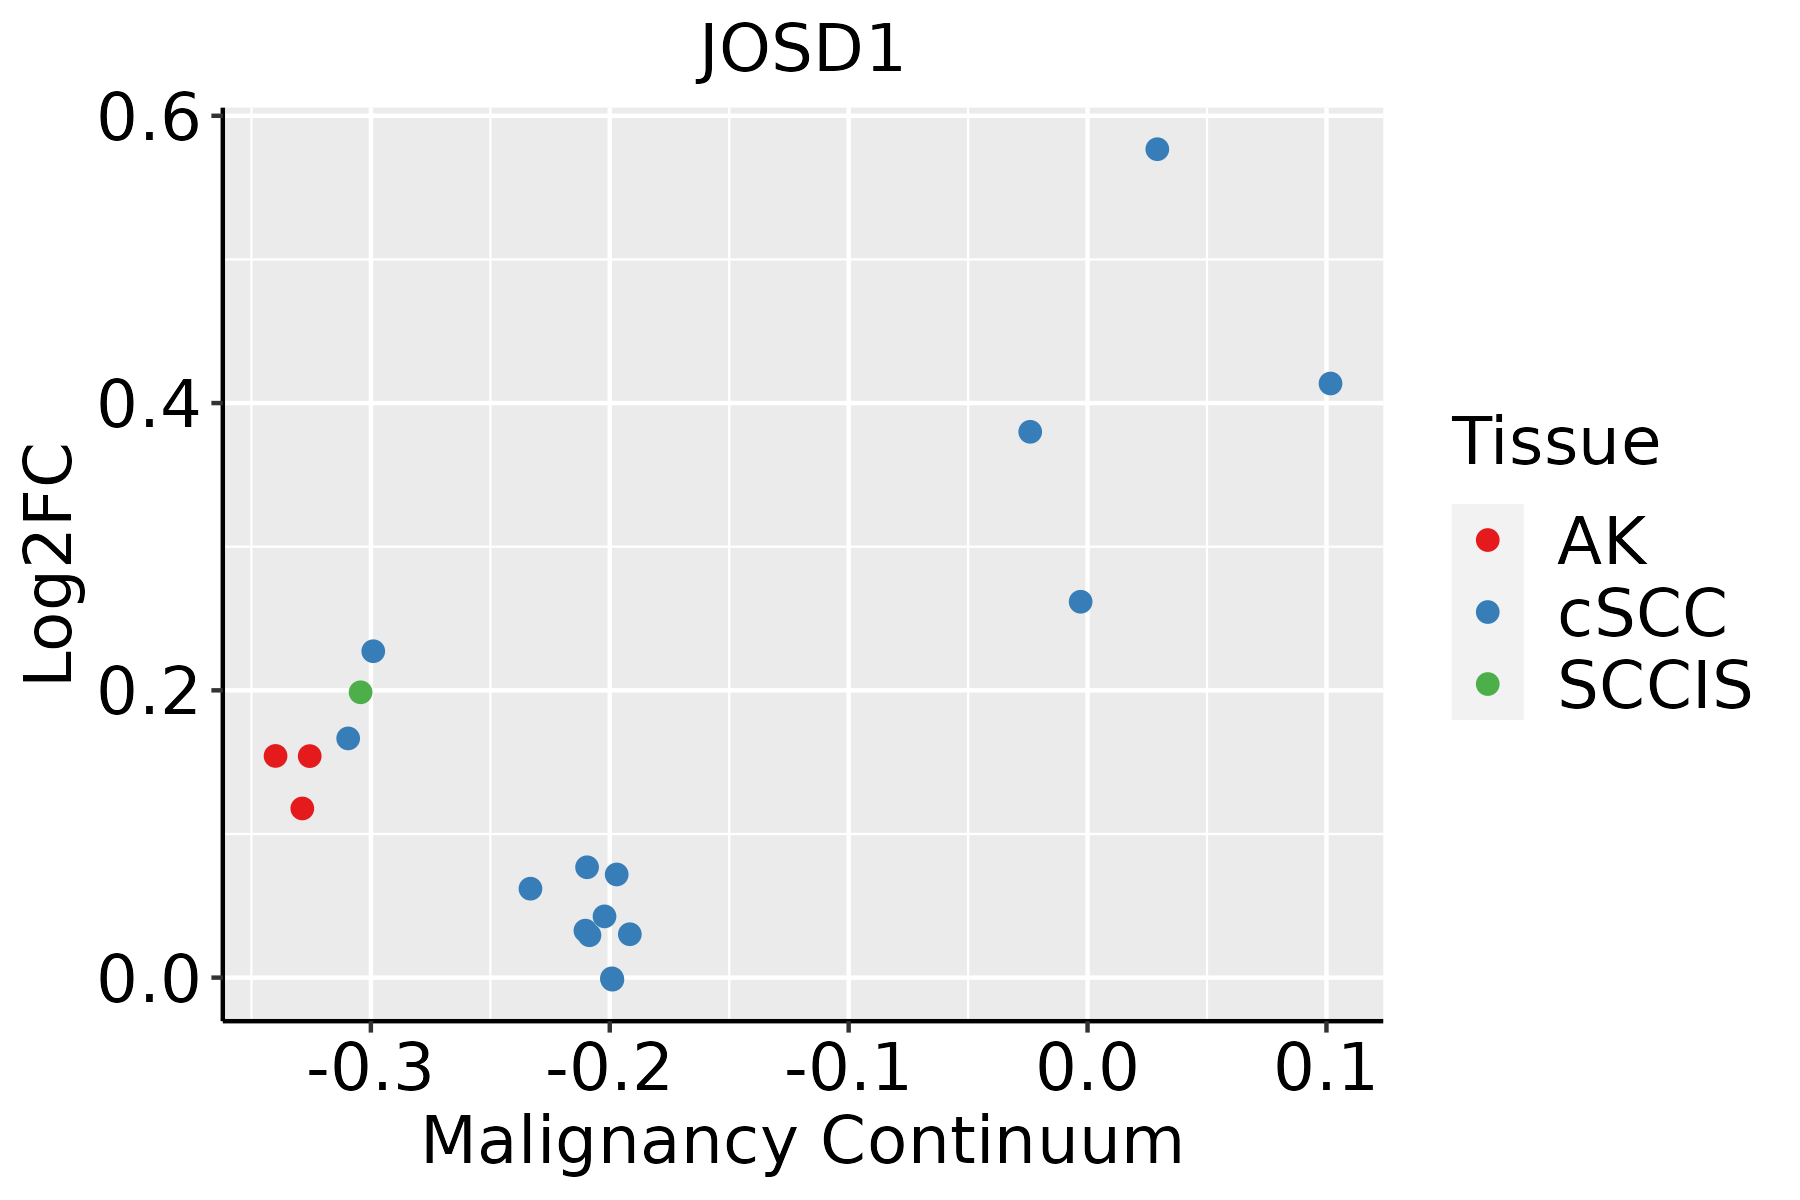 | AK: Actinic keratosis |
| cSCC: Cutaneous squamous cell carcinoma | ||
| SCCIS:squamous cell carcinoma in situ | ||
| Thyroid |  | ATC: Anaplastic thyroid cancer |
| HT: Hashimoto's thyroiditis | ||
| PTC: Papillary thyroid cancer |
| ∗log2FC in expression of this searched gene in stem-like cells from each diseased tissue sample relative to stem-like cells in normal samples in each tissue plotted against the malignancy continuum. Samples are colored based on if they are from different disease stage. |
Top |
Malignant transformation related pathway analysis |
| Find out the enriched GO biological processes and KEGG pathways involved in transition from healthy to precancer to cancer |
| Tissue | Disease Stage | Enriched GO biological Processes |
| Colorectum | AD |  |
| Colorectum | SER |  |
| Colorectum | MSS |  |
| Colorectum | MSI-H |  |
| Colorectum | FAP |  |
| ∗Top 15 enriched GO BP terms are showed in the bar plot of each disease state in each tissue. Each row represents a significant GO biological process which is colored according to the -log10(p.adjust). |
| Page: 1 2 3 4 5 6 7 8 9 |
| GO ID | Tissue | Disease Stage | Description | Gene Ratio | Bg Ratio | pvalue | p.adjust | Count |
| GO:007064612 | Esophagus | ESCC | protein modification by small protein removal | 95/8552 | 157/18723 | 1.25e-04 | 8.56e-04 | 95 |
| GO:00165793 | Esophagus | ESCC | protein deubiquitination | 79/8552 | 139/18723 | 5.23e-03 | 1.97e-02 | 79 |
| GO:00706461 | Liver | HCC | protein modification by small protein removal | 91/7958 | 157/18723 | 6.50e-05 | 5.92e-04 | 91 |
| GO:00165791 | Liver | HCC | protein deubiquitination | 78/7958 | 139/18723 | 8.13e-04 | 4.87e-03 | 78 |
| GO:00706462 | Oral cavity | OSCC | protein modification by small protein removal | 77/7305 | 157/18723 | 6.55e-03 | 2.43e-02 | 77 |
| GO:00706464 | Skin | cSCC | protein modification by small protein removal | 55/4864 | 157/18723 | 7.29e-03 | 3.46e-02 | 55 |
| GO:00706465 | Thyroid | PTC | protein modification by small protein removal | 71/5968 | 157/18723 | 3.03e-04 | 2.12e-03 | 71 |
| GO:00165794 | Thyroid | PTC | protein deubiquitination | 59/5968 | 139/18723 | 5.50e-03 | 2.50e-02 | 59 |
| GO:007064613 | Thyroid | ATC | protein modification by small protein removal | 71/6293 | 157/18723 | 1.59e-03 | 7.99e-03 | 71 |
| Page: 1 |
| Pathway ID | Tissue | Disease Stage | Description | Gene Ratio | Bg Ratio | pvalue | p.adjust | qvalue | Count |
| Page: 1 |
Top |
Cell-cell communication analysis |
| Identification of potential cell-cell interactions between two cell types and their ligand-receptor pairs for different disease states |
| Ligand | Receptor | LRpair | Pathway | Tissue | Disease Stage |
| Page: 1 |
Top |
Single-cell gene regulatory network inference analysis |
| Find out the significant the regulons (TFs) and the target genes of each regulon across cell types for different disease states |
| TF | Cell Type | Tissue | Disease Stage | Target Gene | RSS | Regulon Activity |
| ∗The dot plots of a searched regulon are shown for all cell subpopulations in each disease state of each tissue based on the regulon specific score inferred using pySCENIC and by calculating the average expression. |
| Page: 1 |
Top |
Somatic mutation of malignant transformation related genes |
| Annotation of somatic variants for genes involved in malignant transformation |
| Hugo Symbol | Variant Class | Variant Classification | dbSNP RS | HGVSc | HGVSp | HGVSp Short | SWISSPROT | BIOTYPE | SIFT | PolyPhen | Tumor Sample Barcode | Tissue | Histology | Sex | Age | Stage | Therapy Types | Drugs | Outcome |
| JOSD1 | insertion | Nonsense_Mutation | novel | c.512_513insCATATATATATAAAGACAGGGTTTCACTGTGTTGCCTAGGCTG | p.Lys171AsnfsTer5 | p.K171Nfs*5 | Q15040 | protein_coding | TCGA-B6-A0I8-01 | Breast | breast invasive carcinoma | Female | <65 | I/II | Unknown | Unknown | PD | ||
| JOSD1 | insertion | Frame_Shift_Ins | novel | c.511_512insGAAGCCAAAGAGCAGTTTTCCCAGTTCAC | p.Lys171ArgfsTer13 | p.K171Rfs*13 | Q15040 | protein_coding | TCGA-BH-A0HQ-01 | Breast | breast invasive carcinoma | Female | <65 | I/II | Hormone Therapy | arimidex | SD | ||
| JOSD1 | SNV | Missense_Mutation | c.278N>A | p.Thr93Asn | p.T93N | Q15040 | protein_coding | tolerated(0.47) | possibly_damaging(0.639) | TCGA-EK-A2PM-01 | Cervix | cervical & endocervical cancer | Female | >=65 | I/II | Unknown | Unknown | SD | |
| JOSD1 | SNV | Missense_Mutation | c.64N>A | p.Ala22Thr | p.A22T | Q15040 | protein_coding | tolerated(0.45) | benign(0) | TCGA-A6-2686-01 | Colorectum | colon adenocarcinoma | Female | >=65 | I/II | Unknown | Unknown | SD | |
| JOSD1 | SNV | Missense_Mutation | rs756017262 | c.343G>A | p.Val115Ile | p.V115I | Q15040 | protein_coding | tolerated(1) | benign(0.085) | TCGA-A6-6781-01 | Colorectum | colon adenocarcinoma | Male | <65 | III/IV | Chemotherapy | oxaliplatin | SD |
| JOSD1 | SNV | Missense_Mutation | c.326N>C | p.Val109Ala | p.V109A | Q15040 | protein_coding | tolerated(0.77) | benign(0) | TCGA-AA-3510-01 | Colorectum | colon adenocarcinoma | Male | >=65 | I/II | Unknown | Unknown | SD | |
| JOSD1 | SNV | Missense_Mutation | c.573G>T | p.Glu191Asp | p.E191D | Q15040 | protein_coding | tolerated(0.16) | benign(0.007) | TCGA-AA-A01R-01 | Colorectum | colon adenocarcinoma | Male | <65 | III/IV | Chemotherapy | 5-fluorouracil | PD | |
| JOSD1 | SNV | Missense_Mutation | novel | c.314N>A | p.Arg105Lys | p.R105K | Q15040 | protein_coding | tolerated(0.6) | benign(0.23) | TCGA-A5-A0G1-01 | Endometrium | uterine corpus endometrioid carcinoma | Female | >=65 | I/II | Unknown | Unknown | SD |
| JOSD1 | SNV | Missense_Mutation | novel | c.68C>T | p.Pro23Leu | p.P23L | Q15040 | protein_coding | deleterious(0) | benign(0.039) | TCGA-A5-A0G2-01 | Endometrium | uterine corpus endometrioid carcinoma | Female | <65 | III/IV | Unknown | Unknown | SD |
| JOSD1 | SNV | Missense_Mutation | c.403C>T | p.Leu135Phe | p.L135F | Q15040 | protein_coding | tolerated(0.15) | probably_damaging(0.979) | TCGA-AP-A0LM-01 | Endometrium | uterine corpus endometrioid carcinoma | Female | <65 | III/IV | Chemotherapy | cisplatin | SD |
| Page: 1 2 |
Top |
Related drugs of malignant transformation related genes |
| Identification of chemicals and drugs interact with genes involved in malignant transfromation |
| (DGIdb 4.0) |
| Entrez ID | Symbol | Category | Interaction Types | Drug Claim Name | Drug Name | PMIDs |
| Page: 1 |

Copyright 2023-Present -The University of Texas Health Science Center at Houston |