Schematic overview of the cellular and molecular mechanisms involved in the cancer progression, including the proposed cellular and molecular mechanisms in cancer cells trajectory. AT1: alveolar type 1 cells; AT2: alveolar type 2 cells; AAH: atypical adenomatous hyperplasia; AIS: adenocarcinoma in situ; MIA: minimally invasive adenocarcinoma; IA: invasive adenocarcinoma; EMT: epithelial-mesenchymal transition

Home

Download

Statistics

Help

Contact

Center for Computational Systems Medicine
leaf

Gene summary

leaf

Malignant transformation analysis

leaf

Malignant transformation related pathway analysis

leaf

Cell-cell communication analysis

leaf

Single-cell gene regulatory network inference analysis

leaf

Somatic mutation of malignant transformation related genes

leaf

Related drugs of malignant transformation related genes

Gene: JMY

Gene summary for JMY

check button Gene summary.

Gene informationSpeciesHuman
Gene symbol

JMY

Gene ID

133746

Gene namejunction mediating and regulatory protein, p53 cofactor
Gene AliasWHAMM2
Cytomap5q14.1
Gene Typeprotein-coding
GO ID

GO:0006139

UniProtAcc

Q8N9B5


Top

Malignant transformation analysis

check button Identification of the aberrant gene expression in precancerous and cancerous lesions by comparing the gene expression of stem-like cells in diseased tissues with normal stem cells
check button Malignant transformation involving gene list.
Entrez IDSymbolReplicatesSpeciesOrganTissueAdj P-valueLog2FCMalignancy
133746JMYHTA11_347_2000001011HumanColorectumAD3.60e-041.67e-01-0.1954
133746JMYHTA11_1391_2000001011HumanColorectumAD4.63e-032.76e-01-0.059
133746JMYHTA11_866_3004761011HumanColorectumAD1.25e-021.17e-010.096
133746JMYHTA11_6818_2000001021HumanColorectumAD1.33e-022.78e-010.0588
133746JMYHTA11_99999965062_69753HumanColorectumMSI-H3.44e-026.26e-010.3487
133746JMYHTA11_99999965104_69814HumanColorectumMSS4.07e-085.98e-010.281
133746JMYHCC1_MengHumanLiverHCC2.19e-11-3.21e-020.0246
133746JMYHCC2HumanLiverHCC3.71e-082.95e+000.5341
133746JMYPt13.bHumanLiverHCC1.89e-061.03e-010.0251
133746JMYS015HumanLiverHCC7.39e-063.54e-010.2375
133746JMYS016HumanLiverHCC1.21e-073.07e-010.2243
133746JMYS028HumanLiverHCC1.85e-032.77e-010.2503
133746JMYS029HumanLiverHCC8.07e-105.41e-010.2581
133746JMYGSM5252137_BPH556PrGA2_FcolHumanProstateBPH1.45e-022.13e-01-0.23
133746JMY048752_1579-all-cellsHumanProstateBPH1.19e-164.64e-010.1008
133746JMY052095_1628-all-cellsHumanProstateBPH1.04e-062.52e-010.1032
133746JMY052097_1595-all-cellsHumanProstateBPH3.64e-215.17e-010.0972
133746JMY052099_1652-all-cellsHumanProstateBPH6.92e-103.26e-010.1038
133746JMYDong_P1HumanProstateTumor7.85e-094.42e-020.035
133746JMYDong_P3HumanProstateTumor3.58e-067.81e-020.0278
Page: 1 2 

check button Transcriptomic changes along malignancy continuum.
TissueExpression DynamicsAbbreviation
Colorectum (GSE201348)The image shows the transcriptomic changes along malignancy continuum.log2FC in expression of this searched gene in stem-like cells from each diseased tissue sample relative to stem-like cells in normal samples in each tissue plotted against the malignancy continuum. Samples are colored based on if they are from different disease stage.FAP: Familial adenomatous polyposis
CRC: Colorectal cancer
Colorectum (HTA11)The image shows the transcriptomic changes along malignancy continuum.log2FC in expression of this searched gene in stem-like cells from each diseased tissue sample relative to stem-like cells in normal samples in each tissue plotted against the malignancy continuum. Samples are colored based on if they are from different disease stage.AD: Adenomas
SER: Sessile serrated lesions
MSI-H: Microsatellite-high colorectal cancer
MSS: Microsatellite stable colorectal cancer
LiverThe image shows the transcriptomic changes along malignancy continuum.log2FC in expression of this searched gene in stem-like cells from each diseased tissue sample relative to stem-like cells in normal samples in each tissue plotted against the malignancy continuum. Samples are colored based on if they are from different disease stage.
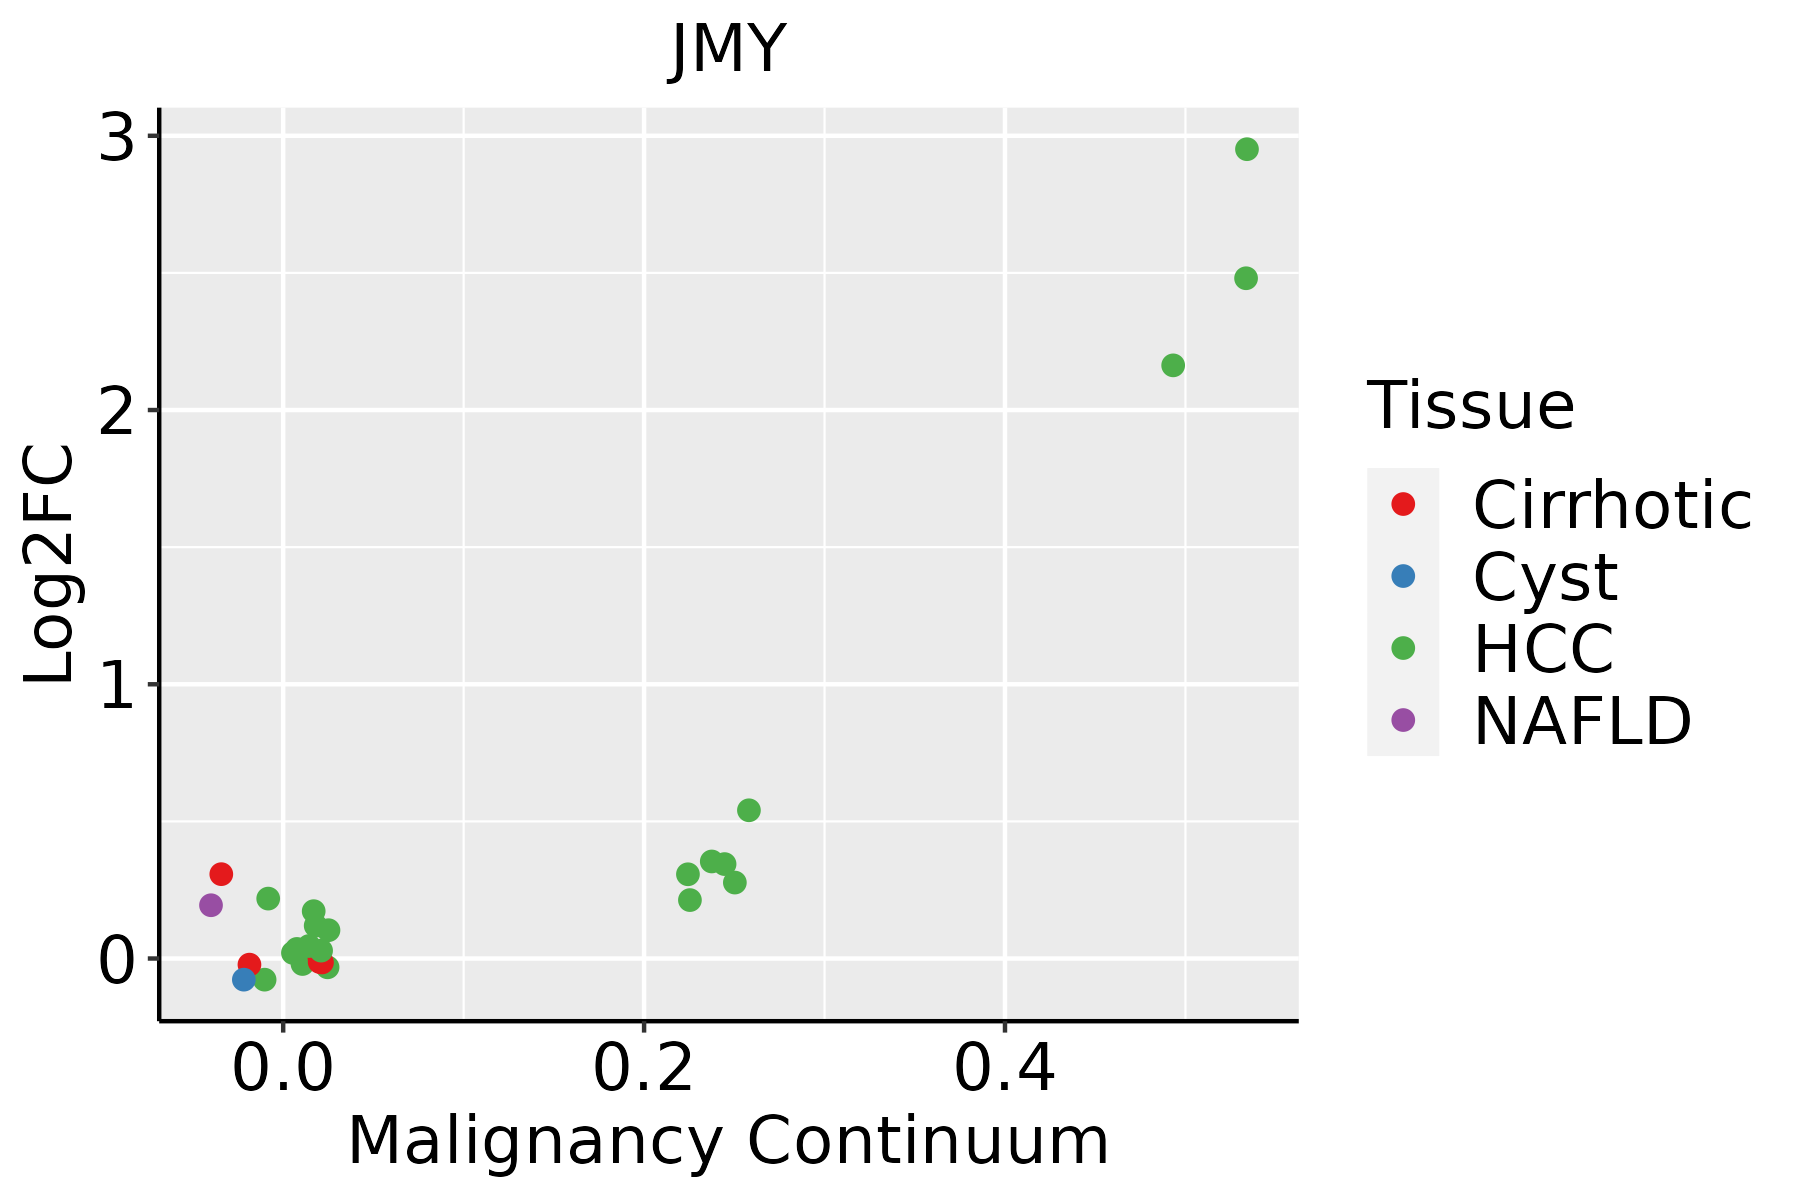
HCC: Hepatocellular carcinoma
NAFLD: Non-alcoholic fatty liver disease
ProstateThe image shows the transcriptomic changes along malignancy continuum.log2FC in expression of this searched gene in stem-like cells from each diseased tissue sample relative to stem-like cells in normal samples in each tissue plotted against the malignancy continuum. Samples are colored based on if they are from different disease stage.BPH: Benign Prostatic Hyperplasia
ThyroidThe image shows the transcriptomic changes along malignancy continuum.log2FC in expression of this searched gene in stem-like cells from each diseased tissue sample relative to stem-like cells in normal samples in each tissue plotted against the malignancy continuum. Samples are colored based on if they are from different disease stage.
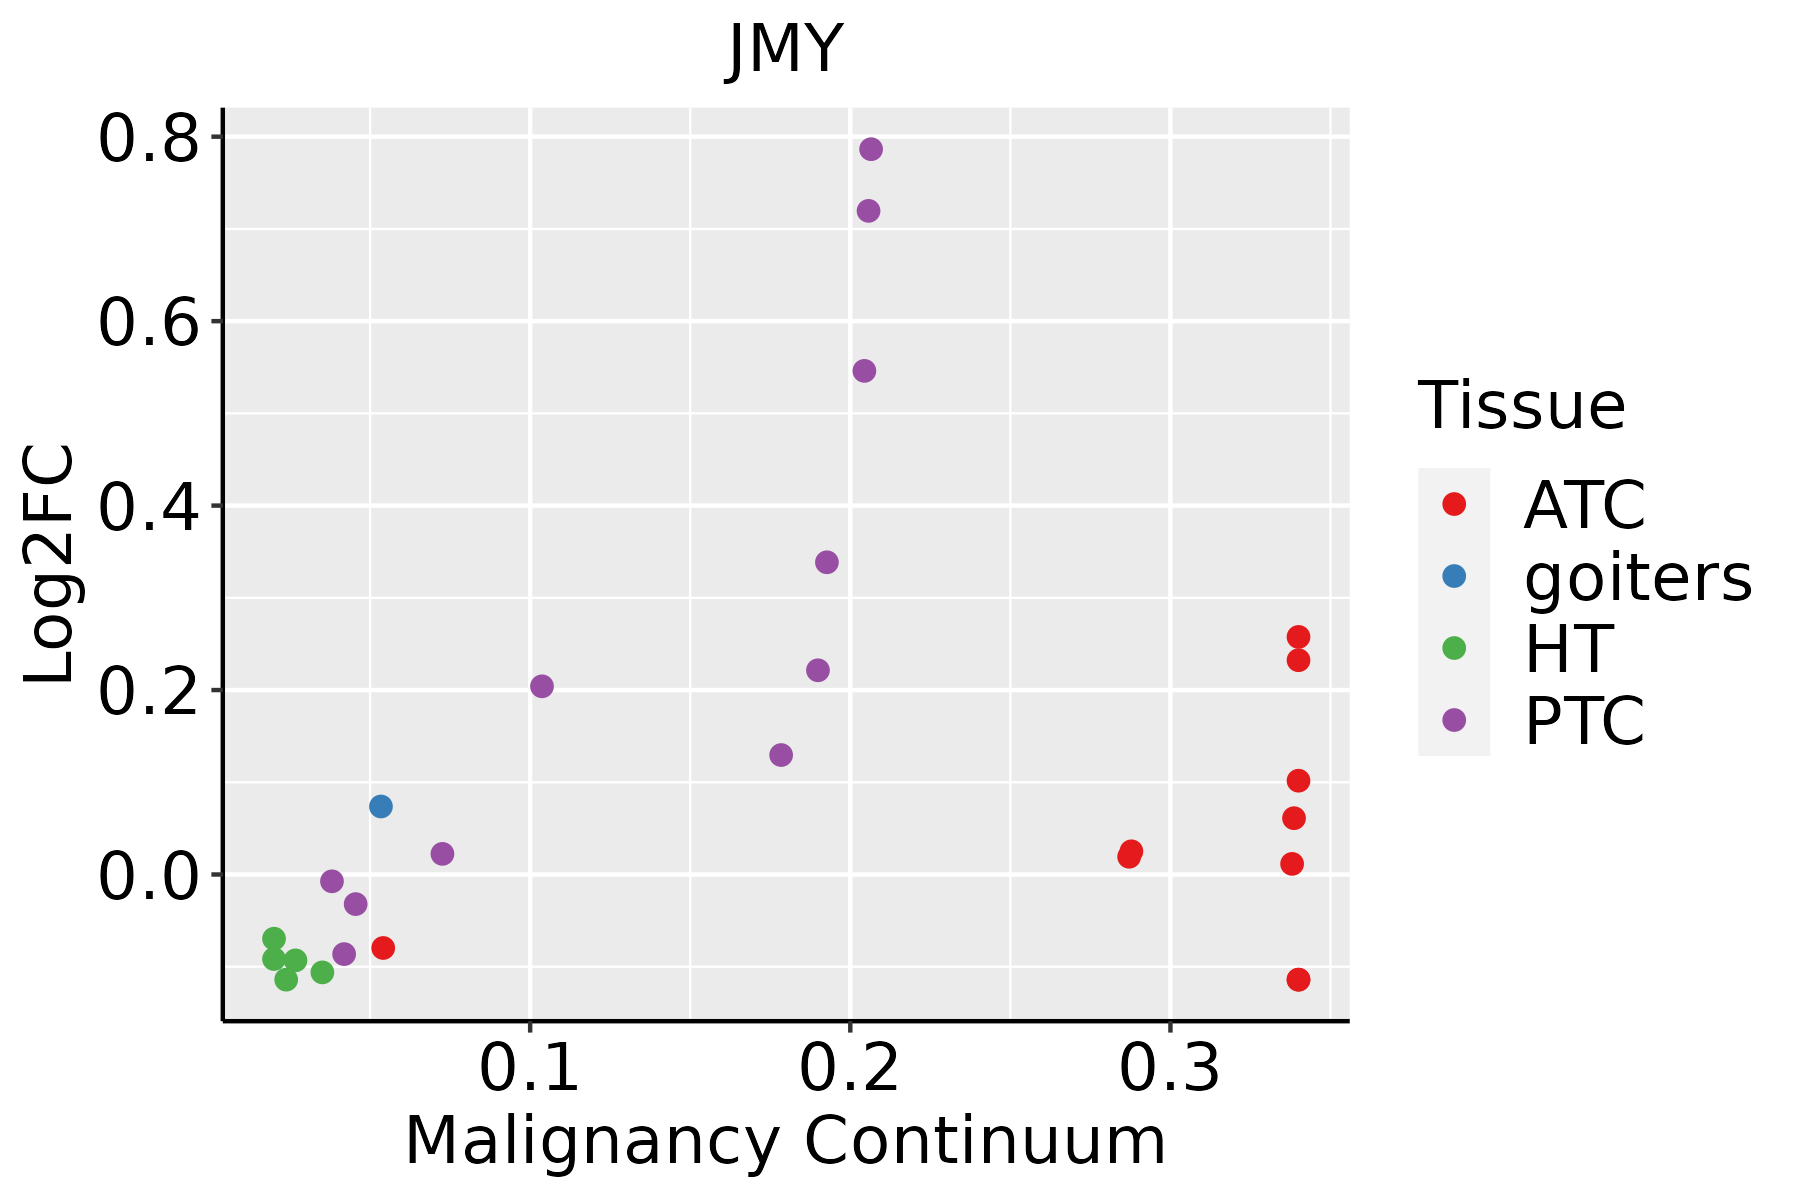
ATC: Anaplastic thyroid cancer
HT: Hashimoto's thyroiditis
PTC: Papillary thyroid cancer
∗log2FC in expression of this searched gene in stem-like cells from each diseased tissue sample relative to stem-like cells in normal samples in each tissue plotted against the malignancy continuum. Samples are colored based on if they are from different disease stage.

Top

Malignant transformation related pathway analysis

check buttonFind out the enriched GO biological processes and KEGG pathways involved in transition from healthy to precancer to cancer
check button Figure of enriched GO biological processes.
TissueDisease StageEnriched GO biological Processes
ColorectumADGO analysis - Figure of enriched GO biological processes: Top 15 enriched GO BP terms are showed in the bar plot of each disease state in each tissue. Each row represents a significant GO biological process which is colored according to the -log10(p.adjust).
ColorectumSERGO analysis - Figure of enriched GO biological processes: Top 15 enriched GO BP terms are showed in the bar plot of each disease state in each tissue. Each row represents a significant GO biological process which is colored according to the -log10(p.adjust).
ColorectumMSSGO analysis - Figure of enriched GO biological processes: Top 15 enriched GO BP terms are showed in the bar plot of each disease state in each tissue. Each row represents a significant GO biological process which is colored according to the -log10(p.adjust).
ColorectumMSI-HGO analysis - Figure of enriched GO biological processes: Top 15 enriched GO BP terms are showed in the bar plot of each disease state in each tissue. Each row represents a significant GO biological process which is colored according to the -log10(p.adjust).
ColorectumFAPGO analysis - Figure of enriched GO biological processes: Top 15 enriched GO BP terms are showed in the bar plot of each disease state in each tissue. Each row represents a significant GO biological process which is colored according to the -log10(p.adjust).
∗Top 15 enriched GO BP terms are showed in the bar plot of each disease state in each tissue. Each row represents a significant GO biological process which is colored according to the -log10(p.adjust).
Page: 1 2 3 4 5 6 7 8 9 

check button Enriched GO biological processes.
GO IDTissueDisease StageDescriptionGene RatioBg Ratiopvaluep.adjustCount
GO:0007015ColorectumADactin filament organization167/3918442/187231.65e-167.94e-14167
GO:0032535ColorectumADregulation of cellular component size142/3918383/187231.74e-133.41e-11142
GO:1902903ColorectumADregulation of supramolecular fiber organization139/3918383/187232.01e-123.19e-10139
GO:0032970ColorectumADregulation of actin filament-based process142/3918397/187234.05e-125.90e-10142
GO:0110053ColorectumADregulation of actin filament organization108/3918278/187235.02e-126.98e-10108
GO:0008154ColorectumADactin polymerization or depolymerization90/3918218/187236.14e-128.23e-1090
GO:0032271ColorectumADregulation of protein polymerization94/3918233/187231.01e-111.29e-0994
GO:0030041ColorectumADactin filament polymerization81/3918191/187231.35e-111.69e-0981
GO:0051258ColorectumADprotein polymerization112/3918297/187231.85e-112.27e-09112
GO:0043254ColorectumADregulation of protein-containing complex assembly148/3918428/187232.64e-113.18e-09148
GO:0008064ColorectumADregulation of actin polymerization or depolymerization79/3918188/187234.17e-114.74e-0979
GO:0030833ColorectumADregulation of actin filament polymerization74/3918172/187234.50e-115.03e-0974
GO:0030832ColorectumADregulation of actin filament length79/3918189/187235.71e-116.27e-0979
GO:1902905ColorectumADpositive regulation of supramolecular fiber organization85/3918209/187235.95e-116.33e-0985
GO:0097193ColorectumADintrinsic apoptotic signaling pathway108/3918288/187236.25e-116.41e-09108
GO:0032956ColorectumADregulation of actin cytoskeleton organization127/3918358/187231.03e-101.04e-08127
GO:0051495ColorectumADpositive regulation of cytoskeleton organization89/3918226/187231.61e-101.56e-0889
GO:0032273ColorectumADpositive regulation of protein polymerization62/3918138/187231.94e-101.76e-0862
GO:0031334ColorectumADpositive regulation of protein-containing complex assembly91/3918237/187234.78e-103.99e-0891
GO:0030838ColorectumADpositive regulation of actin filament polymerization48/391899/187239.21e-107.03e-0848
Page: 1 2 3 4 5 6 7 8 9 10 11 

check button Enriched KEGG pathways.
Pathway IDTissueDisease StageDescriptionGene RatioBg Ratiopvaluep.adjustqvalueCount
Page: 1 

Top

Cell-cell communication analysis

check buttonIdentification of potential cell-cell interactions between two cell types and their ligand-receptor pairs for different disease states
LigandReceptorLRpairPathwayTissueDisease Stage
Page: 1 

Top

Single-cell gene regulatory network inference analysis

check buttonFind out the significant the regulons (TFs) and the target genes of each regulon across cell types for different disease states
TFCell TypeTissueDisease StageTarget GeneRSSRegulon Activity
∗The dot plots of a searched regulon are shown for all cell subpopulations in each disease state of each tissue based on the regulon specific score inferred using pySCENIC and by calculating the average expression.
Page: 1 

Top

Somatic mutation of malignant transformation related genes

check buttonAnnotation of somatic variants for genes involved in malignant transformation
Hugo SymbolVariant ClassVariant ClassificationdbSNP RSHGVScHGVSpHGVSp ShortSWISSPROTBIOTYPESIFTPolyPhenTumor Sample BarcodeTissueHistologySexAgeStageTherapy TypesDrugsOutcome
JMYSNVMissense_Mutationrs759301275c.1190N>Ap.Arg397Glnp.R397QQ8N9B5protein_codingtolerated(0.21)benign(0.362)TCGA-AN-A046-01Breastbreast invasive carcinomaFemale>=65I/IIUnknownUnknownSD
JMYSNVMissense_Mutationnovelc.1647N>Tp.Glu549Aspp.E549DQ8N9B5protein_codingdeleterious(0.01)possibly_damaging(0.689)TCGA-AN-A046-01Breastbreast invasive carcinomaFemale>=65I/IIUnknownUnknownSD
JMYSNVMissense_Mutationc.2259G>Cp.Gln753Hisp.Q753HQ8N9B5protein_codingtolerated(0.14)benign(0.003)TCGA-AN-A0FW-01Breastbreast invasive carcinomaFemale>=65III/IVUnknownUnknownSD
JMYinsertionNonsense_Mutationnovelc.1854_1855insTGAAGTGGTATACTATGACACTTACGAAAGCATGGp.Lys619Terp.K619*Q8N9B5protein_codingTCGA-A7-A0CG-01Breastbreast invasive carcinomaFemale>=65I/IIUnknownUnknownSD
JMYSNVMissense_Mutationnovelc.2390C>Ap.Ser797Tyrp.S797YQ8N9B5protein_codingtolerated(0.07)possibly_damaging(0.66)TCGA-2W-A8YY-01Cervixcervical & endocervical cancerFemale<65I/IIChemotherapycisplatinCR
JMYSNVMissense_Mutationrs375111219c.133A>Cp.Thr45Prop.T45PQ8N9B5protein_codingdeleterious(0)probably_damaging(0.998)TCGA-DG-A2KM-01Cervixcervical & endocervical cancerFemale<65I/IIChemotherapycisplatinSD
JMYSNVMissense_Mutationrs531886847c.1565N>Ap.Arg522Glnp.R522QQ8N9B5protein_codingtolerated(0.36)benign(0.009)TCGA-IR-A3LB-01Cervixcervical & endocervical cancerFemale<65I/IIChemotherapycisplatinPD
JMYSNVMissense_Mutationc.2168N>Tp.Ser723Phep.S723FQ8N9B5protein_codingdeleterious(0)possibly_damaging(0.679)TCGA-IR-A3LH-01Cervixcervical & endocervical cancerFemale<65I/IIChemotherapycisplatinCR
JMYSNVMissense_Mutationrs375111219c.133N>Cp.Thr45Prop.T45PQ8N9B5protein_codingdeleterious(0)probably_damaging(0.998)TCGA-Q1-A5R2-01Cervixcervical & endocervical cancerFemale<65I/IIChemotherapycisplatinPR
JMYSNVMissense_Mutationrs375111219c.133N>Cp.Thr45Prop.T45PQ8N9B5protein_codingdeleterious(0)probably_damaging(0.998)TCGA-VS-A9UD-01Cervixcervical & endocervical cancerFemale>=65III/IVChemotherapycisplatinCR
Page: 1 2 3 4 5 6 7 8 9 

Top

Related drugs of malignant transformation related genes

check buttonIdentification of chemicals and drugs interact with genes involved in malignant transfromation
(DGIdb 4.0)
Entrez IDSymbolCategoryInteraction TypesDrug Claim NameDrug NamePMIDs
Page: 1