
|
|||||
|
 | |
| |
| |
| |
| |
| |
|
Gene: JMJD8 |
Gene summary for JMJD8 |
| Gene information | Species | Human | Gene symbol | JMJD8 | Gene ID | 339123 |
| Gene name | jumonji domain containing 8 | |
| Gene Alias | C16orf20 | |
| Cytomap | 16p13.3 | |
| Gene Type | protein-coding | GO ID | GO:0001525 | UniProtAcc | Q96S16 |
Top |
Malignant transformation analysis |
| Identification of the aberrant gene expression in precancerous and cancerous lesions by comparing the gene expression of stem-like cells in diseased tissues with normal stem cells |
| Entrez ID | Symbol | Replicates | Species | Organ | Tissue | Adj P-value | Log2FC | Malignancy |
| 339123 | JMJD8 | LZE7T | Human | Esophagus | ESCC | 3.31e-02 | 1.44e-01 | 0.0667 |
| 339123 | JMJD8 | LZE20T | Human | Esophagus | ESCC | 1.05e-03 | 1.35e-01 | 0.0662 |
| 339123 | JMJD8 | LZE24T | Human | Esophagus | ESCC | 2.17e-06 | 1.67e-01 | 0.0596 |
| 339123 | JMJD8 | LZE21T | Human | Esophagus | ESCC | 4.28e-02 | 2.48e-01 | 0.0655 |
| 339123 | JMJD8 | P1T-E | Human | Esophagus | ESCC | 9.24e-10 | 4.43e-01 | 0.0875 |
| 339123 | JMJD8 | P2T-E | Human | Esophagus | ESCC | 5.14e-50 | 9.22e-01 | 0.1177 |
| 339123 | JMJD8 | P4T-E | Human | Esophagus | ESCC | 1.72e-38 | 8.11e-01 | 0.1323 |
| 339123 | JMJD8 | P5T-E | Human | Esophagus | ESCC | 4.49e-22 | 3.97e-01 | 0.1327 |
| 339123 | JMJD8 | P8T-E | Human | Esophagus | ESCC | 9.14e-25 | 3.49e-01 | 0.0889 |
| 339123 | JMJD8 | P9T-E | Human | Esophagus | ESCC | 8.90e-15 | 2.87e-01 | 0.1131 |
| 339123 | JMJD8 | P10T-E | Human | Esophagus | ESCC | 6.94e-23 | 3.92e-01 | 0.116 |
| 339123 | JMJD8 | P11T-E | Human | Esophagus | ESCC | 6.89e-05 | 2.14e-01 | 0.1426 |
| 339123 | JMJD8 | P12T-E | Human | Esophagus | ESCC | 2.28e-22 | 3.19e-01 | 0.1122 |
| 339123 | JMJD8 | P15T-E | Human | Esophagus | ESCC | 3.90e-21 | 3.83e-01 | 0.1149 |
| 339123 | JMJD8 | P16T-E | Human | Esophagus | ESCC | 3.43e-21 | 2.87e-01 | 0.1153 |
| 339123 | JMJD8 | P17T-E | Human | Esophagus | ESCC | 1.25e-13 | 4.70e-01 | 0.1278 |
| 339123 | JMJD8 | P19T-E | Human | Esophagus | ESCC | 5.10e-04 | 3.24e-01 | 0.1662 |
| 339123 | JMJD8 | P20T-E | Human | Esophagus | ESCC | 7.63e-14 | 1.99e-01 | 0.1124 |
| 339123 | JMJD8 | P21T-E | Human | Esophagus | ESCC | 6.69e-26 | 4.55e-01 | 0.1617 |
| 339123 | JMJD8 | P22T-E | Human | Esophagus | ESCC | 3.22e-12 | 2.24e-01 | 0.1236 |
| Page: 1 2 3 4 5 6 |
| Tissue | Expression Dynamics | Abbreviation |
| Esophagus |  | ESCC: Esophageal squamous cell carcinoma |
| HGIN: High-grade intraepithelial neoplasias | ||
| LGIN: Low-grade intraepithelial neoplasias | ||
| Liver | 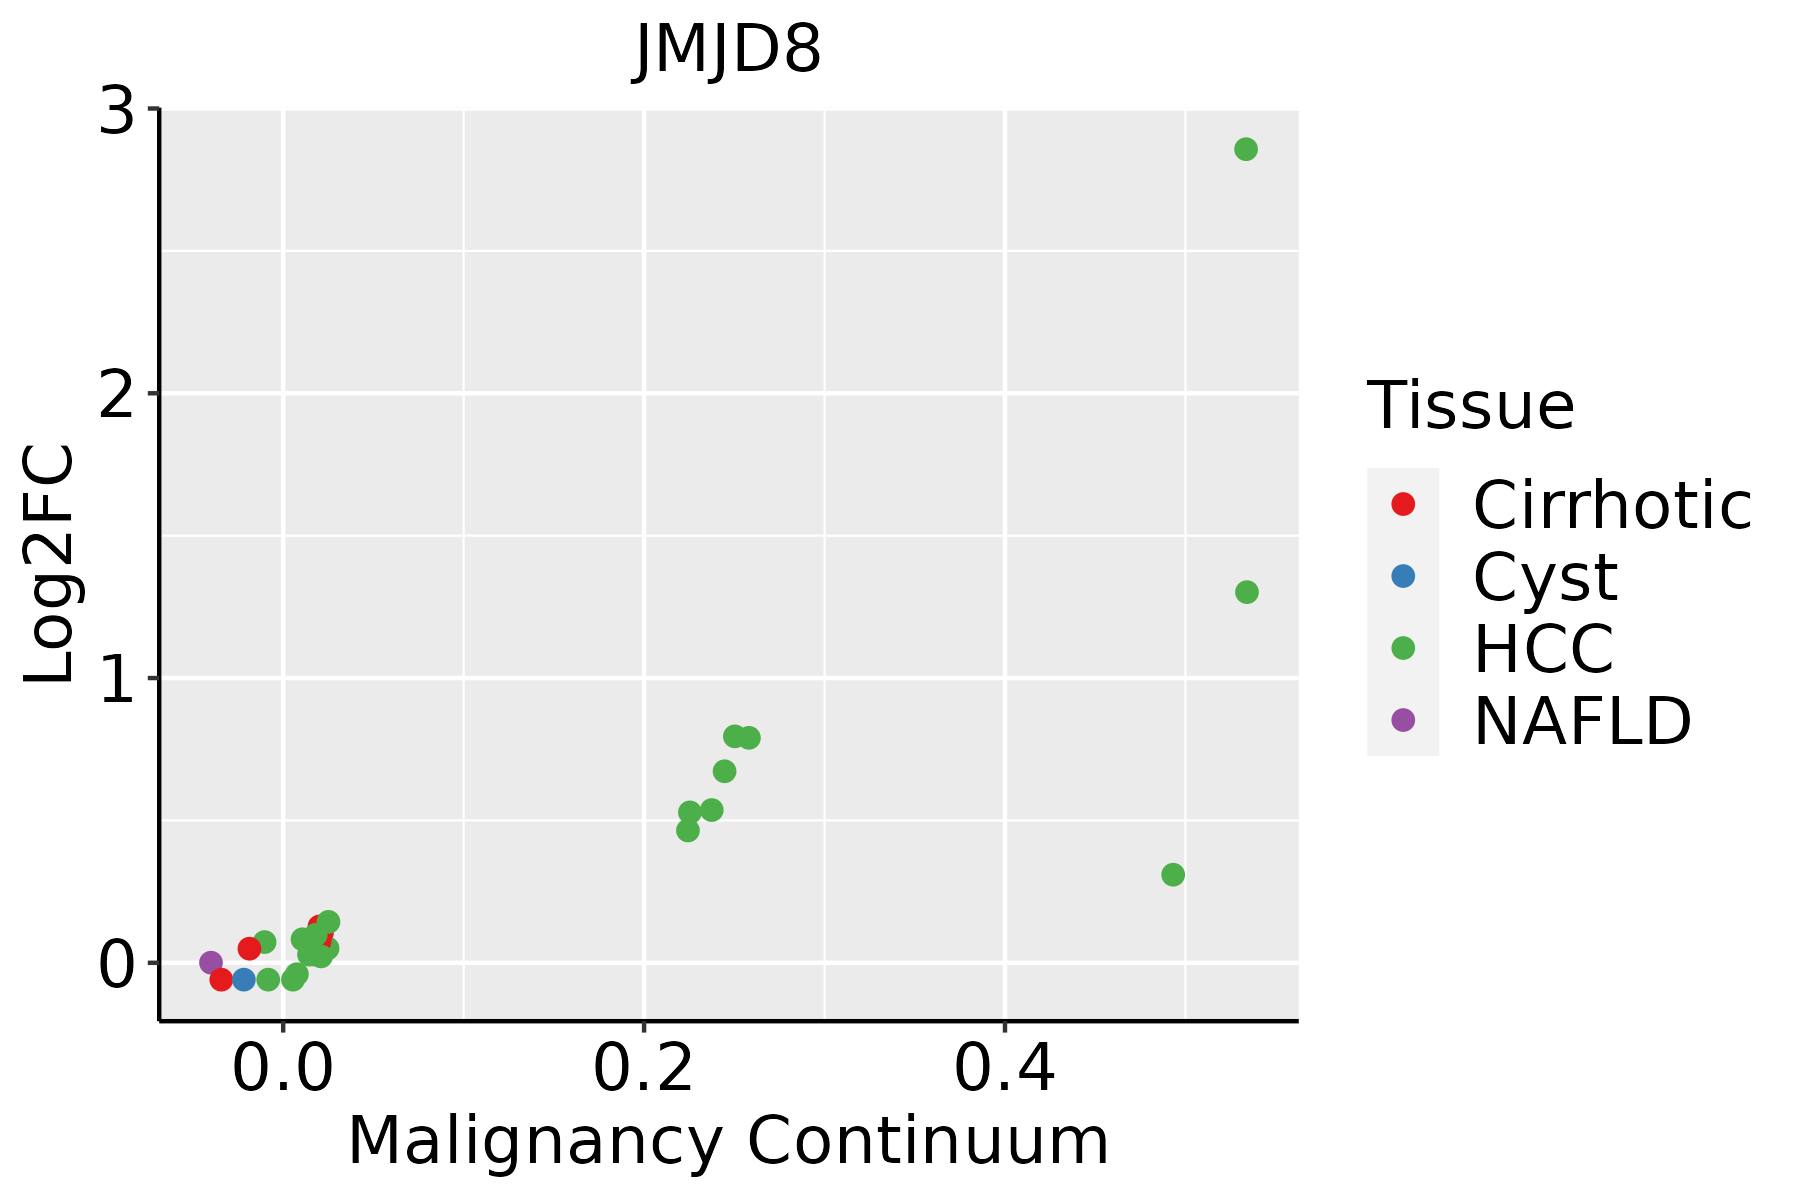 | HCC: Hepatocellular carcinoma |
| NAFLD: Non-alcoholic fatty liver disease | ||
| Oral Cavity |  | EOLP: Erosive Oral lichen planus |
| LP: leukoplakia | ||
| NEOLP: Non-erosive oral lichen planus | ||
| OSCC: Oral squamous cell carcinoma | ||
| Skin |  | AK: Actinic keratosis |
| cSCC: Cutaneous squamous cell carcinoma | ||
| SCCIS:squamous cell carcinoma in situ | ||
| Thyroid | 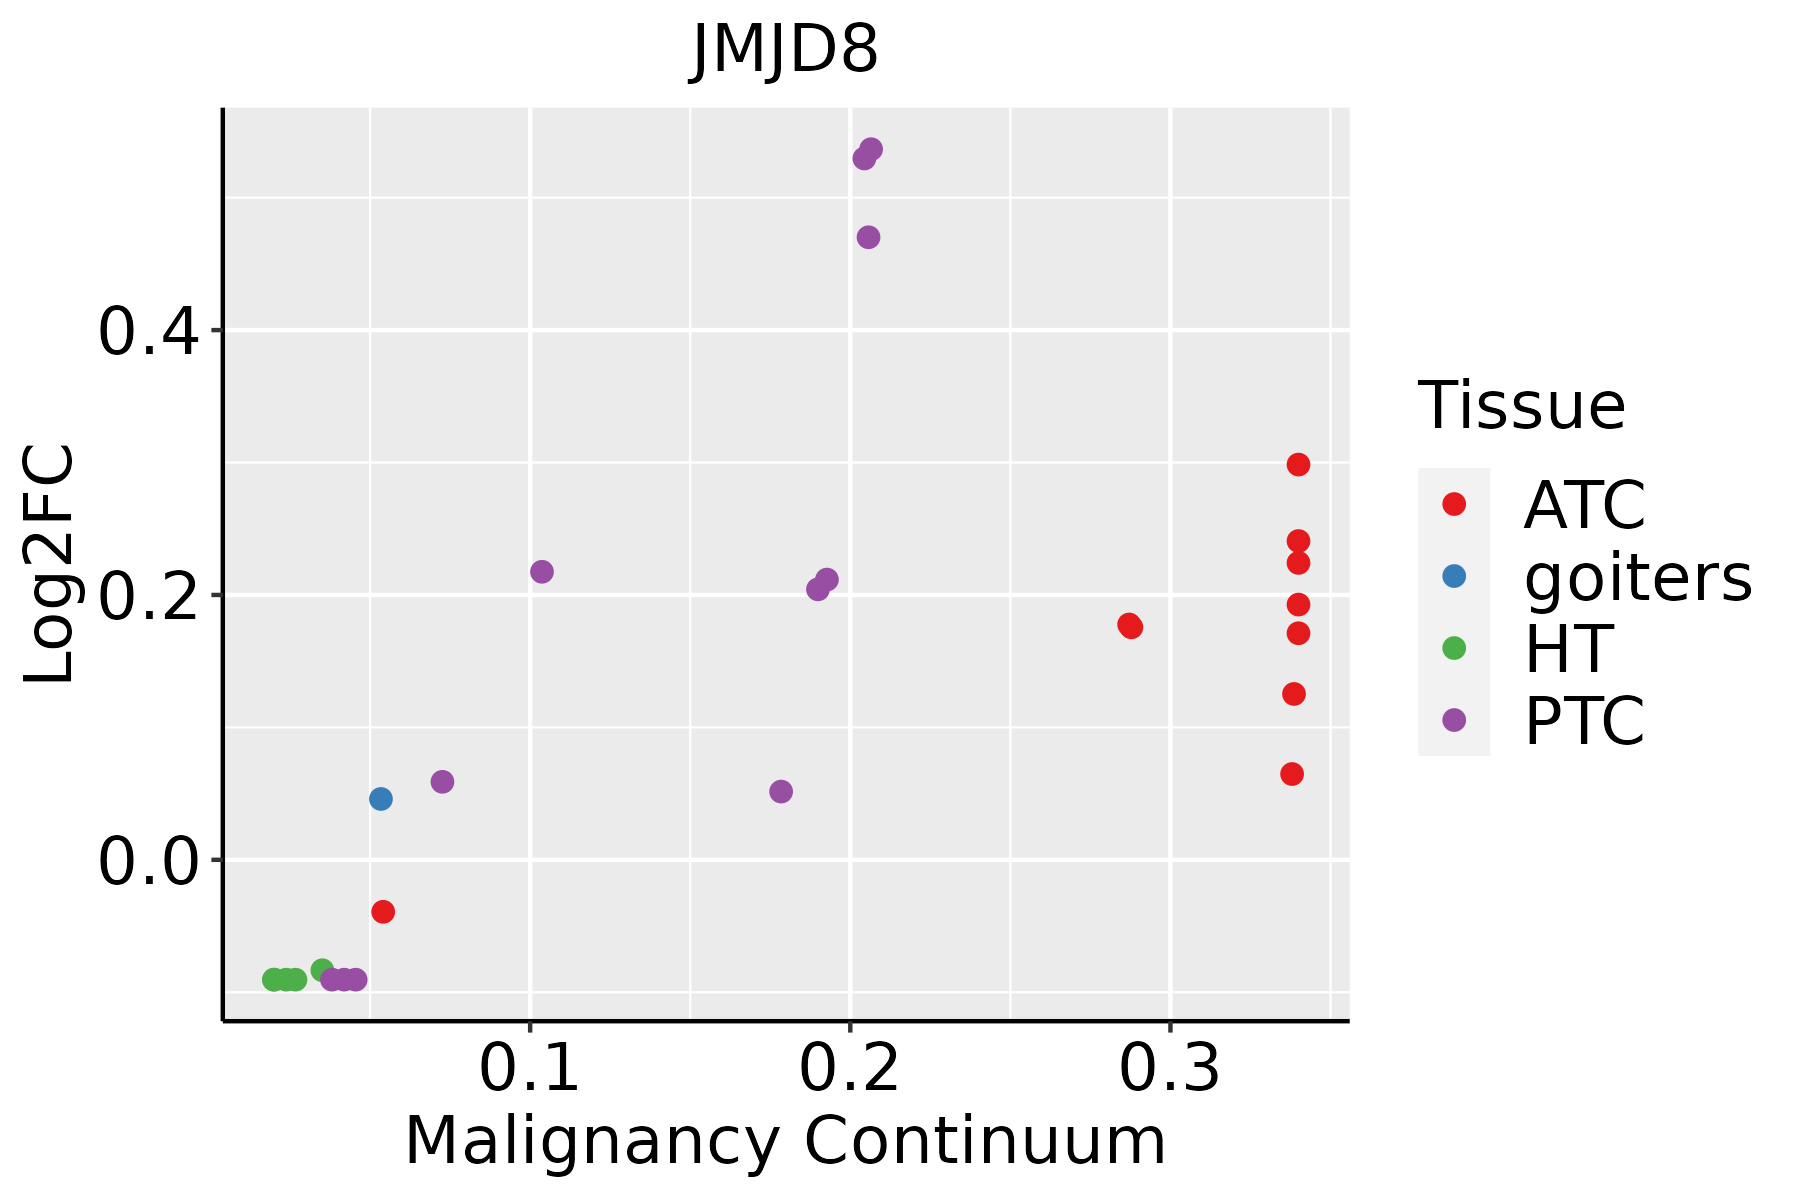 | ATC: Anaplastic thyroid cancer |
| HT: Hashimoto's thyroiditis | ||
| PTC: Papillary thyroid cancer |
| ∗log2FC in expression of this searched gene in stem-like cells from each diseased tissue sample relative to stem-like cells in normal samples in each tissue plotted against the malignancy continuum. Samples are colored based on if they are from different disease stage. |
Top |
Malignant transformation related pathway analysis |
| Find out the enriched GO biological processes and KEGG pathways involved in transition from healthy to precancer to cancer |
| Tissue | Disease Stage | Enriched GO biological Processes |
| Colorectum | AD |  |
| Colorectum | SER |  |
| Colorectum | MSS |  |
| Colorectum | MSI-H |  |
| Colorectum | FAP |  |
| ∗Top 15 enriched GO BP terms are showed in the bar plot of each disease state in each tissue. Each row represents a significant GO biological process which is colored according to the -log10(p.adjust). |
| Page: 1 2 3 4 5 6 7 8 9 |
| GO ID | Tissue | Disease Stage | Description | Gene Ratio | Bg Ratio | pvalue | p.adjust | Count |
| GO:0006091110 | Esophagus | ESCC | generation of precursor metabolites and energy | 331/8552 | 490/18723 | 3.86e-23 | 8.45e-21 | 331 |
| GO:0046034111 | Esophagus | ESCC | ATP metabolic process | 189/8552 | 277/18723 | 1.99e-14 | 1.04e-12 | 189 |
| GO:004312318 | Esophagus | ESCC | positive regulation of I-kappaB kinase/NF-kappaB signaling | 132/8552 | 186/18723 | 2.07e-12 | 8.58e-11 | 132 |
| GO:0043122110 | Esophagus | ESCC | regulation of I-kappaB kinase/NF-kappaB signaling | 167/8552 | 249/18723 | 6.11e-12 | 2.32e-10 | 167 |
| GO:000724919 | Esophagus | ESCC | I-kappaB kinase/NF-kappaB signaling | 183/8552 | 281/18723 | 3.02e-11 | 1.01e-09 | 183 |
| GO:0006753110 | Esophagus | ESCC | nucleoside phosphate metabolic process | 288/8552 | 497/18723 | 1.80e-08 | 3.50e-07 | 288 |
| GO:0019693111 | Esophagus | ESCC | ribose phosphate metabolic process | 234/8552 | 396/18723 | 4.24e-08 | 7.76e-07 | 234 |
| GO:0009117111 | Esophagus | ESCC | nucleotide metabolic process | 282/8552 | 489/18723 | 4.70e-08 | 8.50e-07 | 282 |
| GO:0009259111 | Esophagus | ESCC | ribonucleotide metabolic process | 224/8552 | 385/18723 | 4.41e-07 | 6.00e-06 | 224 |
| GO:0072521111 | Esophagus | ESCC | purine-containing compound metabolic process | 238/8552 | 416/18723 | 1.20e-06 | 1.49e-05 | 238 |
| GO:0009150111 | Esophagus | ESCC | purine ribonucleotide metabolic process | 213/8552 | 368/18723 | 1.40e-06 | 1.69e-05 | 213 |
| GO:0006163111 | Esophagus | ESCC | purine nucleotide metabolic process | 226/8552 | 396/18723 | 2.81e-06 | 3.21e-05 | 226 |
| GO:004346719 | Esophagus | ESCC | regulation of generation of precursor metabolites and energy | 81/8552 | 130/18723 | 9.58e-05 | 6.81e-04 | 81 |
| GO:000913219 | Esophagus | ESCC | nucleoside diphosphate metabolic process | 77/8552 | 124/18723 | 1.65e-04 | 1.09e-03 | 77 |
| GO:00620129 | Esophagus | ESCC | regulation of small molecule metabolic process | 184/8552 | 334/18723 | 3.11e-04 | 1.85e-03 | 184 |
| GO:000918520 | Esophagus | ESCC | ribonucleoside diphosphate metabolic process | 66/8552 | 106/18723 | 4.21e-04 | 2.39e-03 | 66 |
| GO:001605216 | Esophagus | ESCC | carbohydrate catabolic process | 91/8552 | 154/18723 | 5.39e-04 | 2.97e-03 | 91 |
| GO:000913520 | Esophagus | ESCC | purine nucleoside diphosphate metabolic process | 63/8552 | 103/18723 | 1.10e-03 | 5.52e-03 | 63 |
| GO:000917920 | Esophagus | ESCC | purine ribonucleoside diphosphate metabolic process | 63/8552 | 103/18723 | 1.10e-03 | 5.52e-03 | 63 |
| GO:00061096 | Esophagus | ESCC | regulation of carbohydrate metabolic process | 101/8552 | 178/18723 | 1.89e-03 | 8.52e-03 | 101 |
| Page: 1 2 3 4 5 6 7 8 9 10 11 |
| Pathway ID | Tissue | Disease Stage | Description | Gene Ratio | Bg Ratio | pvalue | p.adjust | qvalue | Count |
| Page: 1 |
Top |
Cell-cell communication analysis |
| Identification of potential cell-cell interactions between two cell types and their ligand-receptor pairs for different disease states |
| Ligand | Receptor | LRpair | Pathway | Tissue | Disease Stage |
| Page: 1 |
Top |
Single-cell gene regulatory network inference analysis |
| Find out the significant the regulons (TFs) and the target genes of each regulon across cell types for different disease states |
| TF | Cell Type | Tissue | Disease Stage | Target Gene | RSS | Regulon Activity |
| ∗The dot plots of a searched regulon are shown for all cell subpopulations in each disease state of each tissue based on the regulon specific score inferred using pySCENIC and by calculating the average expression. |
| Page: 1 |
Top |
Somatic mutation of malignant transformation related genes |
| Annotation of somatic variants for genes involved in malignant transformation |
| Hugo Symbol | Variant Class | Variant Classification | dbSNP RS | HGVSc | HGVSp | HGVSp Short | SWISSPROT | BIOTYPE | SIFT | PolyPhen | Tumor Sample Barcode | Tissue | Histology | Sex | Age | Stage | Therapy Types | Drugs | Outcome |
| JMJD8 | SNV | Missense_Mutation | c.490N>A | p.Glu164Lys | p.E164K | Q96S16 | protein_coding | tolerated(0.15) | probably_damaging(0.909) | TCGA-AC-A23H-01 | Breast | breast invasive carcinoma | Female | >=65 | I/II | Unknown | Unknown | PD | |
| JMJD8 | SNV | Missense_Mutation | novel | c.584N>T | p.Ser195Leu | p.S195L | Q96S16 | protein_coding | deleterious(0.03) | possibly_damaging(0.63) | TCGA-EA-A6QX-01 | Cervix | cervical & endocervical cancer | Female | <65 | III/IV | Unknown | Unknown | SD |
| JMJD8 | SNV | Missense_Mutation | c.284A>T | p.Asn95Ile | p.N95I | Q96S16 | protein_coding | deleterious(0) | probably_damaging(0.992) | TCGA-AD-5900-01 | Colorectum | colon adenocarcinoma | Male | >=65 | I/II | Unknown | Unknown | SD | |
| JMJD8 | SNV | Missense_Mutation | rs571730014 | c.737C>T | p.Pro246Leu | p.P246L | Q96S16 | protein_coding | tolerated(0.27) | benign(0.007) | TCGA-G4-6588-01 | Colorectum | colon adenocarcinoma | Female | <65 | I/II | Unknown | Unknown | SD |
| JMJD8 | SNV | Missense_Mutation | novel | c.520N>A | p.Pro174Thr | p.P174T | Q96S16 | protein_coding | tolerated(0.2) | benign(0.306) | TCGA-AX-A2HG-01 | Endometrium | uterine corpus endometrioid carcinoma | Female | <65 | I/II | Unknown | Unknown | SD |
| JMJD8 | SNV | Missense_Mutation | novel | c.290G>T | p.Arg97Met | p.R97M | Q96S16 | protein_coding | tolerated(0.08) | possibly_damaging(0.58) | TCGA-AX-A3FT-01 | Endometrium | uterine corpus endometrioid carcinoma | Female | <65 | I/II | Unknown | Unknown | SD |
| JMJD8 | SNV | Missense_Mutation | rs750654939 | c.547G>A | p.Ala183Thr | p.A183T | Q96S16 | protein_coding | tolerated(0.97) | benign(0.005) | TCGA-SL-A6JA-01 | Endometrium | uterine corpus endometrioid carcinoma | Female | >=65 | I/II | Unknown | Unknown | SD |
| JMJD8 | SNV | Missense_Mutation | c.532N>A | p.Gly178Ser | p.G178S | Q96S16 | protein_coding | tolerated(0.74) | benign(0.033) | TCGA-DD-A3A5-01 | Liver | liver hepatocellular carcinoma | Female | >=65 | III/IV | Unknown | Unknown | PD | |
| JMJD8 | SNV | Missense_Mutation | rs778481377 | c.664N>A | p.Glu222Lys | p.E222K | Q96S16 | protein_coding | tolerated(0.22) | benign(0.137) | TCGA-CV-7252-01 | Oral cavity | head & neck squamous cell carcinoma | Female | <65 | I/II | Unknown | Unknown | PD |
| JMJD8 | SNV | Missense_Mutation | c.658N>T | p.Pro220Ser | p.P220S | Q96S16 | protein_coding | deleterious(0.03) | possibly_damaging(0.869) | TCGA-BR-4257-01 | Stomach | stomach adenocarcinoma | Female | >=65 | I/II | Unknown | Unknown | SD |
| Page: 1 2 |
Top |
Related drugs of malignant transformation related genes |
| Identification of chemicals and drugs interact with genes involved in malignant transfromation |
| (DGIdb 4.0) |
| Entrez ID | Symbol | Category | Interaction Types | Drug Claim Name | Drug Name | PMIDs |
| Page: 1 |

Copyright 2023-Present -The University of Texas Health Science Center at Houston |