
|
|||||
|
 | |
| |
| |
| |
| |
| |
|
Gene: JMJD4 |
Gene summary for JMJD4 |
| Gene information | Species | Human | Gene symbol | JMJD4 | Gene ID | 65094 |
| Gene name | jumonji domain containing 4 | |
| Gene Alias | JMJD4 | |
| Cytomap | 1q42.13 | |
| Gene Type | protein-coding | GO ID | GO:0006412 | UniProtAcc | Q9H9V9 |
Top |
Malignant transformation analysis |
| Identification of the aberrant gene expression in precancerous and cancerous lesions by comparing the gene expression of stem-like cells in diseased tissues with normal stem cells |
| Entrez ID | Symbol | Replicates | Species | Organ | Tissue | Adj P-value | Log2FC | Malignancy |
| 65094 | JMJD4 | LZE7T | Human | Esophagus | ESCC | 2.56e-05 | 2.49e-01 | 0.0667 |
| 65094 | JMJD4 | LZE20T | Human | Esophagus | ESCC | 3.16e-03 | 1.31e-01 | 0.0662 |
| 65094 | JMJD4 | LZE24T | Human | Esophagus | ESCC | 1.89e-10 | 2.39e-01 | 0.0596 |
| 65094 | JMJD4 | P1T-E | Human | Esophagus | ESCC | 3.58e-07 | 2.95e-01 | 0.0875 |
| 65094 | JMJD4 | P2T-E | Human | Esophagus | ESCC | 3.02e-26 | 4.56e-01 | 0.1177 |
| 65094 | JMJD4 | P4T-E | Human | Esophagus | ESCC | 3.52e-15 | 3.40e-01 | 0.1323 |
| 65094 | JMJD4 | P5T-E | Human | Esophagus | ESCC | 3.19e-23 | 4.49e-01 | 0.1327 |
| 65094 | JMJD4 | P8T-E | Human | Esophagus | ESCC | 4.31e-06 | 1.77e-01 | 0.0889 |
| 65094 | JMJD4 | P9T-E | Human | Esophagus | ESCC | 2.38e-11 | 2.66e-01 | 0.1131 |
| 65094 | JMJD4 | P10T-E | Human | Esophagus | ESCC | 4.41e-07 | 1.42e-01 | 0.116 |
| 65094 | JMJD4 | P11T-E | Human | Esophagus | ESCC | 2.10e-10 | 3.36e-01 | 0.1426 |
| 65094 | JMJD4 | P12T-E | Human | Esophagus | ESCC | 1.76e-12 | 1.88e-01 | 0.1122 |
| 65094 | JMJD4 | P15T-E | Human | Esophagus | ESCC | 4.72e-09 | 2.03e-01 | 0.1149 |
| 65094 | JMJD4 | P16T-E | Human | Esophagus | ESCC | 8.96e-45 | 6.84e-01 | 0.1153 |
| 65094 | JMJD4 | P17T-E | Human | Esophagus | ESCC | 2.60e-06 | 3.15e-01 | 0.1278 |
| 65094 | JMJD4 | P19T-E | Human | Esophagus | ESCC | 5.23e-14 | 6.49e-01 | 0.1662 |
| 65094 | JMJD4 | P20T-E | Human | Esophagus | ESCC | 1.17e-04 | 1.40e-01 | 0.1124 |
| 65094 | JMJD4 | P21T-E | Human | Esophagus | ESCC | 5.17e-27 | 4.68e-01 | 0.1617 |
| 65094 | JMJD4 | P22T-E | Human | Esophagus | ESCC | 5.17e-27 | 4.38e-01 | 0.1236 |
| 65094 | JMJD4 | P23T-E | Human | Esophagus | ESCC | 4.70e-20 | 4.44e-01 | 0.108 |
| Page: 1 2 3 4 |
| Tissue | Expression Dynamics | Abbreviation |
| Esophagus | 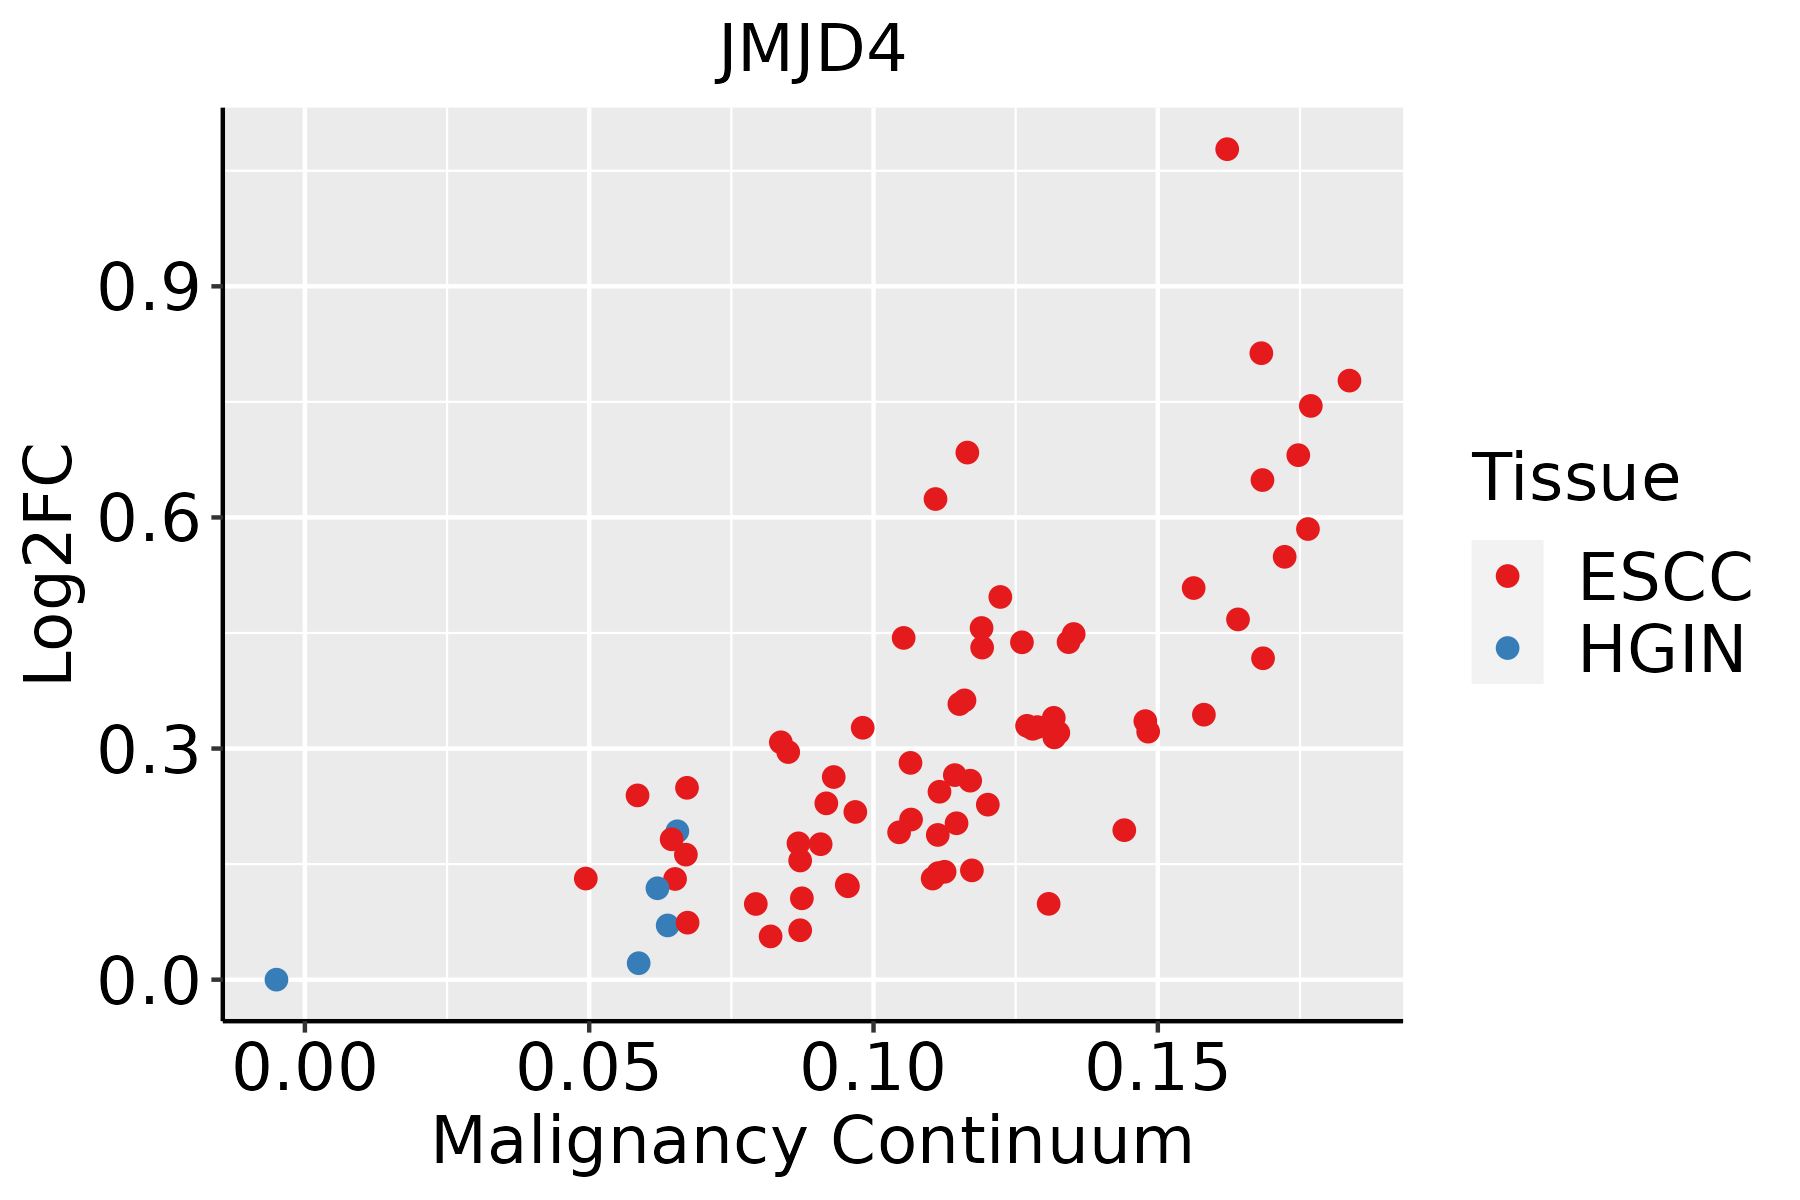 | ESCC: Esophageal squamous cell carcinoma |
| HGIN: High-grade intraepithelial neoplasias | ||
| LGIN: Low-grade intraepithelial neoplasias | ||
| Oral Cavity | 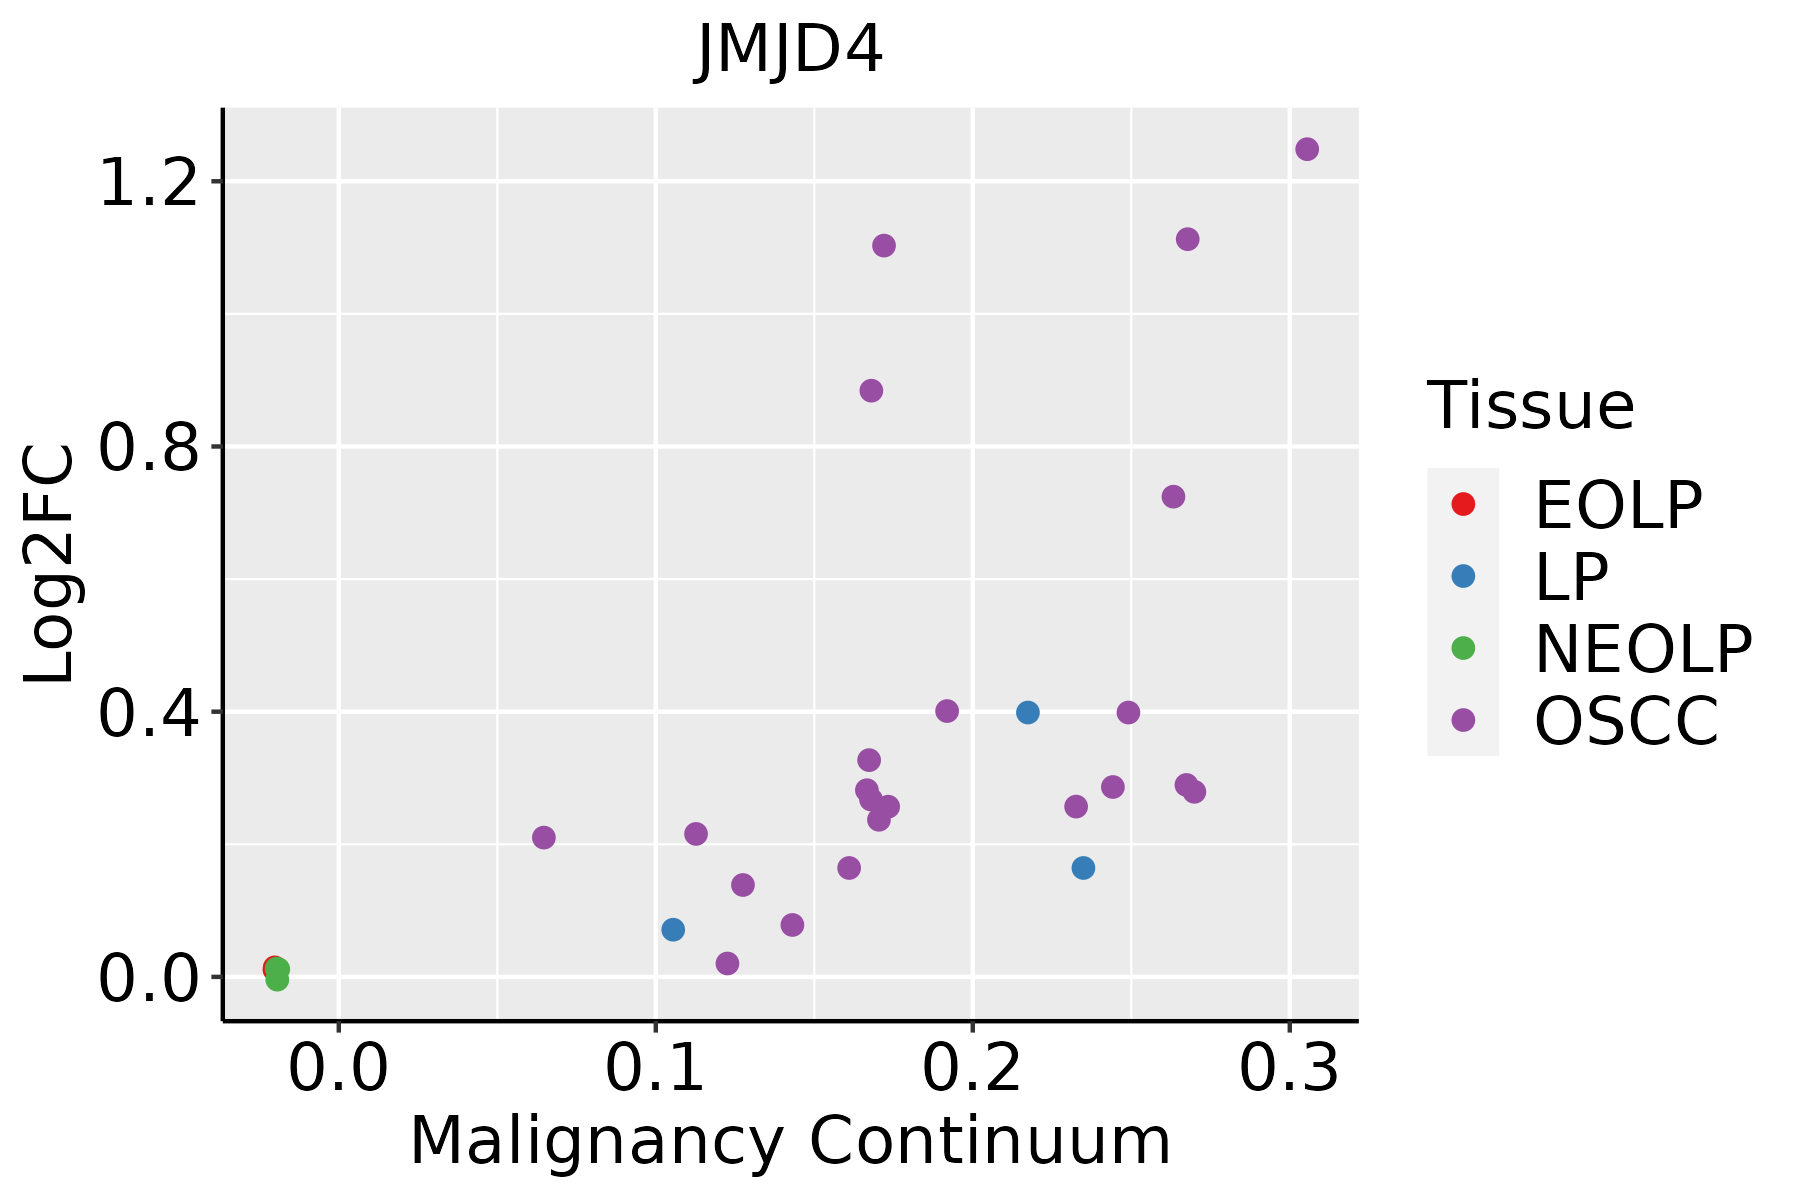 | EOLP: Erosive Oral lichen planus |
| LP: leukoplakia | ||
| NEOLP: Non-erosive oral lichen planus | ||
| OSCC: Oral squamous cell carcinoma |
| ∗log2FC in expression of this searched gene in stem-like cells from each diseased tissue sample relative to stem-like cells in normal samples in each tissue plotted against the malignancy continuum. Samples are colored based on if they are from different disease stage. |
Top |
Malignant transformation related pathway analysis |
| Find out the enriched GO biological processes and KEGG pathways involved in transition from healthy to precancer to cancer |
| Tissue | Disease Stage | Enriched GO biological Processes |
| Colorectum | AD |  |
| Colorectum | SER |  |
| Colorectum | MSS |  |
| Colorectum | MSI-H |  |
| Colorectum | FAP |  |
| ∗Top 15 enriched GO BP terms are showed in the bar plot of each disease state in each tissue. Each row represents a significant GO biological process which is colored according to the -log10(p.adjust). |
| Page: 1 2 3 4 5 6 7 8 9 |
| GO ID | Tissue | Disease Stage | Description | Gene Ratio | Bg Ratio | pvalue | p.adjust | Count |
| GO:0022411111 | Esophagus | ESCC | cellular component disassembly | 305/8552 | 443/18723 | 1.94e-23 | 4.57e-21 | 305 |
| GO:0006417111 | Esophagus | ESCC | regulation of translation | 304/8552 | 468/18723 | 1.53e-17 | 1.33e-15 | 304 |
| GO:0045727111 | Esophagus | ESCC | positive regulation of translation | 107/8552 | 136/18723 | 2.79e-15 | 1.68e-13 | 107 |
| GO:0034250111 | Esophagus | ESCC | positive regulation of cellular amide metabolic process | 123/8552 | 162/18723 | 3.32e-15 | 1.93e-13 | 123 |
| GO:003298416 | Esophagus | ESCC | protein-containing complex disassembly | 151/8552 | 224/18723 | 3.45e-11 | 1.15e-09 | 151 |
| GO:00181263 | Esophagus | ESCC | protein hydroxylation | 23/8552 | 27/18723 | 2.60e-05 | 2.19e-04 | 23 |
| GO:00432446 | Esophagus | ESCC | regulation of protein-containing complex disassembly | 75/8552 | 121/18723 | 2.17e-04 | 1.36e-03 | 75 |
| GO:00436245 | Esophagus | ESCC | cellular protein complex disassembly | 78/8552 | 136/18723 | 4.00e-03 | 1.62e-02 | 78 |
| GO:002241119 | Oral cavity | OSCC | cellular component disassembly | 283/7305 | 443/18723 | 9.57e-27 | 3.37e-24 | 283 |
| GO:000641720 | Oral cavity | OSCC | regulation of translation | 274/7305 | 468/18723 | 4.39e-18 | 4.63e-16 | 274 |
| GO:004572719 | Oral cavity | OSCC | positive regulation of translation | 101/7305 | 136/18723 | 5.85e-17 | 4.94e-15 | 101 |
| GO:003425019 | Oral cavity | OSCC | positive regulation of cellular amide metabolic process | 115/7305 | 162/18723 | 1.28e-16 | 1.05e-14 | 115 |
| GO:003298410 | Oral cavity | OSCC | protein-containing complex disassembly | 136/7305 | 224/18723 | 3.42e-11 | 1.13e-09 | 136 |
| GO:00181262 | Oral cavity | OSCC | protein hydroxylation | 22/7305 | 27/18723 | 7.89e-06 | 8.49e-05 | 22 |
| GO:00432445 | Oral cavity | OSCC | regulation of protein-containing complex disassembly | 65/7305 | 121/18723 | 7.08e-04 | 3.90e-03 | 65 |
| GO:0006415 | Oral cavity | OSCC | translational termination | 13/7305 | 18/18723 | 4.45e-03 | 1.79e-02 | 13 |
| GO:0006449 | Oral cavity | OSCC | regulation of translational termination | 9/7305 | 11/18723 | 4.85e-03 | 1.92e-02 | 9 |
| GO:00436244 | Oral cavity | OSCC | cellular protein complex disassembly | 68/7305 | 136/18723 | 5.84e-03 | 2.24e-02 | 68 |
| GO:00432432 | Oral cavity | OSCC | positive regulation of protein-containing complex disassembly | 21/7305 | 35/18723 | 9.58e-03 | 3.40e-02 | 21 |
| GO:0022411110 | Oral cavity | LP | cellular component disassembly | 173/4623 | 443/18723 | 9.97e-12 | 7.44e-10 | 173 |
| Page: 1 2 |
| Pathway ID | Tissue | Disease Stage | Description | Gene Ratio | Bg Ratio | pvalue | p.adjust | qvalue | Count |
| Page: 1 |
Top |
Cell-cell communication analysis |
| Identification of potential cell-cell interactions between two cell types and their ligand-receptor pairs for different disease states |
| Ligand | Receptor | LRpair | Pathway | Tissue | Disease Stage |
| Page: 1 |
Top |
Single-cell gene regulatory network inference analysis |
| Find out the significant the regulons (TFs) and the target genes of each regulon across cell types for different disease states |
| TF | Cell Type | Tissue | Disease Stage | Target Gene | RSS | Regulon Activity |
| ∗The dot plots of a searched regulon are shown for all cell subpopulations in each disease state of each tissue based on the regulon specific score inferred using pySCENIC and by calculating the average expression. |
| Page: 1 |
Top |
Somatic mutation of malignant transformation related genes |
| Annotation of somatic variants for genes involved in malignant transformation |
| Hugo Symbol | Variant Class | Variant Classification | dbSNP RS | HGVSc | HGVSp | HGVSp Short | SWISSPROT | BIOTYPE | SIFT | PolyPhen | Tumor Sample Barcode | Tissue | Histology | Sex | Age | Stage | Therapy Types | Drugs | Outcome |
| JMJD4 | SNV | Missense_Mutation | rs777277764 | c.767N>C | p.Leu256Pro | p.L256P | Q9H9V9 | protein_coding | deleterious(0) | probably_damaging(0.98) | TCGA-AR-A1AY-01 | Breast | breast invasive carcinoma | Female | >=65 | I/II | Unspecific | Doxorubicin | SD |
| JMJD4 | SNV | Missense_Mutation | novel | c.1308N>T | p.Arg436Ser | p.R436S | Q9H9V9 | protein_coding | deleterious(0.02) | benign(0.006) | TCGA-EW-A1OY-01 | Breast | breast invasive carcinoma | Female | <65 | I/II | Chemotherapy | doxorubicin | SD |
| JMJD4 | SNV | Missense_Mutation | c.1134N>G | p.Ile378Met | p.I378M | Q9H9V9 | protein_coding | tolerated(0.36) | benign(0.057) | TCGA-C5-A7UH-01 | Cervix | cervical & endocervical cancer | Female | <65 | III/IV | Chemotherapy | cisplatin | SD | |
| JMJD4 | SNV | Missense_Mutation | rs372699883 | c.1258N>T | p.Arg420Cys | p.R420C | Q9H9V9 | protein_coding | deleterious(0) | benign(0.043) | TCGA-A6-6780-01 | Colorectum | colon adenocarcinoma | Male | >=65 | I/II | Unknown | Unknown | SD |
| JMJD4 | SNV | Missense_Mutation | c.1276G>A | p.Ala426Thr | p.A426T | Q9H9V9 | protein_coding | tolerated(0.38) | benign(0.007) | TCGA-EI-6507-01 | Colorectum | rectum adenocarcinoma | Male | <65 | I/II | Unknown | Unknown | SD | |
| JMJD4 | SNV | Missense_Mutation | rs748566750 | c.1234G>A | p.Glu412Lys | p.E412K | Q9H9V9 | protein_coding | tolerated(0.54) | benign(0.033) | TCGA-F5-6814-01 | Colorectum | rectum adenocarcinoma | Male | <65 | I/II | Unknown | Unknown | SD |
| JMJD4 | SNV | Missense_Mutation | novel | c.506N>C | p.Ile169Thr | p.I169T | Q9H9V9 | protein_coding | tolerated(0.09) | benign(0.351) | TCGA-AP-A059-01 | Endometrium | uterine corpus endometrioid carcinoma | Female | >=65 | I/II | Unknown | Unknown | SD |
| JMJD4 | SNV | Missense_Mutation | rs751199312 | c.674N>T | p.Ala225Val | p.A225V | Q9H9V9 | protein_coding | deleterious(0.02) | benign(0.067) | TCGA-AP-A0LM-01 | Endometrium | uterine corpus endometrioid carcinoma | Female | <65 | III/IV | Chemotherapy | cisplatin | SD |
| JMJD4 | SNV | Missense_Mutation | novel | c.987N>A | p.Asn329Lys | p.N329K | Q9H9V9 | protein_coding | deleterious(0) | probably_damaging(1) | TCGA-AX-A0J1-01 | Endometrium | uterine corpus endometrioid carcinoma | Female | >=65 | I/II | Unknown | Unknown | SD |
| JMJD4 | SNV | Missense_Mutation | novel | c.459N>C | p.Lys153Asn | p.K153N | Q9H9V9 | protein_coding | deleterious(0) | possibly_damaging(0.675) | TCGA-AX-A1C9-01 | Endometrium | uterine corpus endometrioid carcinoma | Female | >=65 | I/II | Unknown | Unknown | SD |
| Page: 1 2 3 4 |
Top |
Related drugs of malignant transformation related genes |
| Identification of chemicals and drugs interact with genes involved in malignant transfromation |
| (DGIdb 4.0) |
| Entrez ID | Symbol | Category | Interaction Types | Drug Claim Name | Drug Name | PMIDs |
| Page: 1 |

Copyright 2023-Present -The University of Texas Health Science Center at Houston |