
|
|||||
|
 | |
| |
| |
| |
| |
| |
|
Gene: JDP2 |
Gene summary for JDP2 |
| Gene information | Species | Human | Gene symbol | JDP2 | Gene ID | 122953 |
| Gene name | Jun dimerization protein 2 | |
| Gene Alias | JUNDM2 | |
| Cytomap | 14q24.3 | |
| Gene Type | protein-coding | GO ID | GO:0000122 | UniProtAcc | A0A024R6D7 |
Top |
Malignant transformation analysis |
| Identification of the aberrant gene expression in precancerous and cancerous lesions by comparing the gene expression of stem-like cells in diseased tissues with normal stem cells |
| Entrez ID | Symbol | Replicates | Species | Organ | Tissue | Adj P-value | Log2FC | Malignancy |
| 122953 | JDP2 | C30 | Human | Oral cavity | OSCC | 2.68e-03 | 4.65e-01 | 0.3055 |
| 122953 | JDP2 | LN46 | Human | Oral cavity | OSCC | 2.22e-03 | 8.36e-02 | 0.1666 |
| 122953 | JDP2 | LP15 | Human | Oral cavity | LP | 8.30e-06 | 9.40e-01 | 0.2174 |
| 122953 | JDP2 | LP17 | Human | Oral cavity | LP | 1.40e-02 | 5.48e-01 | 0.2349 |
| 122953 | JDP2 | SYSMH2 | Human | Oral cavity | OSCC | 1.04e-27 | 6.84e-01 | 0.2326 |
| 122953 | JDP2 | SYSMH3 | Human | Oral cavity | OSCC | 9.55e-14 | 4.11e-01 | 0.2442 |
| 122953 | JDP2 | SYSMH4 | Human | Oral cavity | OSCC | 3.92e-11 | 3.38e-01 | 0.1226 |
| 122953 | JDP2 | SYSMH6 | Human | Oral cavity | OSCC | 5.98e-04 | 3.14e-01 | 0.1275 |
| 122953 | JDP2 | P2_S3_AK | Human | Skin | AK | 1.15e-02 | 1.68e-01 | -0.3287 |
| 122953 | JDP2 | P4_S8_cSCC | Human | Skin | cSCC | 6.76e-13 | 3.87e-01 | -0.3095 |
| 122953 | JDP2 | P1_cSCC | Human | Skin | cSCC | 1.15e-04 | 2.09e-01 | 0.0292 |
| 122953 | JDP2 | P2_cSCC | Human | Skin | cSCC | 4.27e-02 | 1.56e-01 | -0.024 |
| 122953 | JDP2 | cSCC_p10 | Human | Skin | cSCC | 6.58e-03 | 1.82e-01 | -0.2095 |
| Page: 1 |
| Tissue | Expression Dynamics | Abbreviation |
| Oral Cavity | 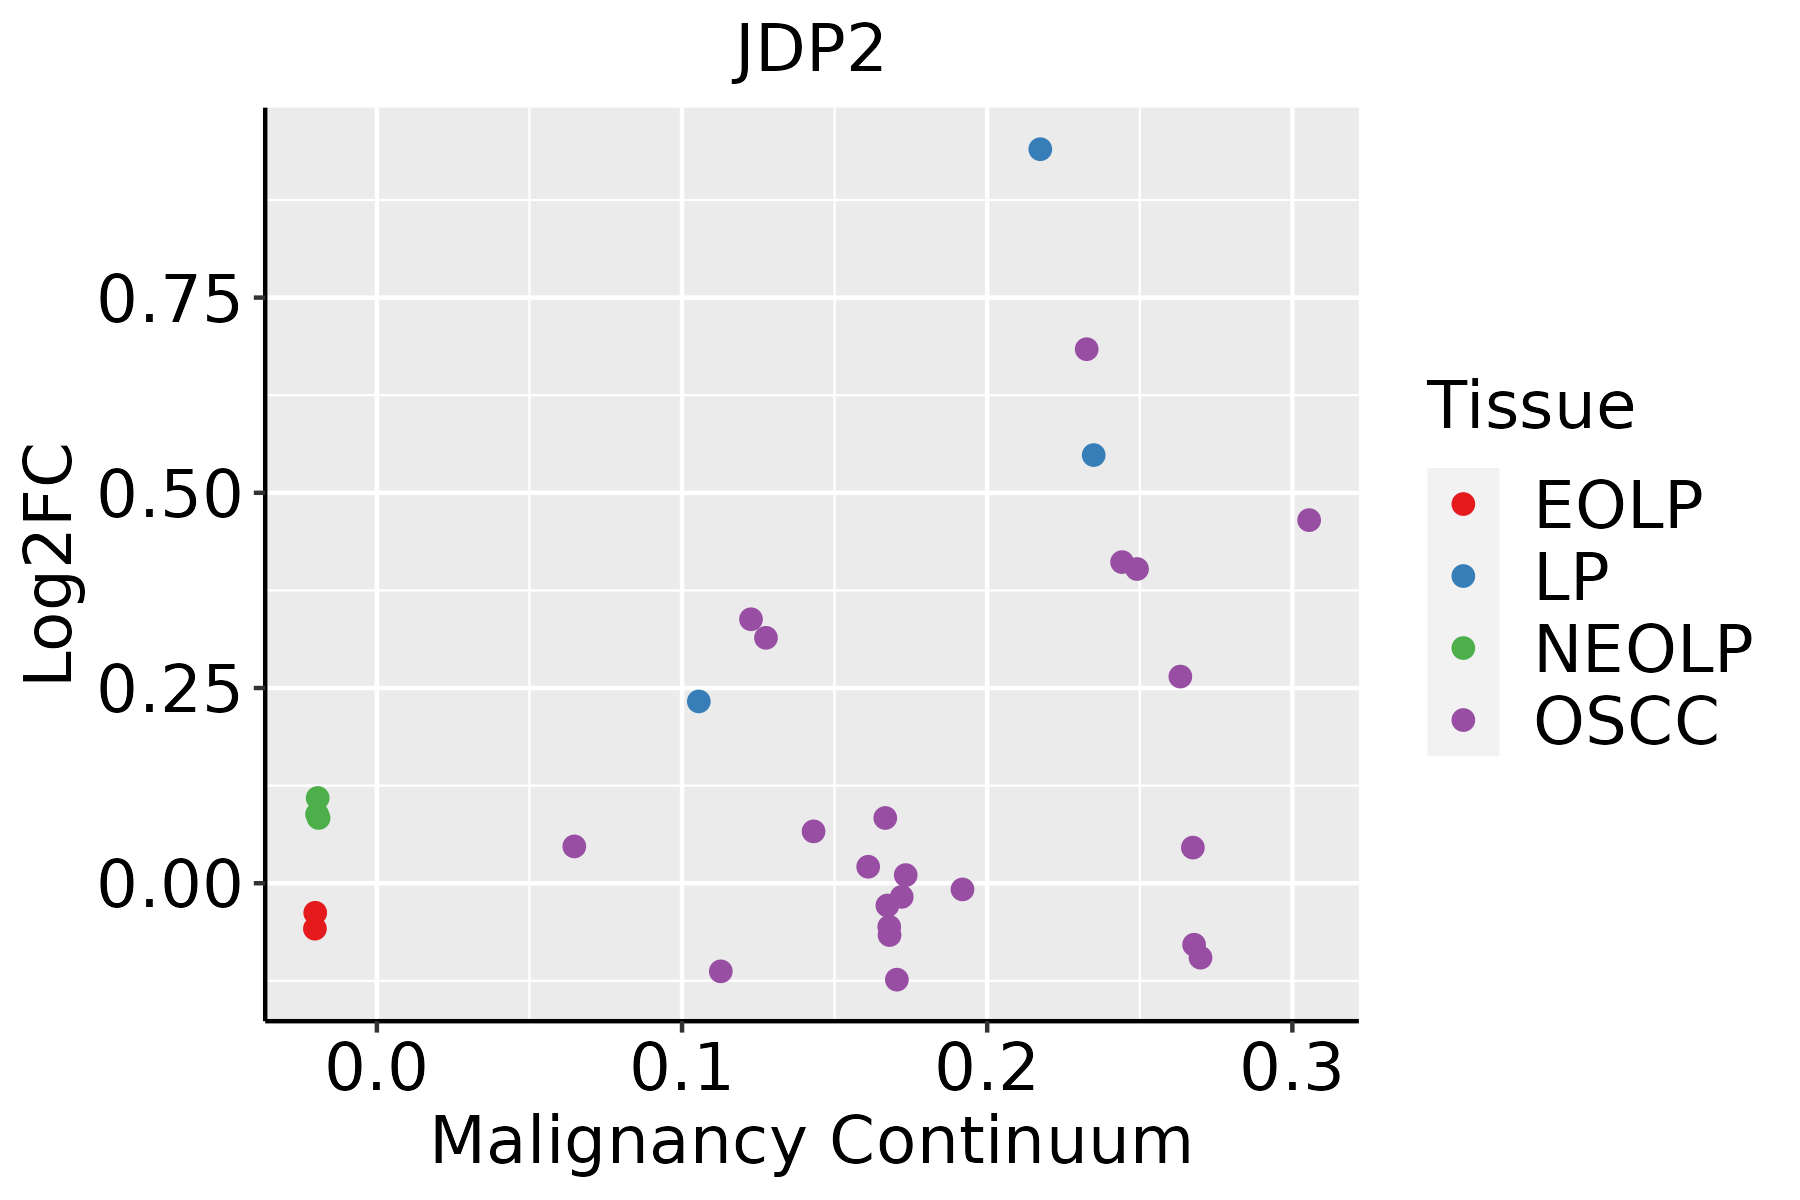 | EOLP: Erosive Oral lichen planus |
| LP: leukoplakia | ||
| NEOLP: Non-erosive oral lichen planus | ||
| OSCC: Oral squamous cell carcinoma | ||
| Skin |  | AK: Actinic keratosis |
| cSCC: Cutaneous squamous cell carcinoma | ||
| SCCIS:squamous cell carcinoma in situ |
| ∗log2FC in expression of this searched gene in stem-like cells from each diseased tissue sample relative to stem-like cells in normal samples in each tissue plotted against the malignancy continuum. Samples are colored based on if they are from different disease stage. |
Top |
Malignant transformation related pathway analysis |
| Find out the enriched GO biological processes and KEGG pathways involved in transition from healthy to precancer to cancer |
| Tissue | Disease Stage | Enriched GO biological Processes |
| Colorectum | AD |  |
| Colorectum | SER |  |
| Colorectum | MSS |  |
| Colorectum | MSI-H |  |
| Colorectum | FAP |  |
| ∗Top 15 enriched GO BP terms are showed in the bar plot of each disease state in each tissue. Each row represents a significant GO biological process which is colored according to the -log10(p.adjust). |
| Page: 1 2 3 4 5 6 7 8 9 |
| GO ID | Tissue | Disease Stage | Description | Gene Ratio | Bg Ratio | pvalue | p.adjust | Count |
| GO:00165707 | Oral cavity | OSCC | histone modification | 270/7305 | 463/18723 | 1.59e-17 | 1.50e-15 | 270 |
| GO:00356014 | Oral cavity | OSCC | protein deacylation | 74/7305 | 112/18723 | 5.88e-09 | 1.26e-07 | 74 |
| GO:00310567 | Oral cavity | OSCC | regulation of histone modification | 94/7305 | 152/18723 | 9.57e-09 | 1.99e-07 | 94 |
| GO:00987324 | Oral cavity | OSCC | macromolecule deacylation | 74/7305 | 116/18723 | 5.52e-08 | 1.01e-06 | 74 |
| GO:00064764 | Oral cavity | OSCC | protein deacetylation | 66/7305 | 101/18723 | 7.36e-08 | 1.30e-06 | 66 |
| GO:00310582 | Oral cavity | OSCC | positive regulation of histone modification | 60/7305 | 92/18723 | 3.17e-07 | 4.79e-06 | 60 |
| GO:00165753 | Oral cavity | OSCC | histone deacetylation | 54/7305 | 82/18723 | 7.68e-07 | 1.08e-05 | 54 |
| GO:00454448 | Oral cavity | OSCC | fat cell differentiation | 120/7305 | 229/18723 | 2.48e-05 | 2.32e-04 | 120 |
| GO:0090312 | Oral cavity | OSCC | positive regulation of protein deacetylation | 20/7305 | 25/18723 | 3.47e-05 | 3.11e-04 | 20 |
| GO:00455983 | Oral cavity | OSCC | regulation of fat cell differentiation | 77/7305 | 139/18723 | 6.36e-05 | 5.18e-04 | 77 |
| GO:0031065 | Oral cavity | OSCC | positive regulation of histone deacetylation | 15/7305 | 19/18723 | 4.64e-04 | 2.76e-03 | 15 |
| GO:00903113 | Oral cavity | OSCC | regulation of protein deacetylation | 30/7305 | 48/18723 | 8.31e-04 | 4.41e-03 | 30 |
| GO:0031063 | Oral cavity | OSCC | regulation of histone deacetylation | 19/7305 | 31/18723 | 9.93e-03 | 3.48e-02 | 19 |
| GO:003560113 | Oral cavity | LP | protein deacylation | 48/4623 | 112/18723 | 1.85e-05 | 3.14e-04 | 48 |
| GO:001657014 | Oral cavity | LP | histone modification | 152/4623 | 463/18723 | 4.04e-05 | 5.90e-04 | 152 |
| GO:001657511 | Oral cavity | LP | histone deacetylation | 37/4623 | 82/18723 | 4.28e-05 | 6.15e-04 | 37 |
| GO:009873212 | Oral cavity | LP | macromolecule deacylation | 48/4623 | 116/18723 | 5.51e-05 | 7.58e-04 | 48 |
| GO:000647613 | Oral cavity | LP | protein deacetylation | 41/4623 | 101/18723 | 3.03e-04 | 3.12e-03 | 41 |
| GO:00903121 | Oral cavity | LP | positive regulation of protein deacetylation | 14/4623 | 25/18723 | 7.95e-04 | 7.01e-03 | 14 |
| GO:003105613 | Oral cavity | LP | regulation of histone modification | 55/4623 | 152/18723 | 1.01e-03 | 8.48e-03 | 55 |
| Page: 1 2 |
| Pathway ID | Tissue | Disease Stage | Description | Gene Ratio | Bg Ratio | pvalue | p.adjust | qvalue | Count |
| Page: 1 |
Top |
Cell-cell communication analysis |
| Identification of potential cell-cell interactions between two cell types and their ligand-receptor pairs for different disease states |
| Ligand | Receptor | LRpair | Pathway | Tissue | Disease Stage |
| Page: 1 |
Top |
Single-cell gene regulatory network inference analysis |
| Find out the significant the regulons (TFs) and the target genes of each regulon across cell types for different disease states |
| TF | Cell Type | Tissue | Disease Stage | Target Gene | RSS | Regulon Activity |
| JDP2 | MON | Colorectum | CRC | SIGLEC1,GBP1,C3AR1, etc. | 2.68e-01 |  |
| JDP2 | MAC | Colorectum | Healthy | SIGLEC1,GBP1,C3AR1, etc. | 4.53e-01 |  |
| JDP2 | MON | Colorectum | MSI-H | SIGLEC1,GBP1,C3AR1, etc. | 5.19e-01 |  |
| JDP2 | MON | Colorectum | MSS | SIGLEC1,GBP1,C3AR1, etc. | 5.15e-01 |  |
| JDP2 | INCAF | Colorectum | FAP | MUC12,WNK1,GRAMD1C, etc. | 1.29e-01 |  |
| JDP2 | AT2 | Lung | Healthy | ANKRD17,SMDT1,LURAP1L, etc. | 4.86e-01 |  |
| ∗The dot plots of a searched regulon are shown for all cell subpopulations in each disease state of each tissue based on the regulon specific score inferred using pySCENIC and by calculating the average expression. |
| Page: 1 |
Top |
Somatic mutation of malignant transformation related genes |
| Annotation of somatic variants for genes involved in malignant transformation |
| Hugo Symbol | Variant Class | Variant Classification | dbSNP RS | HGVSc | HGVSp | HGVSp Short | SWISSPROT | BIOTYPE | SIFT | PolyPhen | Tumor Sample Barcode | Tissue | Histology | Sex | Age | Stage | Therapy Types | Drugs | Outcome |
| JDP2 | SNV | Missense_Mutation | c.155G>A | p.Arg52His | p.R52H | Q8WYK2 | protein_coding | tolerated(0.48) | benign(0.003) | TCGA-BH-A18G-01 | Breast | breast invasive carcinoma | Female | >=65 | I/II | Unknown | Unknown | SD | |
| JDP2 | SNV | Missense_Mutation | c.269N>C | p.Arg90Pro | p.R90P | Q8WYK2 | protein_coding | deleterious(0.01) | possibly_damaging(0.906) | TCGA-BH-A18L-01 | Breast | breast invasive carcinoma | Female | <65 | III/IV | Unknown | Unknown | SD | |
| JDP2 | insertion | In_Frame_Ins | novel | c.427_428insTGTTTTACTGTTCAATCCCCCAAGCCT | p.Leu143_Asn144insPheTyrCysSerIleProGlnAlaLeu | p.L143_N144insFYCSIPQAL | Q8WYK2 | protein_coding | TCGA-B6-A0I6-01 | Breast | breast invasive carcinoma | Female | <65 | I/II | Unknown | Unknown | PD | ||
| JDP2 | SNV | Missense_Mutation | novel | c.434N>A | p.Arg145Gln | p.R145Q | Q8WYK2 | protein_coding | tolerated(0.3) | benign(0.272) | TCGA-2W-A8YY-01 | Cervix | cervical & endocervical cancer | Female | <65 | I/II | Chemotherapy | cisplatin | CR |
| JDP2 | SNV | Missense_Mutation | rs767954679 | c.346N>A | p.Glu116Lys | p.E116K | Q8WYK2 | protein_coding | deleterious(0) | probably_damaging(0.991) | TCGA-EK-A3GK-01 | Cervix | cervical & endocervical cancer | Female | <65 | I/II | Unknown | Unknown | SD |
| JDP2 | SNV | Missense_Mutation | c.473N>T | p.Lys158Met | p.K158M | Q8WYK2 | protein_coding | deleterious(0) | possibly_damaging(0.575) | TCGA-AX-A063-01 | Endometrium | uterine corpus endometrioid carcinoma | Female | <65 | I/II | Unknown | Unknown | SD | |
| JDP2 | SNV | Missense_Mutation | rs371436905 | c.337N>T | p.Arg113Trp | p.R113W | Q8WYK2 | protein_coding | tolerated(0.1) | possibly_damaging(0.653) | TCGA-AX-A2HC-01 | Endometrium | uterine corpus endometrioid carcinoma | Female | <65 | III/IV | Chemotherapy | paclitaxel | PD |
| JDP2 | SNV | Missense_Mutation | rs374893446 | c.265C>T | p.Arg89Cys | p.R89C | Q8WYK2 | protein_coding | deleterious(0) | probably_damaging(0.911) | TCGA-B5-A3FC-01 | Endometrium | uterine corpus endometrioid carcinoma | Female | <65 | I/II | Unknown | Unknown | SD |
| JDP2 | SNV | Missense_Mutation | rs76343259 | c.514N>A | p.Glu172Lys | p.E172K | Q8WYK2 | protein_coding | tolerated_low_confidence(0.12) | benign(0.015) | TCGA-BS-A0TE-01 | Endometrium | uterine corpus endometrioid carcinoma | Female | <65 | III/IV | Chemotherapy | adriamycin | PD |
| JDP2 | SNV | Missense_Mutation | novel | c.364N>C | p.Asn122His | p.N122H | Q8WYK2 | protein_coding | deleterious(0) | probably_damaging(0.924) | TCGA-BS-A0UJ-01 | Endometrium | uterine corpus endometrioid carcinoma | Female | >=65 | I/II | Unknown | Unknown | SD |
| Page: 1 2 |
Top |
Related drugs of malignant transformation related genes |
| Identification of chemicals and drugs interact with genes involved in malignant transfromation |
| (DGIdb 4.0) |
| Entrez ID | Symbol | Category | Interaction Types | Drug Claim Name | Drug Name | PMIDs |
| Page: 1 |

Copyright 2023-Present -The University of Texas Health Science Center at Houston |