
|
|||||
|
 | |
| |
| |
| |
| |
| |
|
Gene: JCHAIN |
Gene summary for JCHAIN |
| Gene information | Species | Human | Gene symbol | JCHAIN | Gene ID | 3512 |
| Gene name | joining chain of multimeric IgA and IgM | |
| Gene Alias | IGCJ | |
| Cytomap | 4q13.3 | |
| Gene Type | protein-coding | GO ID | GO:0001894 | UniProtAcc | P01591 |
Top |
Malignant transformation analysis |
| Identification of the aberrant gene expression in precancerous and cancerous lesions by comparing the gene expression of stem-like cells in diseased tissues with normal stem cells |
| Entrez ID | Symbol | Replicates | Species | Organ | Tissue | Adj P-value | Log2FC | Malignancy |
| 3512 | JCHAIN | CA_HPV_1 | Human | Cervix | CC | 4.25e-03 | 1.61e-01 | 0.0264 |
| 3512 | JCHAIN | CA_HPV_2 | Human | Cervix | CC | 2.70e-25 | -9.29e-01 | 0.0391 |
| 3512 | JCHAIN | CA_HPV_3 | Human | Cervix | CC | 2.07e-18 | -8.84e-01 | 0.0414 |
| 3512 | JCHAIN | HSIL_HPV_1 | Human | Cervix | HSIL_HPV | 1.36e-11 | -7.66e-01 | 0.0116 |
| 3512 | JCHAIN | HSIL_HPV_2 | Human | Cervix | HSIL_HPV | 1.01e-15 | -8.14e-01 | 0.0208 |
| 3512 | JCHAIN | N_HPV_1 | Human | Cervix | N_HPV | 6.66e-09 | -6.83e-01 | 0.0079 |
| 3512 | JCHAIN | N_HPV_2 | Human | Cervix | N_HPV | 1.51e-25 | -9.32e-01 | -0.0131 |
| 3512 | JCHAIN | CCI_1 | Human | Cervix | CC | 5.88e-09 | -9.50e-01 | 0.528 |
| 3512 | JCHAIN | CCI_2 | Human | Cervix | CC | 3.56e-08 | -9.50e-01 | 0.5249 |
| 3512 | JCHAIN | CCI_3 | Human | Cervix | CC | 4.19e-12 | -9.50e-01 | 0.516 |
| 3512 | JCHAIN | CCII_1 | Human | Cervix | CC | 6.47e-17 | -9.50e-01 | 0.3249 |
| 3512 | JCHAIN | Tumor | Human | Cervix | CC | 8.06e-30 | -9.50e-01 | 0.1241 |
| 3512 | JCHAIN | sample1 | Human | Cervix | CC | 2.87e-11 | -9.16e-01 | 0.0959 |
| 3512 | JCHAIN | sample3 | Human | Cervix | CC | 8.06e-30 | -9.50e-01 | 0.1387 |
| 3512 | JCHAIN | H2 | Human | Cervix | HSIL_HPV | 3.32e-20 | -7.96e-01 | 0.0632 |
| 3512 | JCHAIN | L1 | Human | Cervix | CC | 9.18e-03 | -5.63e-01 | 0.0802 |
| 3512 | JCHAIN | T1 | Human | Cervix | CC | 4.43e-18 | -7.83e-01 | 0.0918 |
| 3512 | JCHAIN | T2 | Human | Cervix | CC | 6.47e-05 | -6.69e-01 | 0.0709 |
| 3512 | JCHAIN | T3 | Human | Cervix | CC | 1.30e-32 | -9.47e-01 | 0.1389 |
| 3512 | JCHAIN | HTA11_347_2000001011 | Human | Colorectum | AD | 2.23e-06 | 2.06e-01 | -0.1954 |
| Page: 1 2 3 4 |
| Tissue | Expression Dynamics | Abbreviation |
| Cervix |  | CC: Cervix cancer |
| HSIL_HPV: HPV-infected high-grade squamous intraepithelial lesions | ||
| N_HPV: HPV-infected normal cervix | ||
| Colorectum (GSE201348) | 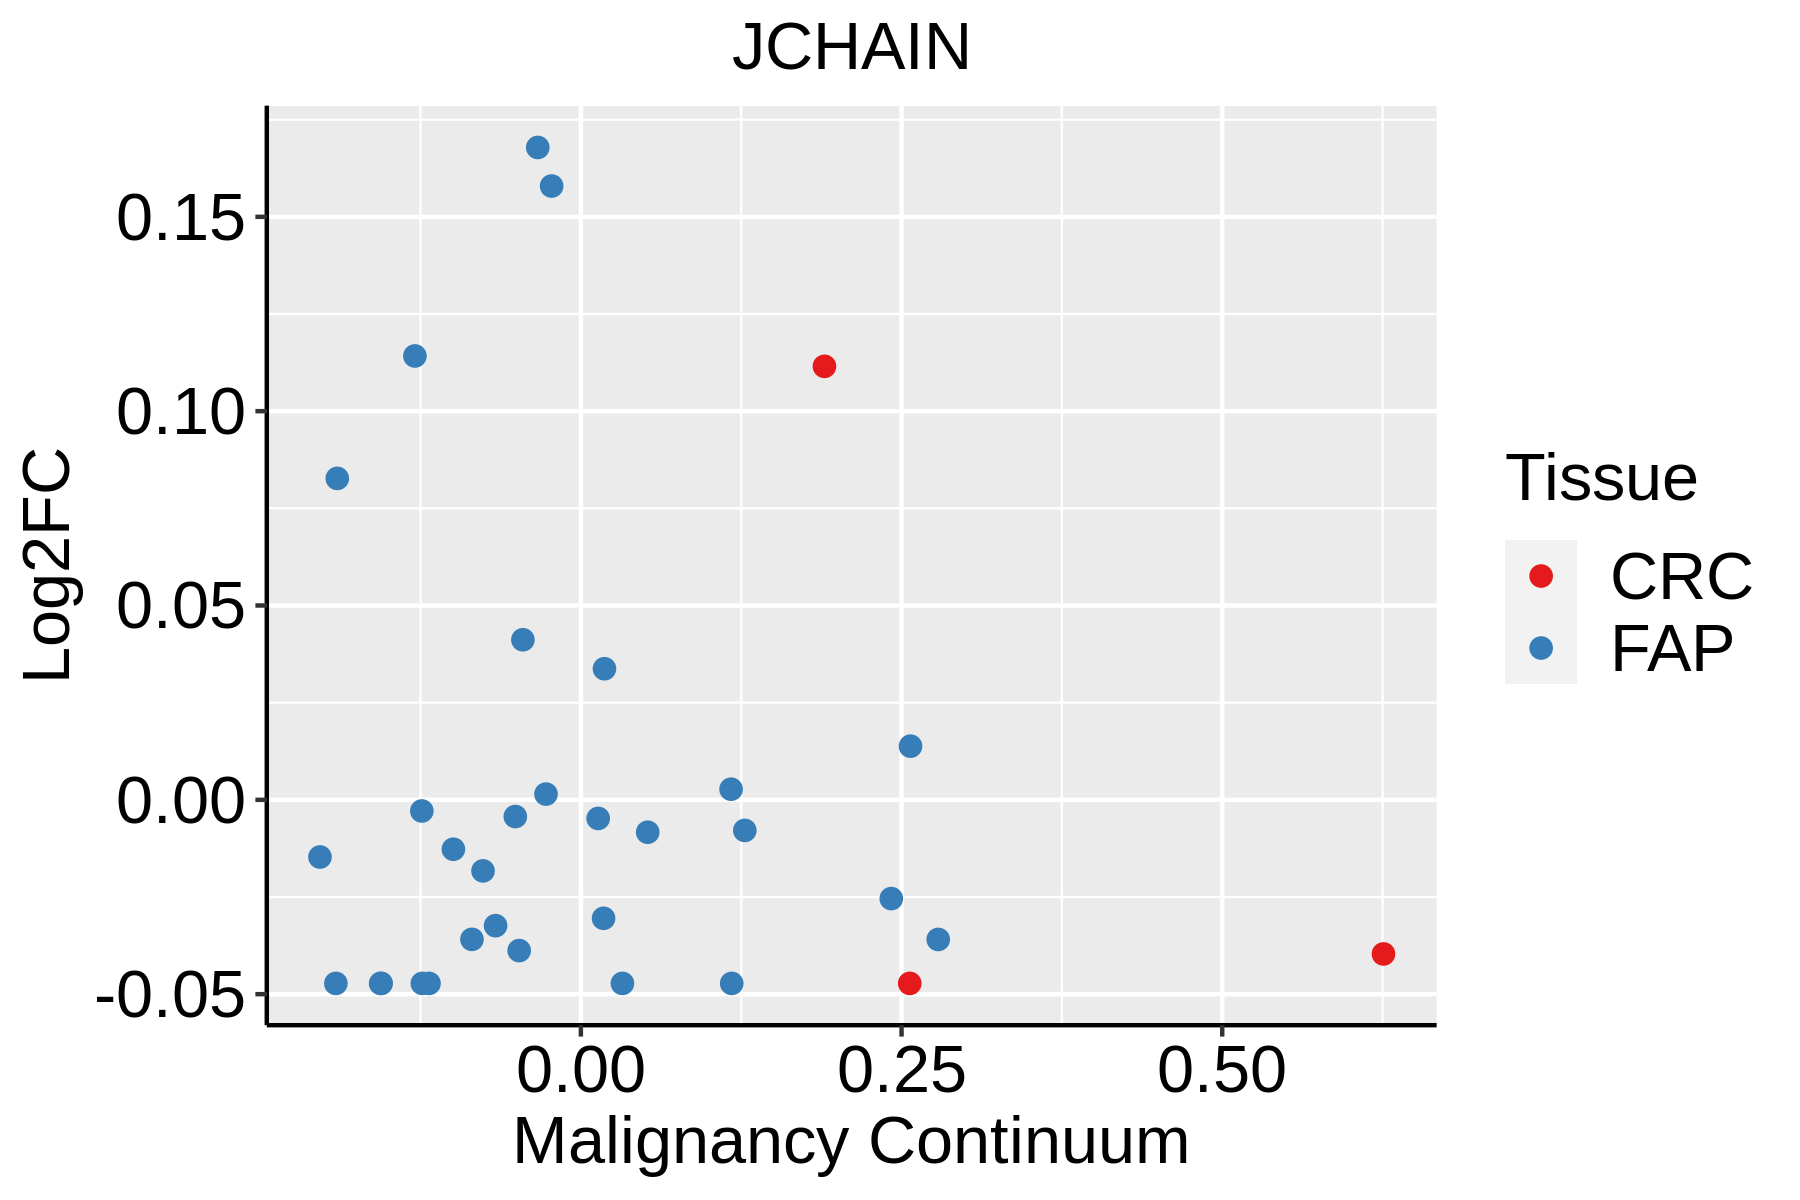 | FAP: Familial adenomatous polyposis |
| CRC: Colorectal cancer | ||
| Colorectum (HTA11) |  | AD: Adenomas |
| SER: Sessile serrated lesions | ||
| MSI-H: Microsatellite-high colorectal cancer | ||
| MSS: Microsatellite stable colorectal cancer | ||
| GC |  | CAG: Chronic atrophic gastritis |
| CAG with IM: Chronic atrophic gastritis with intestinal metaplasia | ||
| CSG: Chronic superficial gastritis | ||
| GC: Gastric cancer | ||
| SIM: Severe intestinal metaplasia | ||
| WIM: Wild intestinal metaplasia | ||
| Oral Cavity | 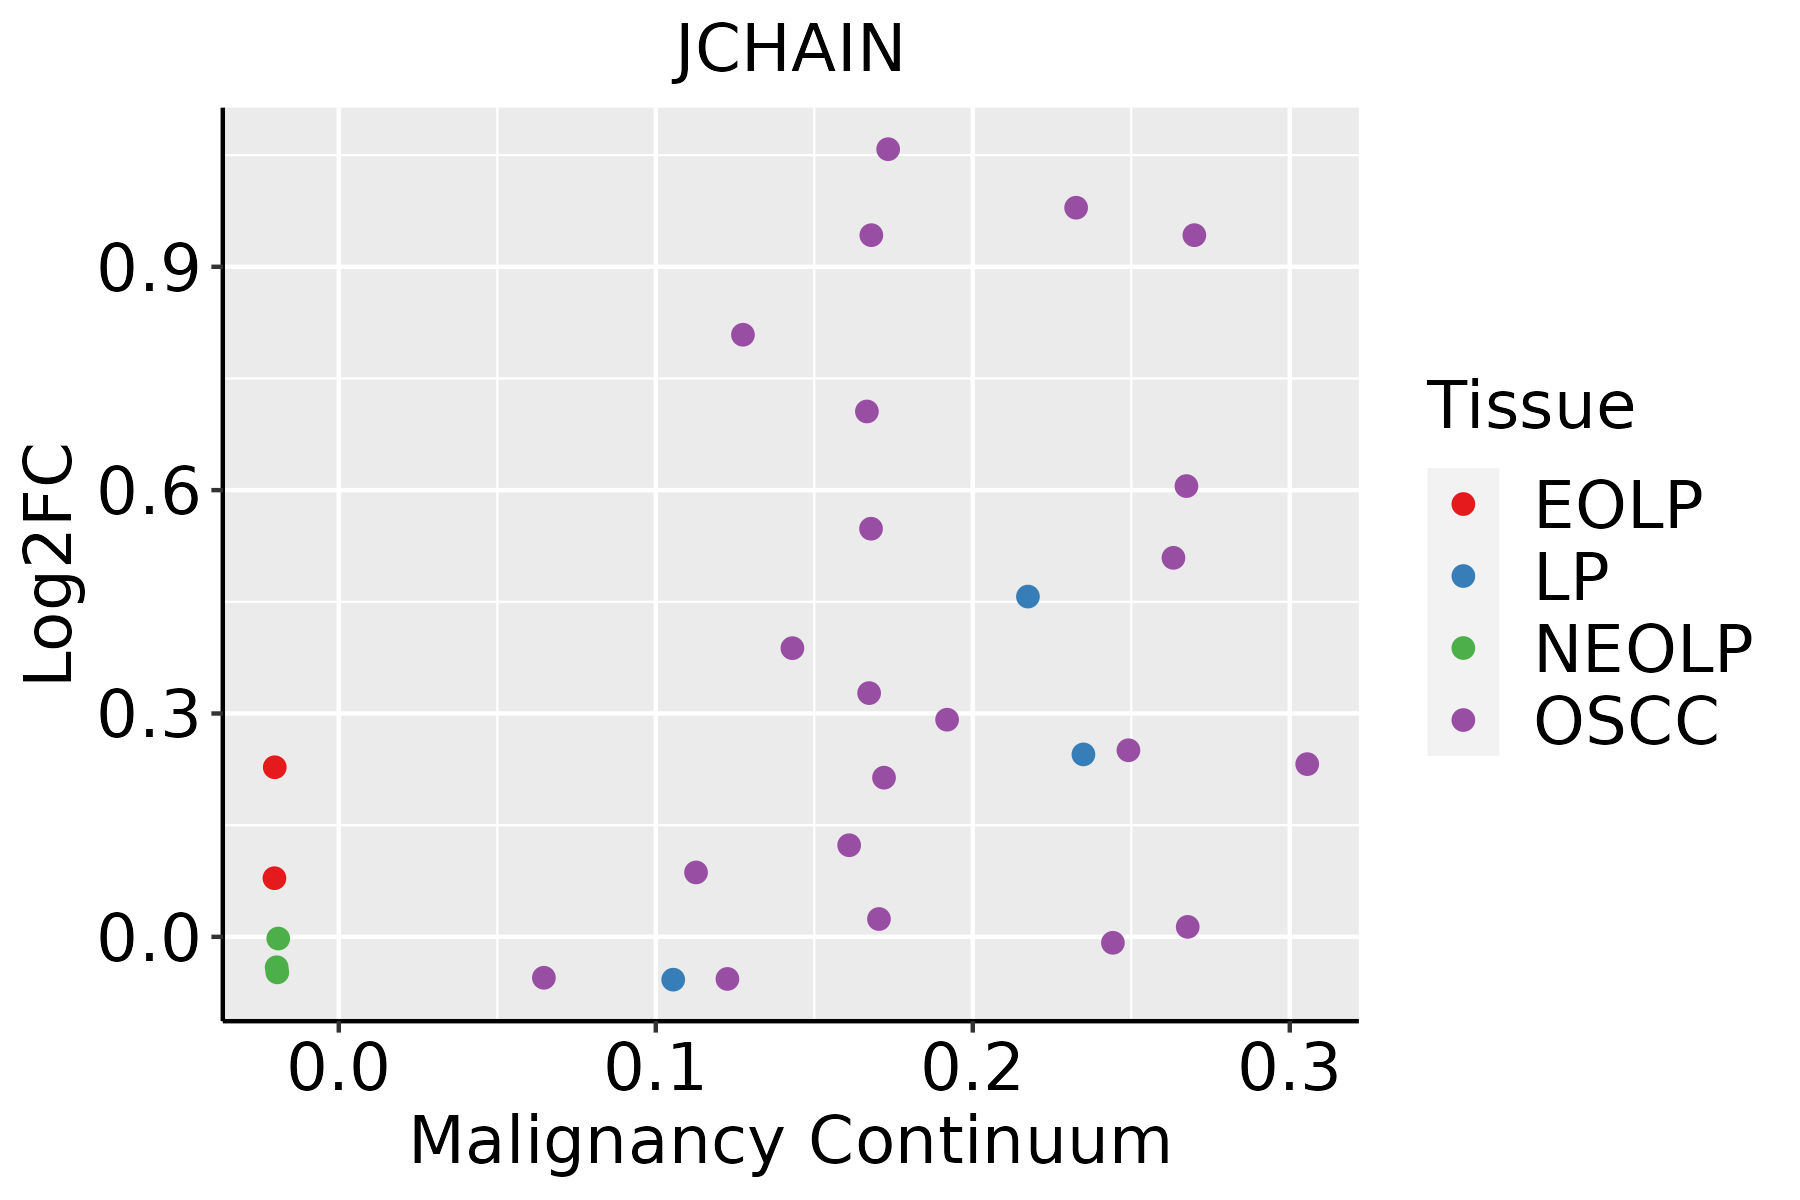 | EOLP: Erosive Oral lichen planus |
| LP: leukoplakia | ||
| NEOLP: Non-erosive oral lichen planus | ||
| OSCC: Oral squamous cell carcinoma | ||
| Thyroid | 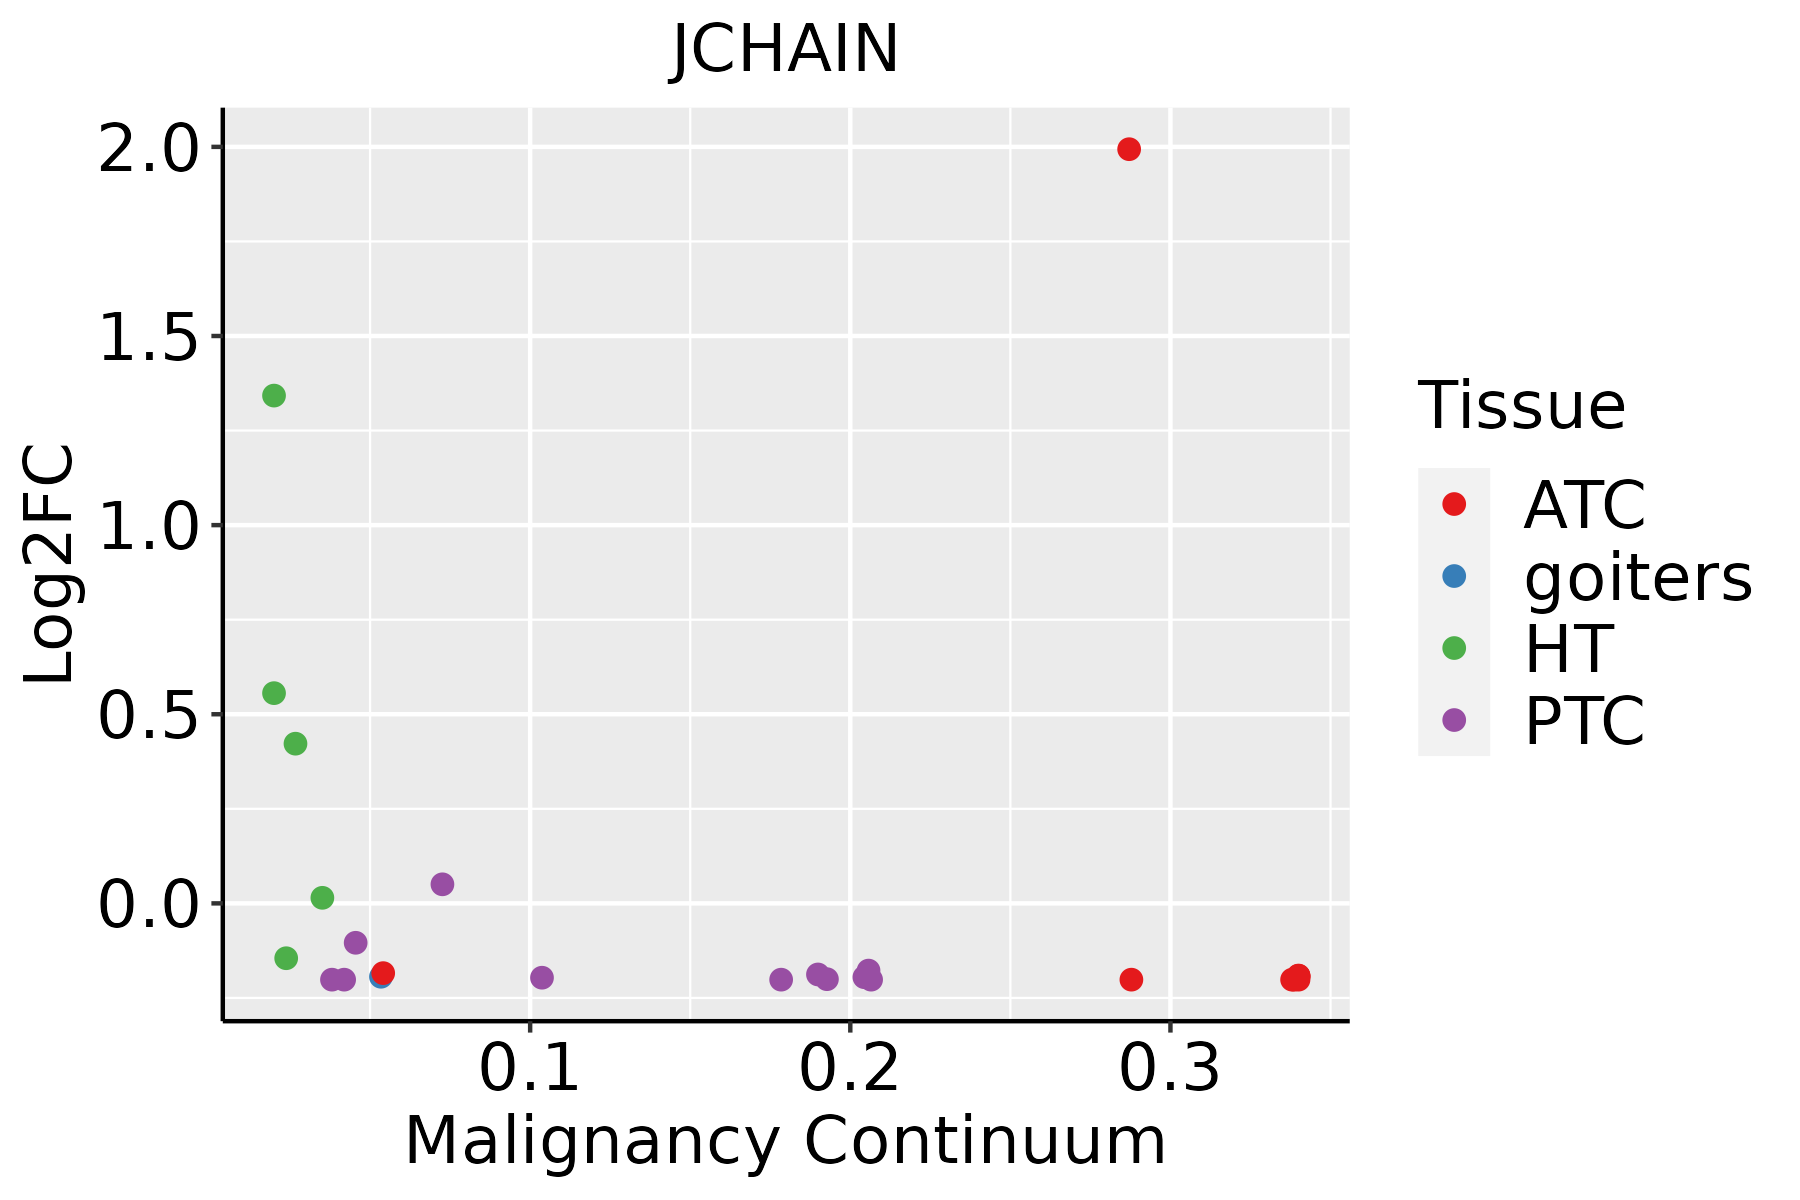 | ATC: Anaplastic thyroid cancer |
| HT: Hashimoto's thyroiditis | ||
| PTC: Papillary thyroid cancer |
| ∗log2FC in expression of this searched gene in stem-like cells from each diseased tissue sample relative to stem-like cells in normal samples in each tissue plotted against the malignancy continuum. Samples are colored based on if they are from different disease stage. |
Top |
Malignant transformation related pathway analysis |
| Find out the enriched GO biological processes and KEGG pathways involved in transition from healthy to precancer to cancer |
| Tissue | Disease Stage | Enriched GO biological Processes |
| Colorectum | AD |  |
| Colorectum | SER |  |
| Colorectum | MSS |  |
| Colorectum | MSI-H |  |
| Colorectum | FAP |  |
| ∗Top 15 enriched GO BP terms are showed in the bar plot of each disease state in each tissue. Each row represents a significant GO biological process which is colored according to the -log10(p.adjust). |
| Page: 1 2 3 4 5 6 7 8 9 |
| GO ID | Tissue | Disease Stage | Description | Gene Ratio | Bg Ratio | pvalue | p.adjust | Count |
| GO:00018949 | Cervix | CC | tissue homeostasis | 57/2311 | 268/18723 | 2.43e-05 | 4.21e-04 | 57 |
| GO:00602498 | Cervix | CC | anatomical structure homeostasis | 63/2311 | 314/18723 | 6.03e-05 | 8.68e-04 | 63 |
| GO:00457306 | Cervix | CC | respiratory burst | 14/2311 | 37/18723 | 6.97e-05 | 9.81e-04 | 14 |
| GO:00197308 | Cervix | CC | antimicrobial humoral response | 27/2311 | 122/18723 | 1.70e-03 | 1.29e-02 | 27 |
| GO:00602634 | Cervix | CC | regulation of respiratory burst | 7/2311 | 17/18723 | 2.72e-03 | 1.85e-02 | 7 |
| GO:00018957 | Cervix | CC | retina homeostasis | 19/2311 | 79/18723 | 2.94e-03 | 1.94e-02 | 19 |
| GO:00069597 | Cervix | CC | humoral immune response | 54/2311 | 317/18723 | 8.57e-03 | 4.42e-02 | 54 |
| GO:000695912 | Cervix | HSIL_HPV | humoral immune response | 39/737 | 317/18723 | 2.88e-10 | 7.02e-08 | 39 |
| GO:001973012 | Cervix | HSIL_HPV | antimicrobial humoral response | 18/737 | 122/18723 | 1.35e-06 | 6.21e-05 | 18 |
| GO:004573013 | Cervix | HSIL_HPV | respiratory burst | 9/737 | 37/18723 | 9.97e-06 | 3.41e-04 | 9 |
| GO:000189512 | Cervix | HSIL_HPV | retina homeostasis | 12/737 | 79/18723 | 5.76e-05 | 1.39e-03 | 12 |
| GO:00427423 | Cervix | HSIL_HPV | defense response to bacterium | 30/737 | 350/18723 | 5.82e-05 | 1.40e-03 | 30 |
| GO:000189414 | Cervix | HSIL_HPV | tissue homeostasis | 25/737 | 268/18723 | 6.17e-05 | 1.46e-03 | 25 |
| GO:00030943 | Cervix | HSIL_HPV | glomerular filtration | 6/737 | 25/18723 | 3.40e-04 | 5.39e-03 | 6 |
| GO:00972054 | Cervix | HSIL_HPV | renal filtration | 6/737 | 26/18723 | 4.27e-04 | 6.41e-03 | 6 |
| GO:006024913 | Cervix | HSIL_HPV | anatomical structure homeostasis | 25/737 | 314/18723 | 7.04e-04 | 9.40e-03 | 25 |
| GO:00197315 | Cervix | HSIL_HPV | antibacterial humoral response | 8/737 | 60/18723 | 2.32e-03 | 2.30e-02 | 8 |
| GO:006026312 | Cervix | HSIL_HPV | regulation of respiratory burst | 4/737 | 17/18723 | 3.76e-03 | 3.30e-02 | 4 |
| GO:000695921 | Cervix | N_HPV | humoral immune response | 31/534 | 317/18723 | 2.53e-09 | 7.88e-07 | 31 |
| GO:001973022 | Cervix | N_HPV | antimicrobial humoral response | 16/534 | 122/18723 | 3.88e-07 | 2.60e-05 | 16 |
| Page: 1 2 3 4 5 |
| Pathway ID | Tissue | Disease Stage | Description | Gene Ratio | Bg Ratio | pvalue | p.adjust | qvalue | Count |
| Page: 1 |
Top |
Cell-cell communication analysis |
| Identification of potential cell-cell interactions between two cell types and their ligand-receptor pairs for different disease states |
| Ligand | Receptor | LRpair | Pathway | Tissue | Disease Stage |
| Page: 1 |
Top |
Single-cell gene regulatory network inference analysis |
| Find out the significant the regulons (TFs) and the target genes of each regulon across cell types for different disease states |
| TF | Cell Type | Tissue | Disease Stage | Target Gene | RSS | Regulon Activity |
| ∗The dot plots of a searched regulon are shown for all cell subpopulations in each disease state of each tissue based on the regulon specific score inferred using pySCENIC and by calculating the average expression. |
| Page: 1 |
Top |
Somatic mutation of malignant transformation related genes |
| Annotation of somatic variants for genes involved in malignant transformation |
| Hugo Symbol | Variant Class | Variant Classification | dbSNP RS | HGVSc | HGVSp | HGVSp Short | SWISSPROT | BIOTYPE | SIFT | PolyPhen | Tumor Sample Barcode | Tissue | Histology | Sex | Age | Stage | Therapy Types | Drugs | Outcome |
| JCHAIN | SNV | Missense_Mutation | c.316G>T | p.Val106Phe | p.V106F | P01591 | protein_coding | tolerated(0.48) | benign(0.009) | TCGA-AA-3510-01 | Colorectum | colon adenocarcinoma | Male | >=65 | I/II | Unknown | Unknown | SD | |
| JCHAIN | SNV | Missense_Mutation | novel | c.464C>A | p.Ala155Asp | p.A155D | P01591 | protein_coding | deleterious(0) | benign(0.085) | TCGA-AA-3842-01 | Colorectum | colon adenocarcinoma | Male | <65 | III/IV | Chemotherapy | folinic | PD |
| JCHAIN | SNV | Missense_Mutation | c.182N>A | p.Arg61Gln | p.R61Q | P01591 | protein_coding | tolerated(0.12) | probably_damaging(0.996) | TCGA-AA-A00N-01 | Colorectum | colon adenocarcinoma | Male | >=65 | I/II | Unknown | Unknown | PD | |
| JCHAIN | SNV | Missense_Mutation | c.239G>T | p.Arg80Ile | p.R80I | P01591 | protein_coding | deleterious(0) | probably_damaging(0.999) | TCGA-CA-6718-01 | Colorectum | colon adenocarcinoma | Male | <65 | I/II | Unknown | Unknown | PD | |
| JCHAIN | SNV | Missense_Mutation | c.182N>A | p.Arg61Gln | p.R61Q | P01591 | protein_coding | tolerated(0.12) | probably_damaging(0.996) | TCGA-AG-A002-01 | Colorectum | rectum adenocarcinoma | Male | <65 | I/II | Unknown | Unknown | SD | |
| JCHAIN | SNV | Missense_Mutation | novel | c.317T>C | p.Val106Ala | p.V106A | P01591 | protein_coding | tolerated(0.25) | benign(0.027) | TCGA-EI-6917-01 | Colorectum | rectum adenocarcinoma | Male | <65 | III/IV | Chemotherapy | 5fluorouracil+oxaciplatina+l-folinian | SD |
| JCHAIN | SNV | Missense_Mutation | rs775844392 | c.245G>T | p.Arg82Ile | p.R82I | P01591 | protein_coding | deleterious(0.02) | benign(0.052) | TCGA-A5-A0G2-01 | Endometrium | uterine corpus endometrioid carcinoma | Female | <65 | III/IV | Unknown | Unknown | SD |
| JCHAIN | SNV | Missense_Mutation | rs201053863 | c.239N>A | p.Arg80Lys | p.R80K | P01591 | protein_coding | deleterious(0) | probably_damaging(0.994) | TCGA-AJ-A5DW-01 | Endometrium | uterine corpus endometrioid carcinoma | Female | <65 | I/II | Unknown | Unknown | SD |
| JCHAIN | SNV | Missense_Mutation | c.182N>A | p.Arg61Gln | p.R61Q | P01591 | protein_coding | tolerated(0.12) | probably_damaging(0.996) | TCGA-AP-A056-01 | Endometrium | uterine corpus endometrioid carcinoma | Female | <65 | I/II | Unknown | Unknown | SD | |
| JCHAIN | SNV | Missense_Mutation | c.182G>A | p.Arg61Gln | p.R61Q | P01591 | protein_coding | tolerated(0.12) | probably_damaging(0.996) | TCGA-B5-A1MR-01 | Endometrium | uterine corpus endometrioid carcinoma | Female | >=65 | III/IV | Unknown | Unknown | SD |
| Page: 1 2 3 |
Top |
Related drugs of malignant transformation related genes |
| Identification of chemicals and drugs interact with genes involved in malignant transfromation |
| (DGIdb 4.0) |
| Entrez ID | Symbol | Category | Interaction Types | Drug Claim Name | Drug Name | PMIDs |
| Page: 1 |

Copyright 2023-Present -The University of Texas Health Science Center at Houston |