
|
|||||
|
 | |
| |
| |
| |
| |
| |
|
Gene: JAZF1 |
Gene summary for JAZF1 |
| Gene information | Species | Human | Gene symbol | JAZF1 | Gene ID | 221895 |
| Gene name | JAZF zinc finger 1 | |
| Gene Alias | TIP27 | |
| Cytomap | 7p15.2-p15.1 | |
| Gene Type | protein-coding | GO ID | GO:0000122 | UniProtAcc | Q86VZ6 |
Top |
Malignant transformation analysis |
| Identification of the aberrant gene expression in precancerous and cancerous lesions by comparing the gene expression of stem-like cells in diseased tissues with normal stem cells |
| Entrez ID | Symbol | Replicates | Species | Organ | Tissue | Adj P-value | Log2FC | Malignancy |
| 221895 | JAZF1 | AEH-subject1 | Human | Endometrium | AEH | 3.17e-11 | 3.37e-01 | -0.3059 |
| 221895 | JAZF1 | AEH-subject2 | Human | Endometrium | AEH | 8.51e-03 | 5.99e-02 | -0.2525 |
| 221895 | JAZF1 | AEH-subject3 | Human | Endometrium | AEH | 4.24e-16 | 3.64e-01 | -0.2576 |
| 221895 | JAZF1 | AEH-subject4 | Human | Endometrium | AEH | 1.17e-14 | 4.86e-01 | -0.2657 |
| 221895 | JAZF1 | AEH-subject5 | Human | Endometrium | AEH | 2.21e-22 | 5.60e-01 | -0.2953 |
| 221895 | JAZF1 | EEC-subject1 | Human | Endometrium | EEC | 5.56e-16 | 4.68e-01 | -0.2682 |
| 221895 | JAZF1 | EEC-subject2 | Human | Endometrium | EEC | 1.48e-06 | 1.26e-01 | -0.2607 |
| 221895 | JAZF1 | EEC-subject3 | Human | Endometrium | EEC | 5.16e-16 | 1.56e-01 | -0.2525 |
| 221895 | JAZF1 | EEC-subject4 | Human | Endometrium | EEC | 6.35e-15 | 4.19e-01 | -0.2571 |
| 221895 | JAZF1 | EEC-subject5 | Human | Endometrium | EEC | 2.01e-07 | 2.31e-01 | -0.249 |
| 221895 | JAZF1 | GSM5276934 | Human | Endometrium | EEC | 5.24e-14 | -2.26e-01 | -0.0913 |
| 221895 | JAZF1 | GSM5276935 | Human | Endometrium | EEC | 2.74e-17 | -2.64e-01 | -0.123 |
| 221895 | JAZF1 | GSM5276937 | Human | Endometrium | EEC | 1.85e-05 | -2.42e-01 | -0.0897 |
| 221895 | JAZF1 | GSM6177620_NYU_UCEC1_lib1_lib1 | Human | Endometrium | EEC | 1.25e-13 | -2.22e-01 | -0.1869 |
| 221895 | JAZF1 | GSM6177620_NYU_UCEC1_lib2_lib2 | Human | Endometrium | EEC | 8.36e-28 | -1.86e-01 | -0.1875 |
| 221895 | JAZF1 | GSM6177620_NYU_UCEC1_lib3_lib3 | Human | Endometrium | EEC | 3.03e-12 | -2.82e-01 | -0.1883 |
| 221895 | JAZF1 | GSM6177621_NYU_UCEC2_lib1_lib1 | Human | Endometrium | EEC | 6.21e-17 | -1.83e-01 | -0.1934 |
| 221895 | JAZF1 | GSM6177622_NYU_UCEC3_lib1_lib1 | Human | Endometrium | EEC | 2.44e-20 | -2.96e-01 | -0.1917 |
| 221895 | JAZF1 | GSM6177622_NYU_UCEC3_lib2_lib2 | Human | Endometrium | EEC | 5.00e-16 | -2.76e-01 | -0.1916 |
| 221895 | JAZF1 | GSM6177623_NYU_UCEC3_Vis | Human | Endometrium | EEC | 3.96e-13 | -2.40e-01 | -0.1269 |
| Page: 1 2 3 4 5 |
| Tissue | Expression Dynamics | Abbreviation |
| Endometrium |  | AEH: Atypical endometrial hyperplasia |
| EEC: Endometrioid Cancer | ||
| Esophagus | 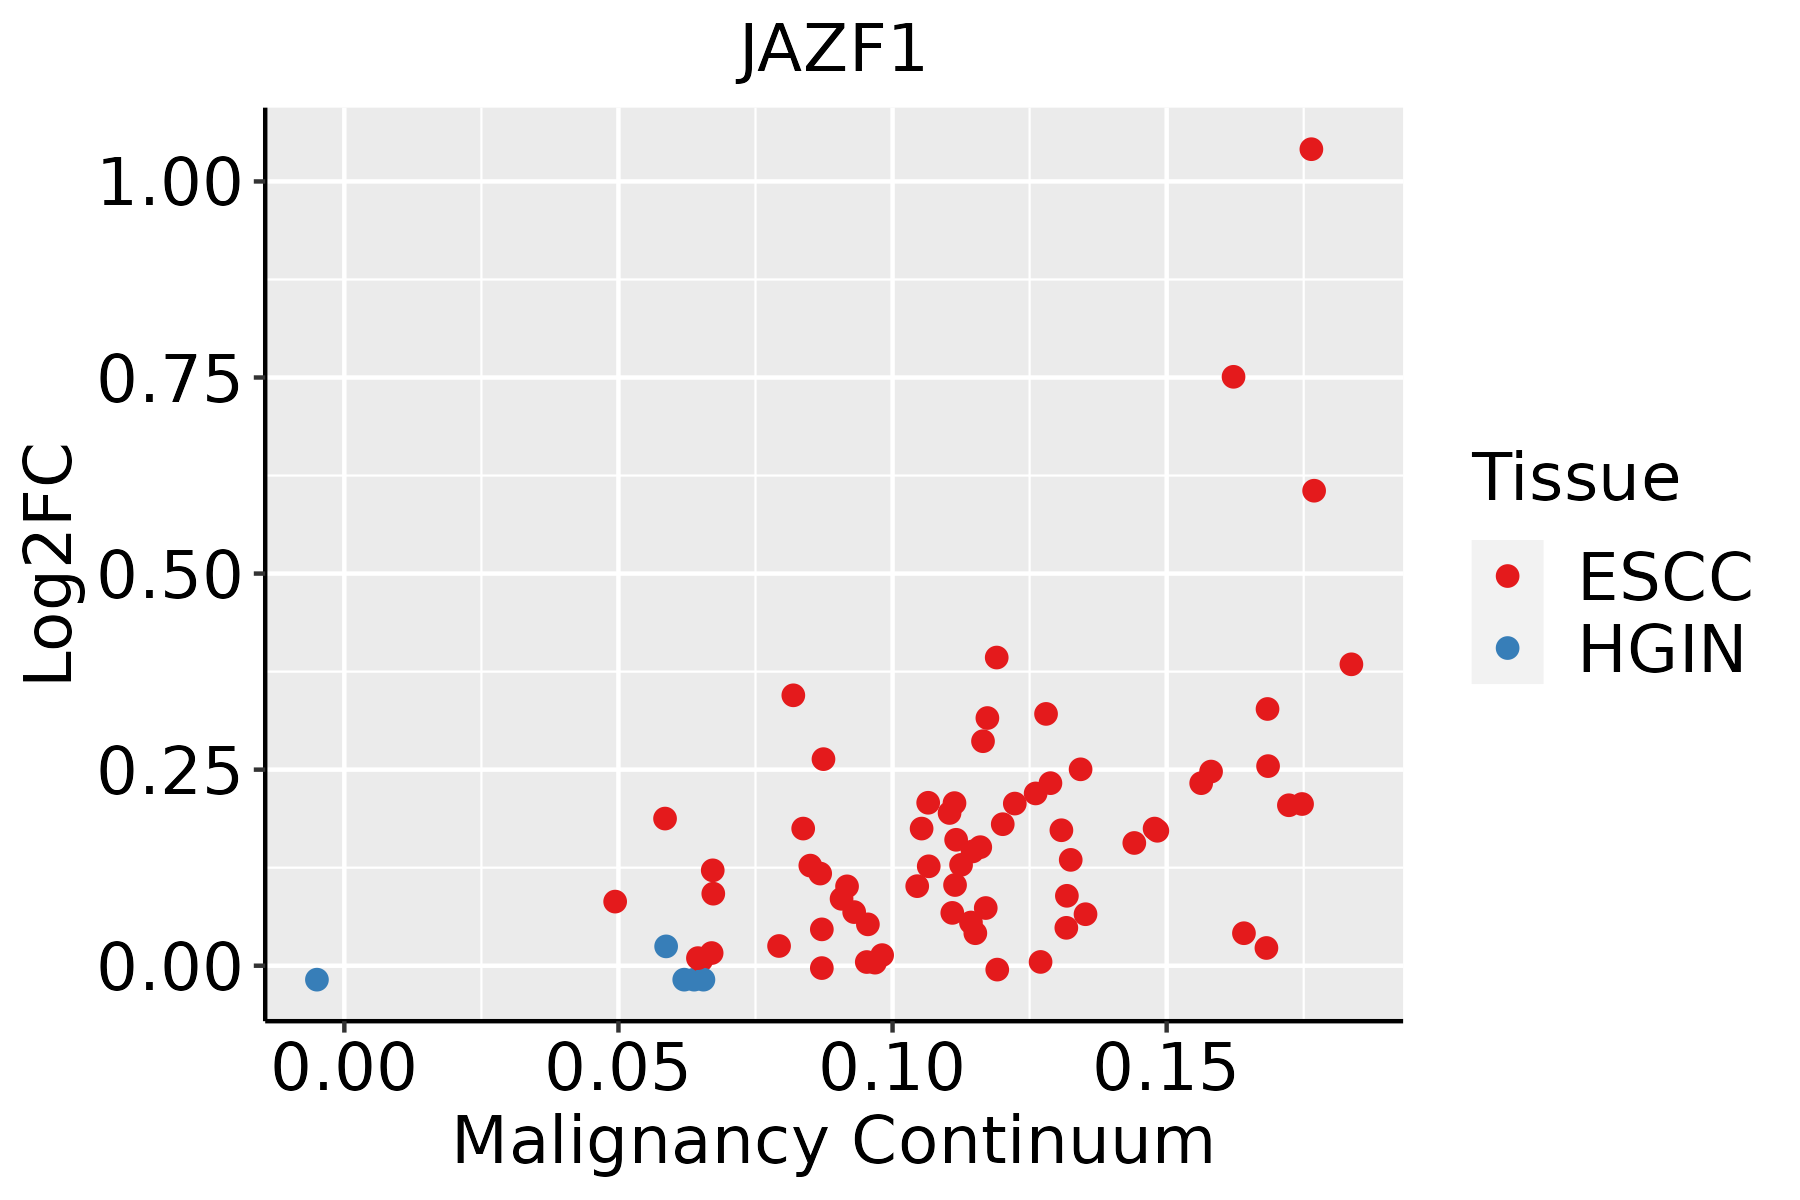 | ESCC: Esophageal squamous cell carcinoma |
| HGIN: High-grade intraepithelial neoplasias | ||
| LGIN: Low-grade intraepithelial neoplasias | ||
| Liver |  | HCC: Hepatocellular carcinoma |
| NAFLD: Non-alcoholic fatty liver disease | ||
| Lung | 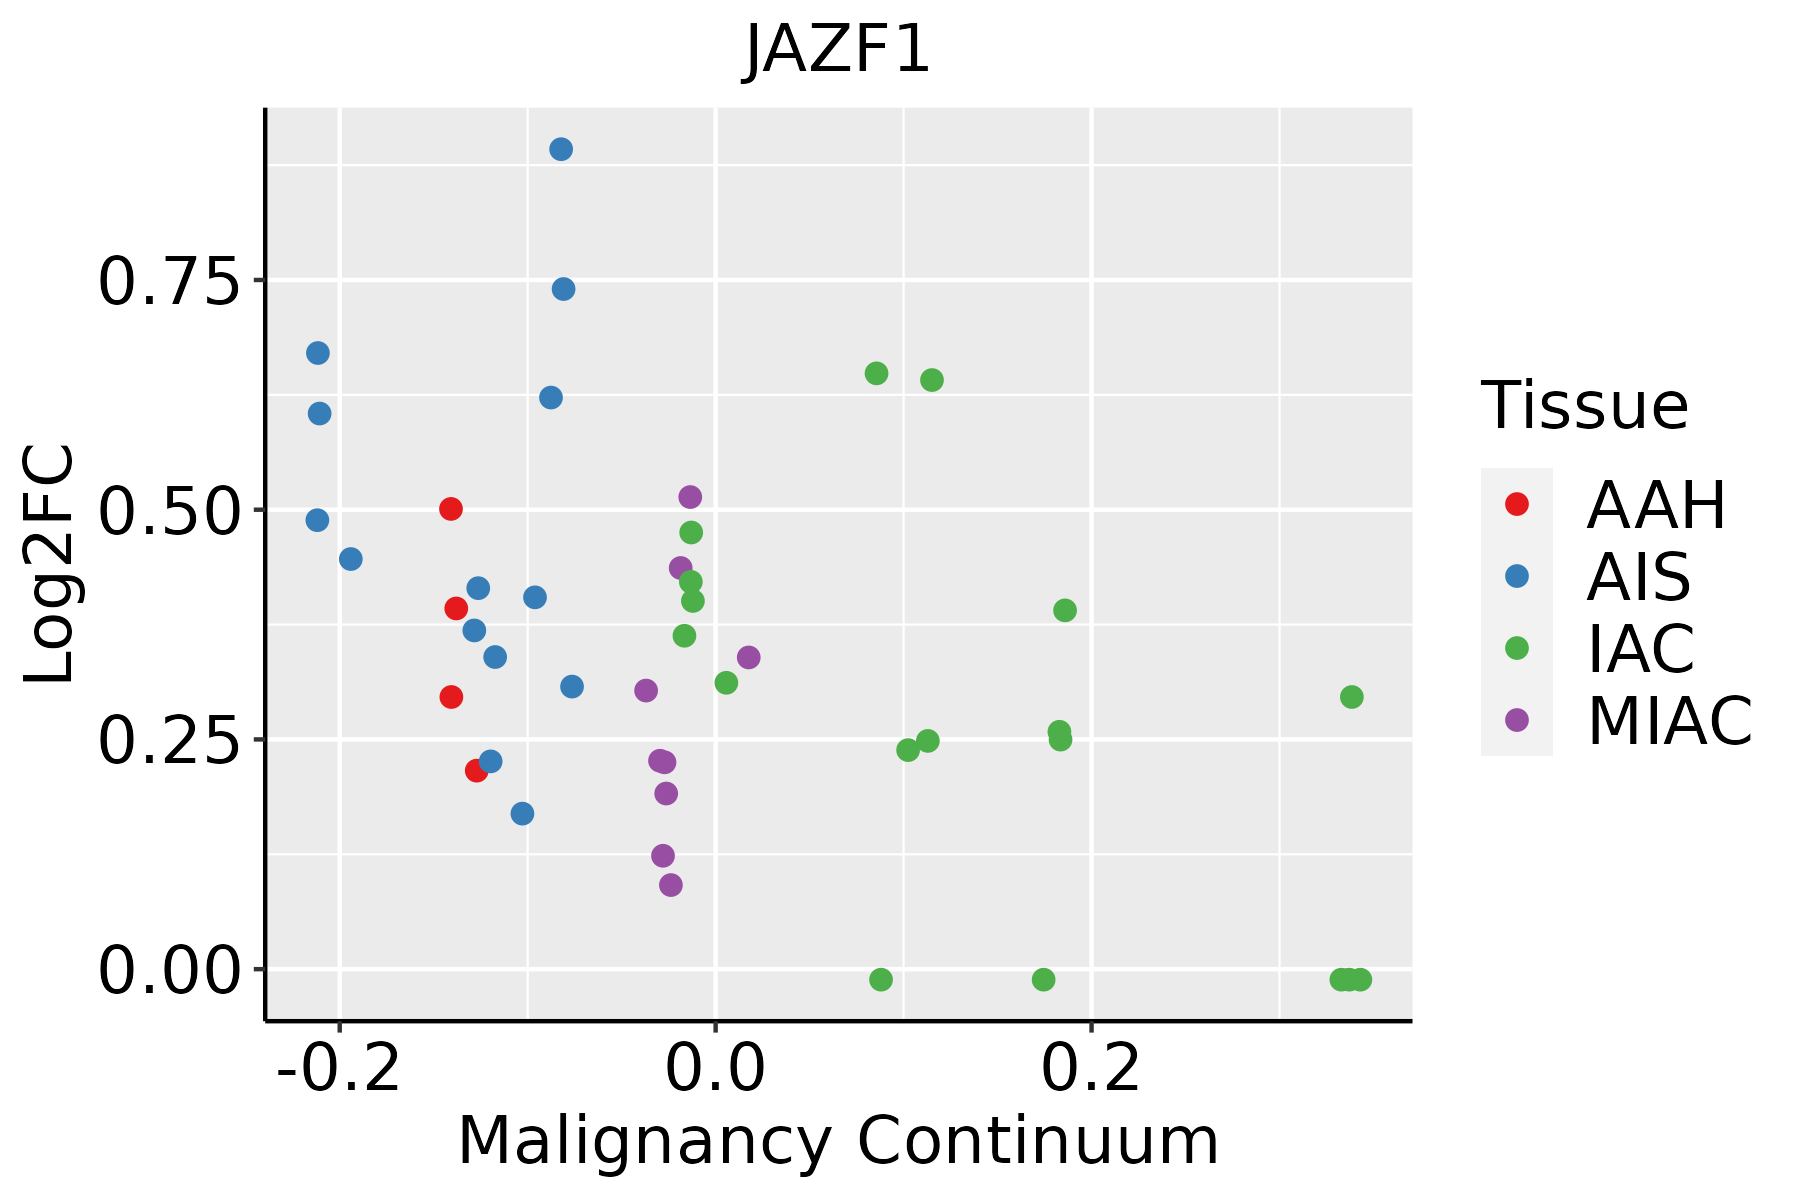 | AAH: Atypical adenomatous hyperplasia |
| AIS: Adenocarcinoma in situ | ||
| IAC: Invasive lung adenocarcinoma | ||
| MIA: Minimally invasive adenocarcinoma | ||
| Oral Cavity |  | EOLP: Erosive Oral lichen planus |
| LP: leukoplakia | ||
| NEOLP: Non-erosive oral lichen planus | ||
| OSCC: Oral squamous cell carcinoma |
| ∗log2FC in expression of this searched gene in stem-like cells from each diseased tissue sample relative to stem-like cells in normal samples in each tissue plotted against the malignancy continuum. Samples are colored based on if they are from different disease stage. |
Top |
Malignant transformation related pathway analysis |
| Find out the enriched GO biological processes and KEGG pathways involved in transition from healthy to precancer to cancer |
| Tissue | Disease Stage | Enriched GO biological Processes |
| Colorectum | AD |  |
| Colorectum | SER |  |
| Colorectum | MSS |  |
| Colorectum | MSI-H |  |
| Colorectum | FAP |  |
| ∗Top 15 enriched GO BP terms are showed in the bar plot of each disease state in each tissue. Each row represents a significant GO biological process which is colored according to the -log10(p.adjust). |
| Page: 1 2 3 4 5 6 7 8 9 |
| GO ID | Tissue | Disease Stage | Description | Gene Ratio | Bg Ratio | pvalue | p.adjust | Count |
| Page: 1 |
| Pathway ID | Tissue | Disease Stage | Description | Gene Ratio | Bg Ratio | pvalue | p.adjust | qvalue | Count |
| Page: 1 |
Top |
Cell-cell communication analysis |
| Identification of potential cell-cell interactions between two cell types and their ligand-receptor pairs for different disease states |
| Ligand | Receptor | LRpair | Pathway | Tissue | Disease Stage |
| Page: 1 |
Top |
Single-cell gene regulatory network inference analysis |
| Find out the significant the regulons (TFs) and the target genes of each regulon across cell types for different disease states |
| TF | Cell Type | Tissue | Disease Stage | Target Gene | RSS | Regulon Activity |
| ∗The dot plots of a searched regulon are shown for all cell subpopulations in each disease state of each tissue based on the regulon specific score inferred using pySCENIC and by calculating the average expression. |
| Page: 1 |
Top |
Somatic mutation of malignant transformation related genes |
| Annotation of somatic variants for genes involved in malignant transformation |
| Hugo Symbol | Variant Class | Variant Classification | dbSNP RS | HGVSc | HGVSp | HGVSp Short | SWISSPROT | BIOTYPE | SIFT | PolyPhen | Tumor Sample Barcode | Tissue | Histology | Sex | Age | Stage | Therapy Types | Drugs | Outcome |
| JAZF1 | SNV | Missense_Mutation | rs761995472 | c.701C>T | p.Ser234Leu | p.S234L | Q86VZ6 | protein_coding | tolerated_low_confidence(0.06) | probably_damaging(0.964) | TCGA-2W-A8YY-01 | Cervix | cervical & endocervical cancer | Female | <65 | I/II | Chemotherapy | cisplatin | CR |
| JAZF1 | SNV | Missense_Mutation | c.190N>A | p.Phe64Ile | p.F64I | Q86VZ6 | protein_coding | deleterious(0) | probably_damaging(0.962) | TCGA-JW-A5VL-01 | Cervix | cervical & endocervical cancer | Female | <65 | I/II | Unknown | Unknown | SD | |
| JAZF1 | SNV | Missense_Mutation | c.608G>A | p.Arg203His | p.R203H | Q86VZ6 | protein_coding | deleterious(0) | probably_damaging(0.989) | TCGA-A6-6653-01 | Colorectum | colon adenocarcinoma | Male | >=65 | I/II | Unknown | Unknown | SD | |
| JAZF1 | SNV | Missense_Mutation | c.254N>T | p.Ser85Leu | p.S85L | Q86VZ6 | protein_coding | deleterious(0.01) | benign(0.124) | TCGA-A6-6781-01 | Colorectum | colon adenocarcinoma | Male | <65 | III/IV | Chemotherapy | oxaliplatin | SD | |
| JAZF1 | SNV | Missense_Mutation | c.723N>A | p.Met241Ile | p.M241I | Q86VZ6 | protein_coding | tolerated_low_confidence(0.18) | benign(0) | TCGA-AA-3672-01 | Colorectum | colon adenocarcinoma | Female | >=65 | III/IV | Unknown | Unknown | SD | |
| JAZF1 | SNV | Missense_Mutation | c.305G>A | p.Arg102His | p.R102H | Q86VZ6 | protein_coding | tolerated(0.11) | probably_damaging(0.989) | TCGA-AZ-6601-01 | Colorectum | colon adenocarcinoma | Male | >=65 | I/II | Unknown | Unknown | PD | |
| JAZF1 | SNV | Missense_Mutation | novel | c.206N>T | p.Ala69Val | p.A69V | Q86VZ6 | protein_coding | tolerated(0.09) | probably_damaging(0.98) | TCGA-EI-6507-01 | Colorectum | rectum adenocarcinoma | Male | <65 | I/II | Unknown | Unknown | SD |
| JAZF1 | SNV | Missense_Mutation | c.305G>A | p.Arg102His | p.R102H | Q86VZ6 | protein_coding | tolerated(0.11) | probably_damaging(0.989) | TCGA-AP-A051-01 | Endometrium | uterine corpus endometrioid carcinoma | Female | >=65 | I/II | Unknown | Unknown | SD | |
| JAZF1 | SNV | Missense_Mutation | rs562255429 | c.667C>T | p.Arg223Trp | p.R223W | Q86VZ6 | protein_coding | deleterious(0) | probably_damaging(0.992) | TCGA-AX-A05Z-01 | Endometrium | uterine corpus endometrioid carcinoma | Female | <65 | III/IV | Chemotherapy | adriamycin | SD |
| JAZF1 | SNV | Missense_Mutation | c.304C>T | p.Arg102Cys | p.R102C | Q86VZ6 | protein_coding | deleterious(0.01) | probably_damaging(0.992) | TCGA-D1-A17B-01 | Endometrium | uterine corpus endometrioid carcinoma | Female | >=65 | I/II | Unknown | Unknown | SD |
| Page: 1 2 |
Top |
Related drugs of malignant transformation related genes |
| Identification of chemicals and drugs interact with genes involved in malignant transfromation |
| (DGIdb 4.0) |
| Entrez ID | Symbol | Category | Interaction Types | Drug Claim Name | Drug Name | PMIDs |
| Page: 1 |

Copyright 2023-Present -The University of Texas Health Science Center at Houston |