Schematic overview of the cellular and molecular mechanisms involved in the cancer progression, including the proposed cellular and molecular mechanisms in cancer cells trajectory. AT1: alveolar type 1 cells; AT2: alveolar type 2 cells; AAH: atypical adenomatous hyperplasia; AIS: adenocarcinoma in situ; MIA: minimally invasive adenocarcinoma; IA: invasive adenocarcinoma; EMT: epithelial-mesenchymal transition

Home

Download

Statistics

Help

Contact

Center for Computational Systems Medicine
leaf

Gene summary

leaf

Malignant transformation analysis

leaf

Malignant transformation related pathway analysis

leaf

Cell-cell communication analysis

leaf

Single-cell gene regulatory network inference analysis

leaf

Somatic mutation of malignant transformation related genes

leaf

Related drugs of malignant transformation related genes

Gene: JARID2

Gene summary for JARID2

check button Gene summary.

Gene informationSpeciesHuman
Gene symbol

JARID2

Gene ID

3720

Gene namejumonji and AT-rich interaction domain containing 2
Gene AliasJMJ
Cytomap6p22.3
Gene Typeprotein-coding
GO ID

GO:0000122

UniProtAcc

Q92833


Top

Malignant transformation analysis

check button Identification of the aberrant gene expression in precancerous and cancerous lesions by comparing the gene expression of stem-like cells in diseased tissues with normal stem cells
check button Malignant transformation involving gene list.
Entrez IDSymbolReplicatesSpeciesOrganTissueAdj P-valueLog2FCMalignancy
3720JARID2N_HPV_2HumanCervixN_HPV5.19e-031.39e-01-0.0131
3720JARID2CCI_1HumanCervixCC8.70e-151.62e+000.528
3720JARID2CCI_2HumanCervixCC3.84e-182.48e+000.5249
3720JARID2CCI_3HumanCervixCC1.45e-181.18e+000.516
3720JARID2HTA11_3410_2000001011HumanColorectumAD1.21e-19-5.20e-010.0155
3720JARID2HTA11_2487_2000001011HumanColorectumSER2.15e-06-5.22e-01-0.1808
3720JARID2HTA11_78_2000001011HumanColorectumAD1.80e-05-3.18e-01-0.1088
3720JARID2HTA11_3361_2000001011HumanColorectumAD1.32e-06-5.78e-01-0.1207
3720JARID2HTA11_2992_2000001011HumanColorectumSER2.26e-02-4.21e-01-0.1706
3720JARID2HTA11_5212_2000001011HumanColorectumAD1.26e-02-6.46e-01-0.2061
3720JARID2HTA11_5216_2000001011HumanColorectumSER1.10e-03-6.39e-01-0.1462
3720JARID2HTA11_546_2000001011HumanColorectumAD1.54e-08-3.33e-01-0.0842
3720JARID2HTA11_8622_2000001021HumanColorectumSER4.59e-02-4.72e-010.0528
3720JARID2HTA11_99999970781_79442HumanColorectumMSS7.46e-12-4.29e-010.294
3720JARID2HTA11_99999965104_69814HumanColorectumMSS1.40e-025.55e-010.281
3720JARID2HTA11_99999974143_84620HumanColorectumMSS5.31e-09-5.01e-010.3005
3720JARID2A001-C-207HumanColorectumFAP2.91e-02-2.62e-010.1278
3720JARID2A015-C-203HumanColorectumFAP1.11e-30-4.61e-01-0.1294
3720JARID2A015-C-204HumanColorectumFAP6.97e-07-4.21e-01-0.0228
3720JARID2A014-C-040HumanColorectumFAP1.02e-05-5.93e-01-0.1184
Page: 1 2 3 4 5 6 7 8 9 

check button Transcriptomic changes along malignancy continuum.
TissueExpression DynamicsAbbreviation
CervixThe image shows the transcriptomic changes along malignancy continuum.log2FC in expression of this searched gene in stem-like cells from each diseased tissue sample relative to stem-like cells in normal samples in each tissue plotted against the malignancy continuum. Samples are colored based on if they are from different disease stage.CC: Cervix cancer
HSIL_HPV: HPV-infected high-grade squamous intraepithelial lesions
N_HPV: HPV-infected normal cervix
Colorectum (GSE201348)The image shows the transcriptomic changes along malignancy continuum.log2FC in expression of this searched gene in stem-like cells from each diseased tissue sample relative to stem-like cells in normal samples in each tissue plotted against the malignancy continuum. Samples are colored based on if they are from different disease stage.FAP: Familial adenomatous polyposis
CRC: Colorectal cancer
Colorectum (HTA11)The image shows the transcriptomic changes along malignancy continuum.log2FC in expression of this searched gene in stem-like cells from each diseased tissue sample relative to stem-like cells in normal samples in each tissue plotted against the malignancy continuum. Samples are colored based on if they are from different disease stage.AD: Adenomas
SER: Sessile serrated lesions
MSI-H: Microsatellite-high colorectal cancer
MSS: Microsatellite stable colorectal cancer
EndometriumThe image shows the transcriptomic changes along malignancy continuum.log2FC in expression of this searched gene in stem-like cells from each diseased tissue sample relative to stem-like cells in normal samples in each tissue plotted against the malignancy continuum. Samples are colored based on if they are from different disease stage.
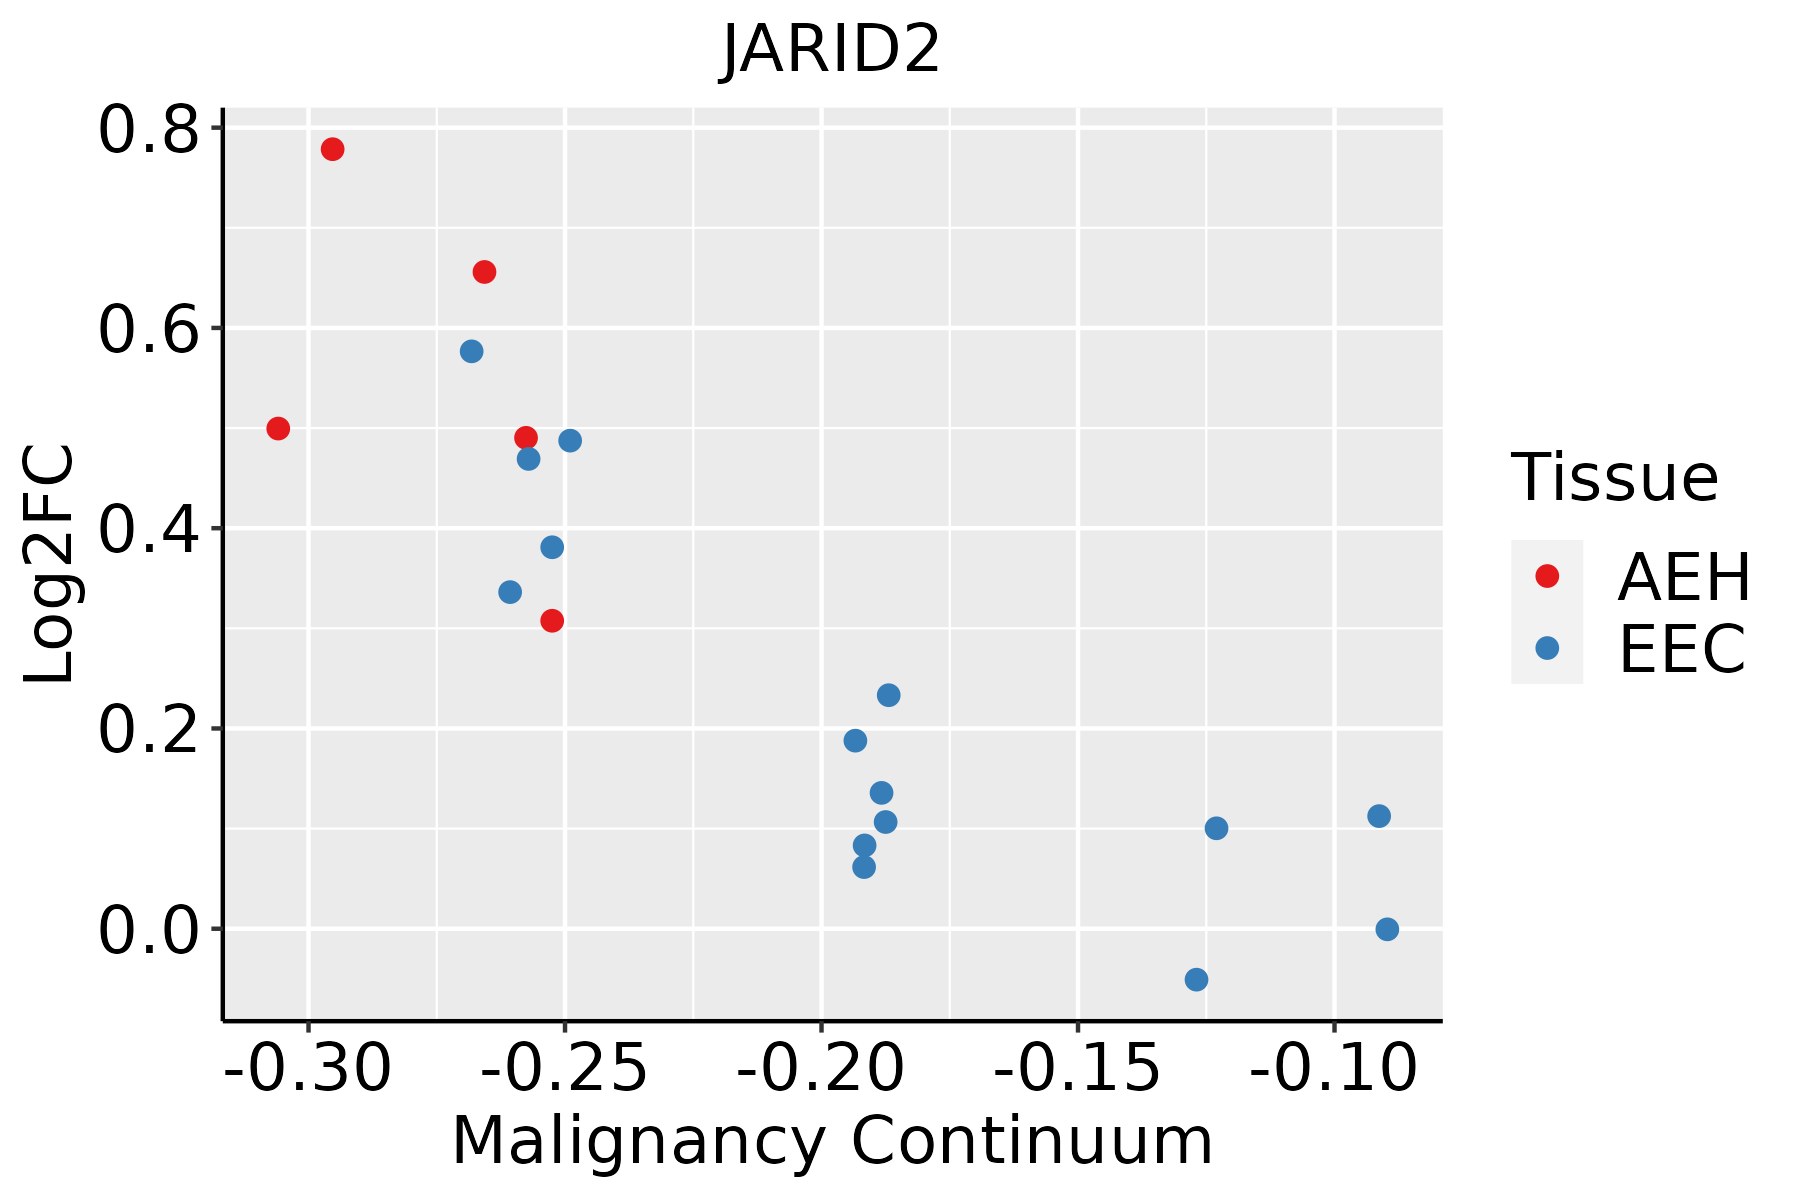
AEH: Atypical endometrial hyperplasia
EEC: Endometrioid Cancer
EsophagusThe image shows the transcriptomic changes along malignancy continuum.log2FC in expression of this searched gene in stem-like cells from each diseased tissue sample relative to stem-like cells in normal samples in each tissue plotted against the malignancy continuum. Samples are colored based on if they are from different disease stage.
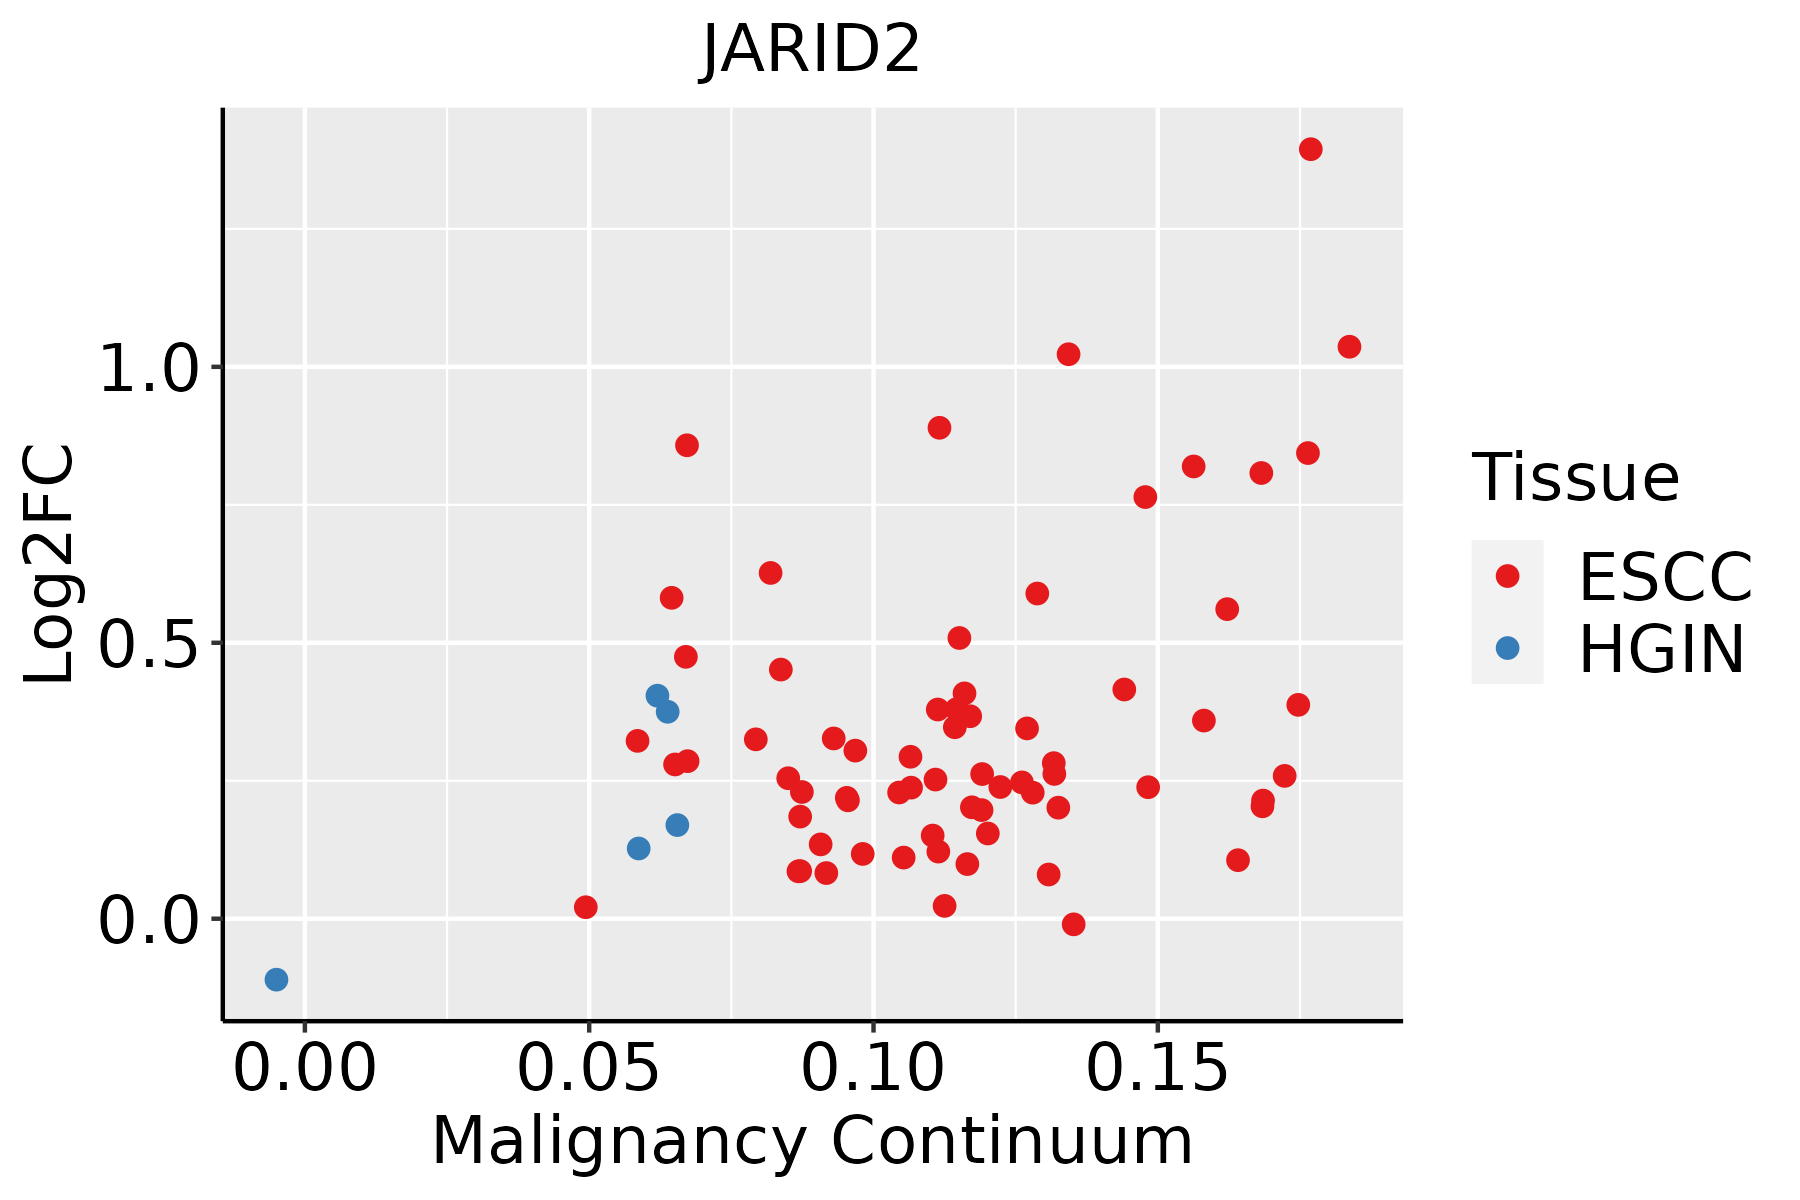
ESCC: Esophageal squamous cell carcinoma
HGIN: High-grade intraepithelial neoplasias
LGIN: Low-grade intraepithelial neoplasias
LungThe image shows the transcriptomic changes along malignancy continuum.log2FC in expression of this searched gene in stem-like cells from each diseased tissue sample relative to stem-like cells in normal samples in each tissue plotted against the malignancy continuum. Samples are colored based on if they are from different disease stage.
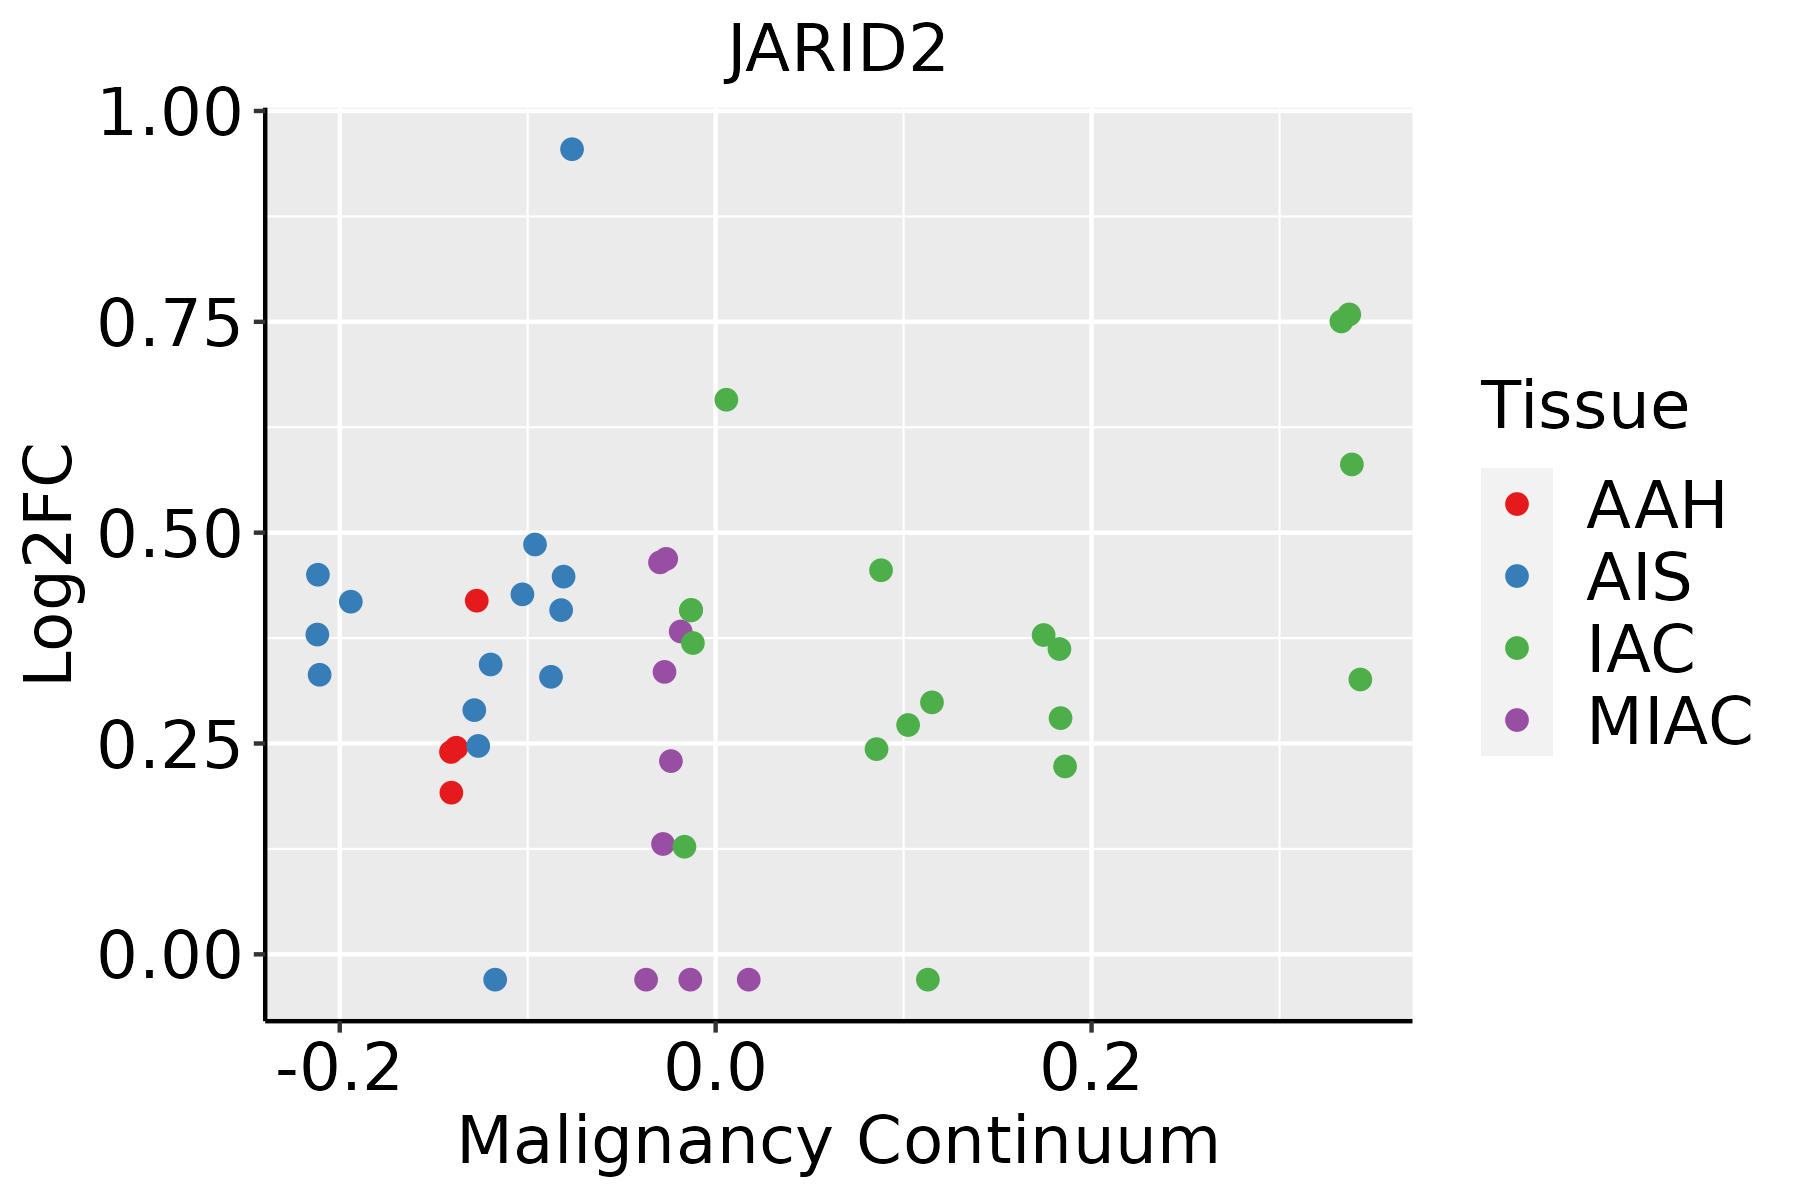
AAH: Atypical adenomatous hyperplasia
AIS: Adenocarcinoma in situ
IAC: Invasive lung adenocarcinoma
MIA: Minimally invasive adenocarcinoma
Oral CavityThe image shows the transcriptomic changes along malignancy continuum.log2FC in expression of this searched gene in stem-like cells from each diseased tissue sample relative to stem-like cells in normal samples in each tissue plotted against the malignancy continuum. Samples are colored based on if they are from different disease stage.EOLP: Erosive Oral lichen planus
LP: leukoplakia
NEOLP: Non-erosive oral lichen planus
OSCC: Oral squamous cell carcinoma
ProstateThe image shows the transcriptomic changes along malignancy continuum.log2FC in expression of this searched gene in stem-like cells from each diseased tissue sample relative to stem-like cells in normal samples in each tissue plotted against the malignancy continuum. Samples are colored based on if they are from different disease stage.
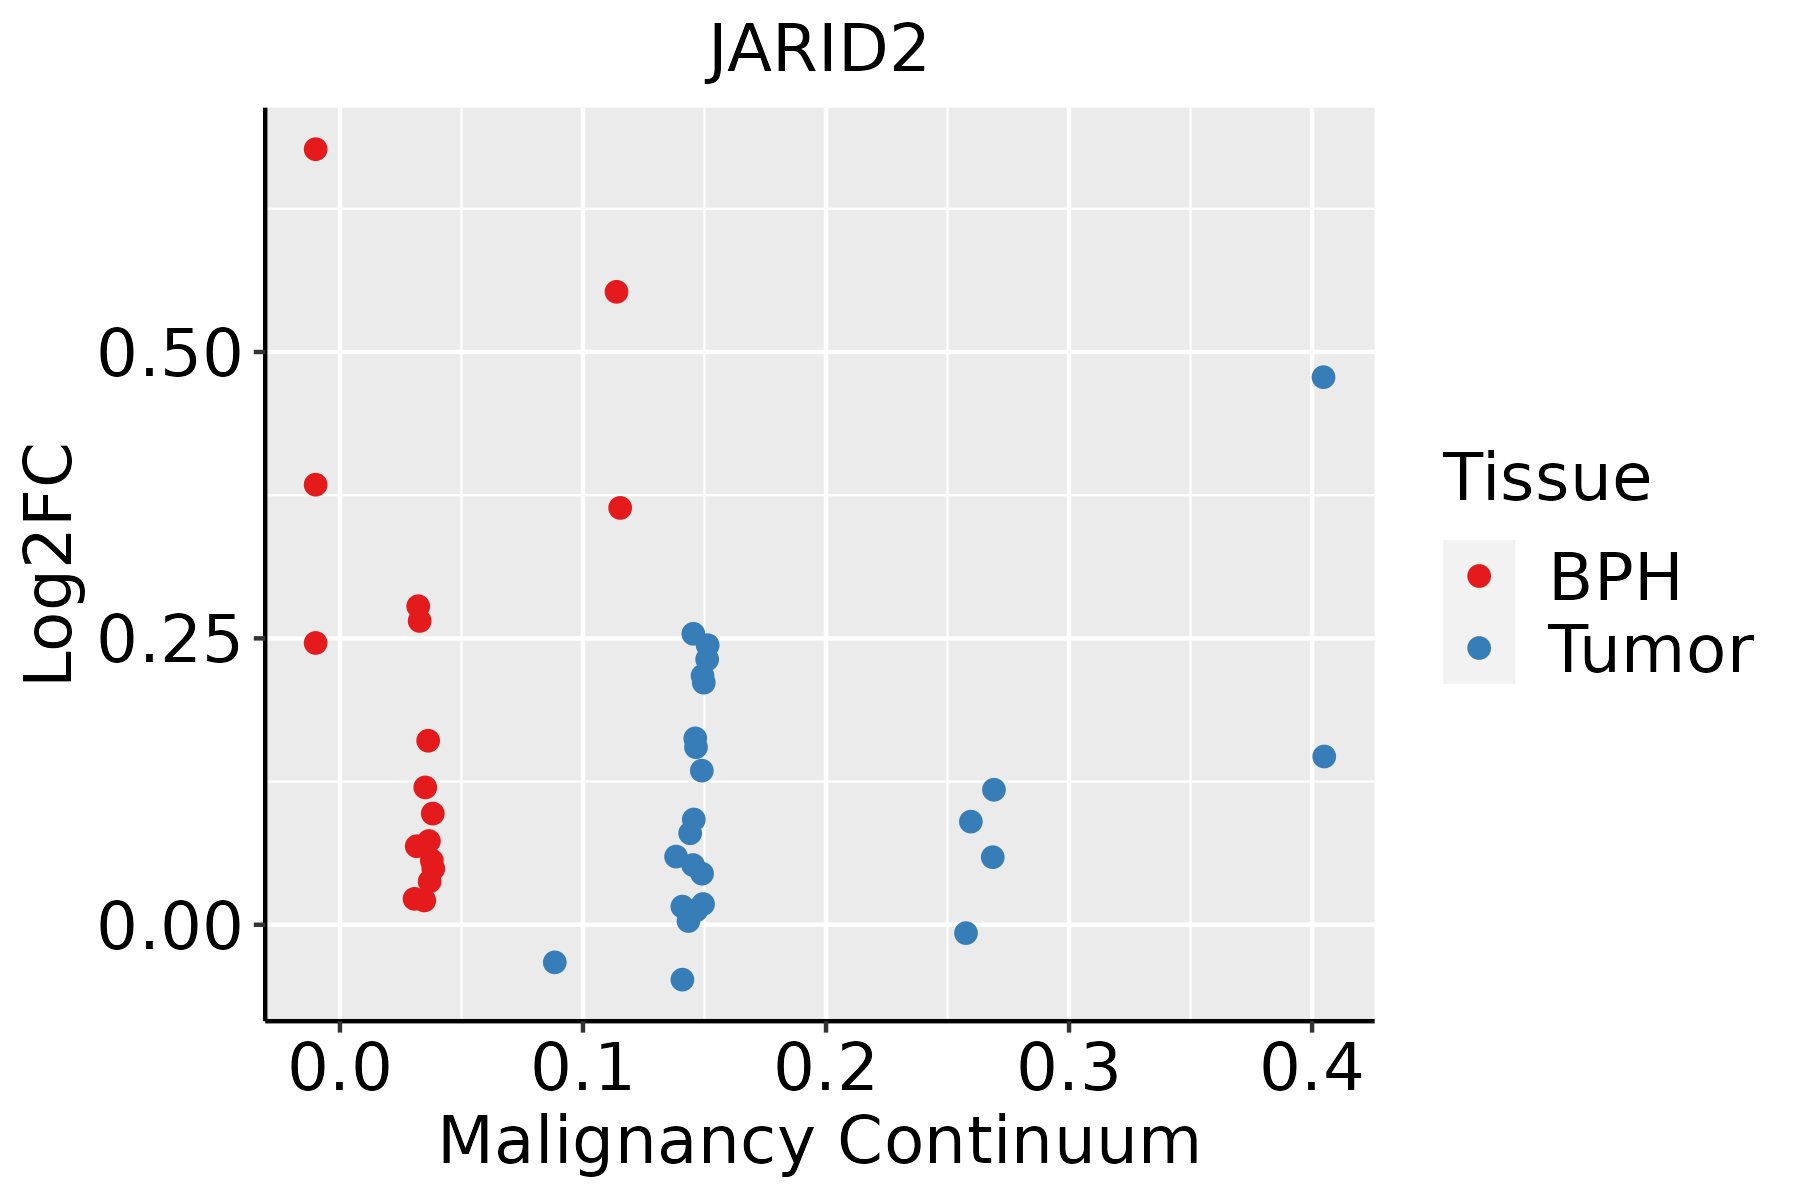
BPH: Benign Prostatic Hyperplasia
SkinThe image shows the transcriptomic changes along malignancy continuum.log2FC in expression of this searched gene in stem-like cells from each diseased tissue sample relative to stem-like cells in normal samples in each tissue plotted against the malignancy continuum. Samples are colored based on if they are from different disease stage.
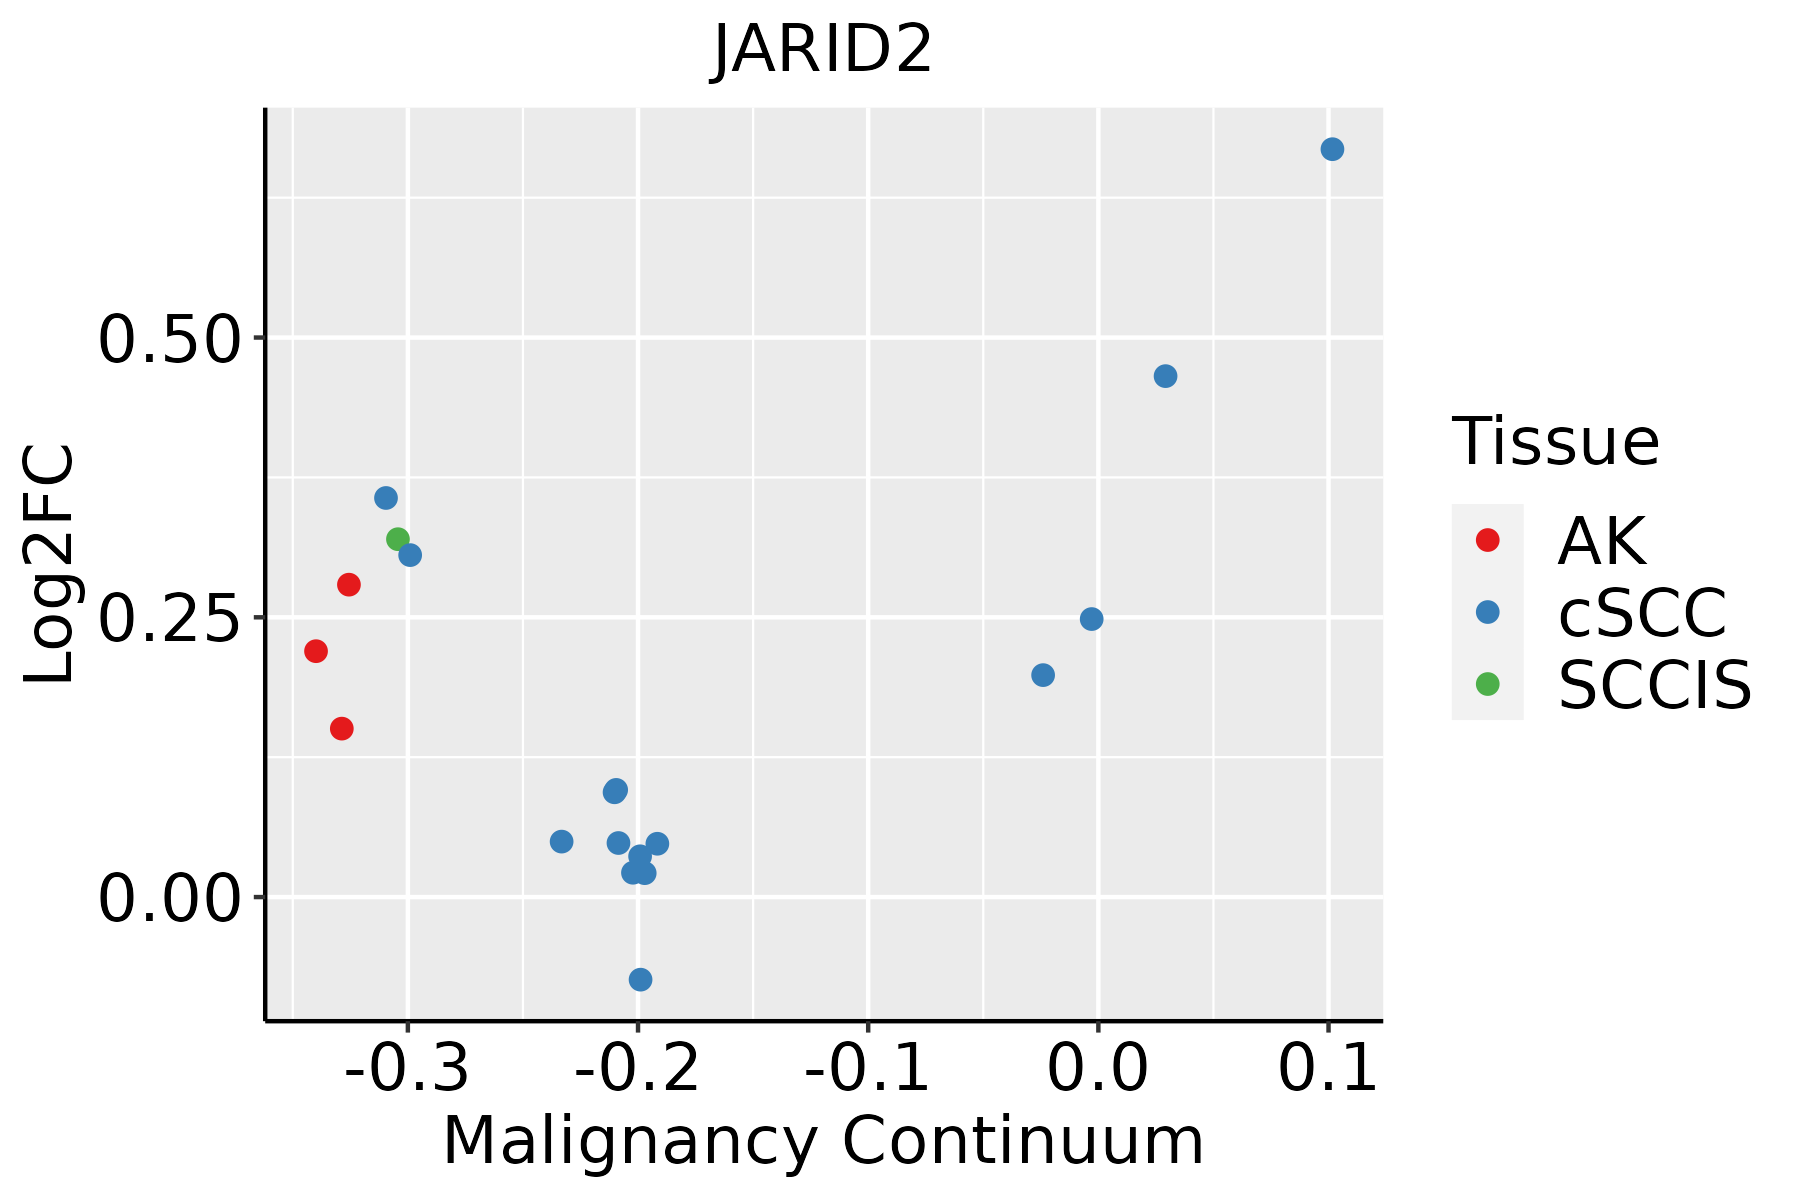
AK: Actinic keratosis
cSCC: Cutaneous squamous cell carcinoma
SCCIS:squamous cell carcinoma in situ
ThyroidThe image shows the transcriptomic changes along malignancy continuum.log2FC in expression of this searched gene in stem-like cells from each diseased tissue sample relative to stem-like cells in normal samples in each tissue plotted against the malignancy continuum. Samples are colored based on if they are from different disease stage.
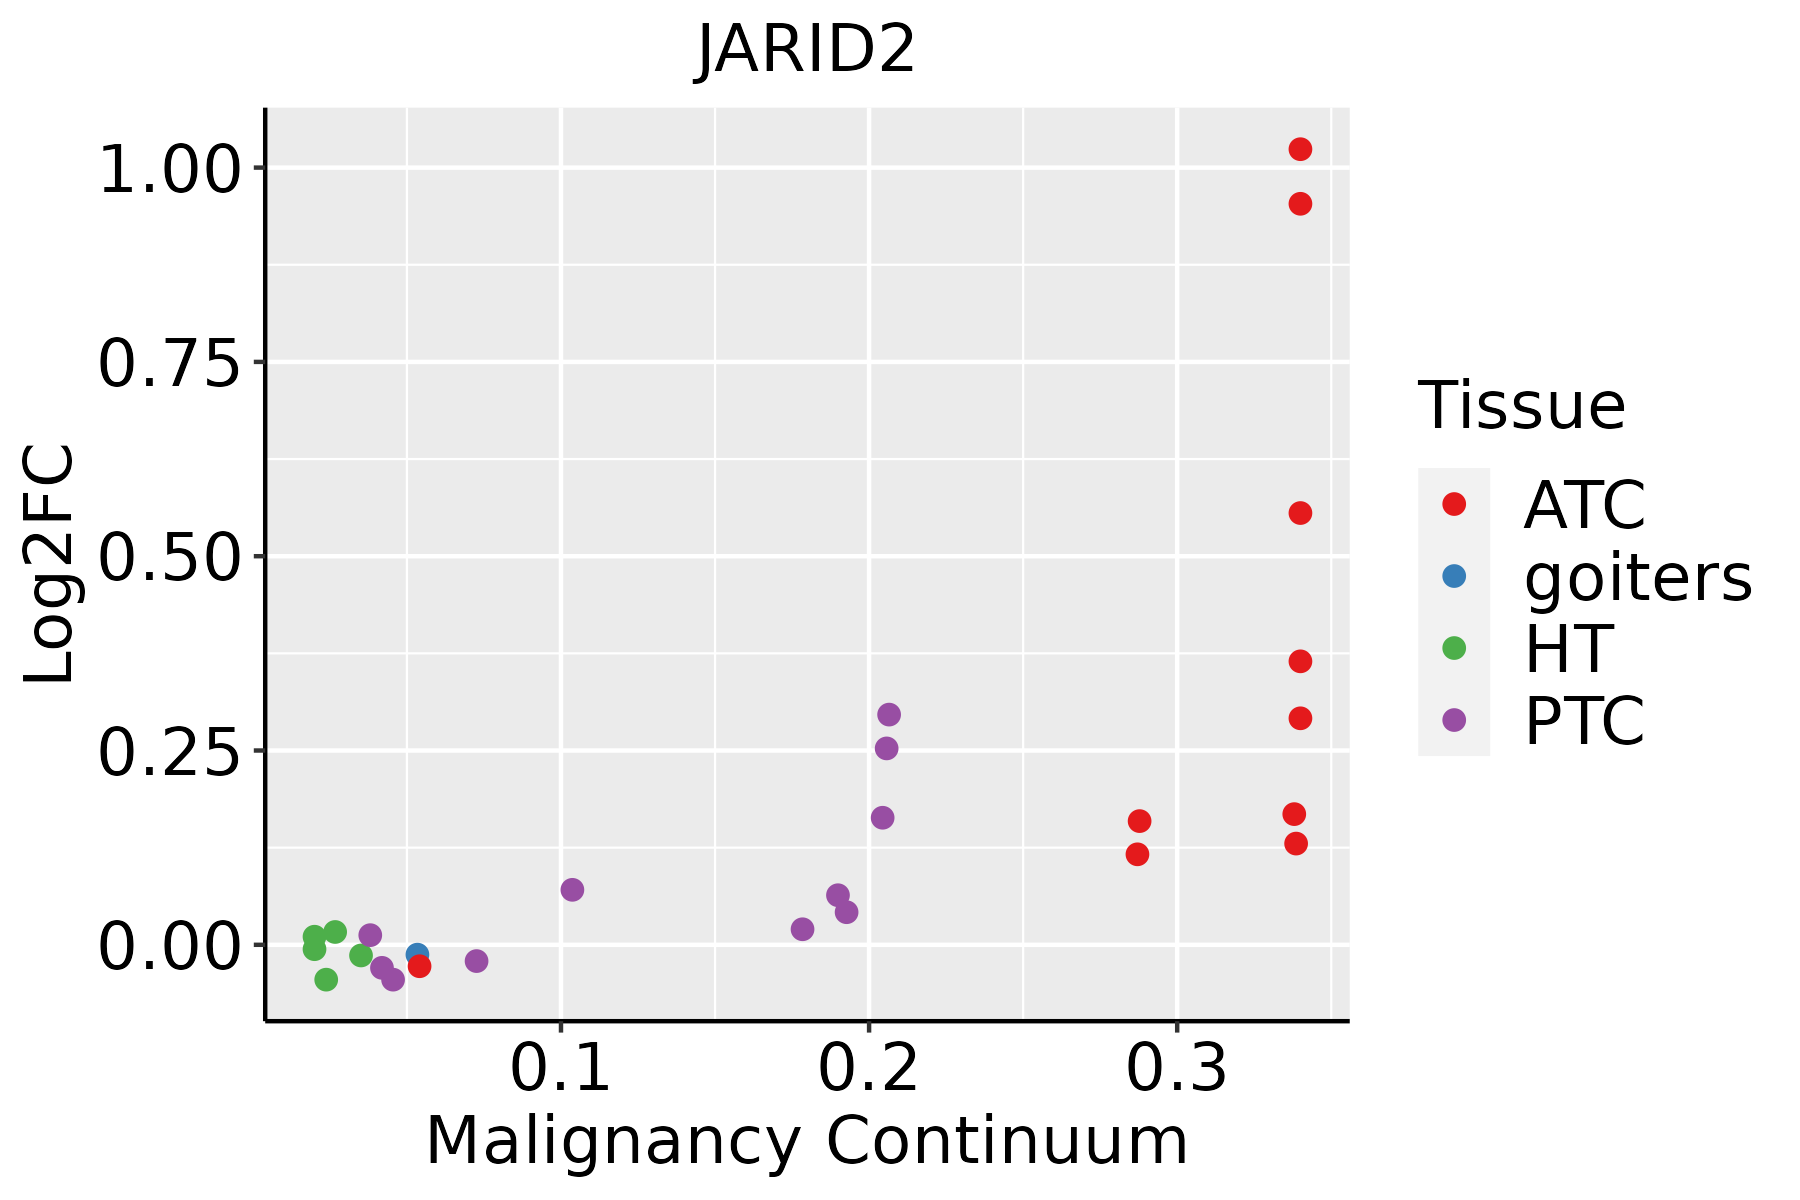
ATC: Anaplastic thyroid cancer
HT: Hashimoto's thyroiditis
PTC: Papillary thyroid cancer
∗log2FC in expression of this searched gene in stem-like cells from each diseased tissue sample relative to stem-like cells in normal samples in each tissue plotted against the malignancy continuum. Samples are colored based on if they are from different disease stage.

Top

Malignant transformation related pathway analysis

check buttonFind out the enriched GO biological processes and KEGG pathways involved in transition from healthy to precancer to cancer
check button Figure of enriched GO biological processes.
TissueDisease StageEnriched GO biological Processes
ColorectumADGO analysis - Figure of enriched GO biological processes: Top 15 enriched GO BP terms are showed in the bar plot of each disease state in each tissue. Each row represents a significant GO biological process which is colored according to the -log10(p.adjust).
ColorectumSERGO analysis - Figure of enriched GO biological processes: Top 15 enriched GO BP terms are showed in the bar plot of each disease state in each tissue. Each row represents a significant GO biological process which is colored according to the -log10(p.adjust).
ColorectumMSSGO analysis - Figure of enriched GO biological processes: Top 15 enriched GO BP terms are showed in the bar plot of each disease state in each tissue. Each row represents a significant GO biological process which is colored according to the -log10(p.adjust).
ColorectumMSI-HGO analysis - Figure of enriched GO biological processes: Top 15 enriched GO BP terms are showed in the bar plot of each disease state in each tissue. Each row represents a significant GO biological process which is colored according to the -log10(p.adjust).
ColorectumFAPGO analysis - Figure of enriched GO biological processes: Top 15 enriched GO BP terms are showed in the bar plot of each disease state in each tissue. Each row represents a significant GO biological process which is colored according to the -log10(p.adjust).
∗Top 15 enriched GO BP terms are showed in the bar plot of each disease state in each tissue. Each row represents a significant GO biological process which is colored according to the -log10(p.adjust).
Page: 1 2 3 4 5 6 7 8 9 

check button Enriched GO biological processes.
GO IDTissueDisease StageDescriptionGene RatioBg Ratiopvaluep.adjustCount
GO:004873210CervixCCgland development84/2311436/187231.93e-053.54e-0484
GO:00488634CervixCCstem cell differentiation46/2311206/187234.11e-056.36e-0446
GO:00063257CervixCCchromatin organization78/2311409/187235.40e-058.02e-0478
GO:00605375CervixCCmuscle tissue development76/2311403/187239.76e-051.27e-0376
GO:00165705CervixCChistone modification84/2311463/187231.70e-042.01e-0384
GO:00147064CervixCCstriated muscle tissue development72/2311384/187231.76e-042.07e-0372
GO:00610089CervixCChepaticobiliary system development34/2311150/187232.92e-043.14e-0334
GO:00018899CervixCCliver development33/2311147/187234.27e-044.30e-0333
GO:0033002CervixCCmuscle cell proliferation49/2311248/187235.43e-045.24e-0349
GO:00349685CervixCChistone lysine methylation27/2311115/187236.61e-046.09e-0327
GO:00486386CervixCCregulation of developmental growth61/2311330/187237.69e-046.85e-0361
GO:00310565CervixCCregulation of histone modification33/2311152/187237.97e-047.00e-0333
GO:00165715CervixCChistone methylation30/2311141/187231.88e-031.39e-0230
GO:19908234CervixCCresponse to leukemia inhibitory factor22/231195/187232.40e-031.70e-0222
GO:00180224CervixCCpeptidyl-lysine methylation28/2311131/187232.43e-031.71e-0228
GO:00064795CervixCCprotein methylation36/2311181/187232.46e-031.71e-0236
GO:00082135CervixCCprotein alkylation36/2311181/187232.46e-031.71e-0236
GO:00148963CervixCCmuscle hypertrophy23/2311104/187233.63e-032.32e-0223
GO:0014855CervixCCstriated muscle cell proliferation18/231176/187234.45e-032.71e-0218
GO:19908304CervixCCcellular response to leukemia inhibitory factor21/231194/187234.68e-032.82e-0221
Page: 1 2 3 4 5 6 7 8 9 10 11 12 13 14 15 16 17 18 19 20 21 22 23 

check button Enriched KEGG pathways.
Pathway IDTissueDisease StageDescriptionGene RatioBg Ratiopvaluep.adjustqvalueCount
Page: 1 

Top

Cell-cell communication analysis

check buttonIdentification of potential cell-cell interactions between two cell types and their ligand-receptor pairs for different disease states
LigandReceptorLRpairPathwayTissueDisease Stage
Page: 1 

Top

Single-cell gene regulatory network inference analysis

check buttonFind out the significant the regulons (TFs) and the target genes of each regulon across cell types for different disease states
TFCell TypeTissueDisease StageTarget GeneRSSRegulon Activity
∗The dot plots of a searched regulon are shown for all cell subpopulations in each disease state of each tissue based on the regulon specific score inferred using pySCENIC and by calculating the average expression.
Page: 1 

Top

Somatic mutation of malignant transformation related genes

check buttonAnnotation of somatic variants for genes involved in malignant transformation
Hugo SymbolVariant ClassVariant ClassificationdbSNP RSHGVScHGVSpHGVSp ShortSWISSPROTBIOTYPESIFTPolyPhenTumor Sample BarcodeTissueHistologySexAgeStageTherapy TypesDrugsOutcome
JARID2SNVMissense_Mutationc.1100N>Gp.Pro367Argp.P367RQ92833protein_codingdeleterious_low_confidence(0.02)benign(0.168)TCGA-A8-A08R-01Breastbreast invasive carcinomaFemale<65I/IIUnknownUnknownSD
JARID2SNVMissense_Mutationc.71C>Tp.Ser24Leup.S24LQ92833protein_codingdeleterious(0)probably_damaging(0.966)TCGA-BH-A0AZ-01Breastbreast invasive carcinomaFemale<65III/IVChemotherapydoxorubicinCR
JARID2SNVMissense_Mutationc.550N>Ap.Glu184Lysp.E184KQ92833protein_codingtolerated(0.06)benign(0.022)TCGA-D8-A27G-01Breastbreast invasive carcinomaFemale>=65I/IIUnknownUnknownSD
JARID2insertionNonsense_Mutationnovelc.1023_1024insTTTGGTTTTAGTGGAAGCATTTGAAAp.Val342PhefsTer8p.V342Ffs*8Q92833protein_codingTCGA-A2-A0EX-01Breastbreast invasive carcinomaFemale<65I/IIHormone TherapytamoxiphenSD
JARID2insertionFrame_Shift_Insnovelc.961_962insAGGAGCACACGCTGCAGACACCTCACTTTCTGCAGAGCTGGp.Ser321LysfsTer30p.S321Kfs*30Q92833protein_codingTCGA-B6-A0IK-01Breastbreast invasive carcinomaFemale<65III/IVUnknownUnknownPD
JARID2insertionFrame_Shift_Insnovelc.2634_2635insCAAAp.Val879GlnfsTer21p.V879Qfs*21Q92833protein_codingTCGA-B6-A0RE-01Breastbreast invasive carcinomaFemale<65I/IIUnknownUnknownSD
JARID2insertionIn_Frame_Insnovelc.2635_2636insCATGTTCTGACCCATTCTTTGCCCCCAp.Val879delinsAlaCysSerAspProPhePheAlaProIlep.V879delinsACSDPFFAPIQ92833protein_codingTCGA-B6-A0RE-01Breastbreast invasive carcinomaFemale<65I/IIUnknownUnknownSD
JARID2deletionFrame_Shift_Delnovelc.2472delNp.Tyr826IlefsTer8p.Y826Ifs*8Q92833protein_codingTCGA-D8-A27V-01Breastbreast invasive carcinomaFemale<65I/IIHormone TherapytamoxiphenSD
JARID2insertionFrame_Shift_Insnovelc.2810_2811insCCp.Ile938ProfsTer48p.I938Pfs*48Q92833protein_codingTCGA-E9-A1NA-01Breastbreast invasive carcinomaFemale<65I/IIChemotherapycyclophosphamideSD
JARID2insertionNonsense_Mutationnovelc.2812_2813insCCGTAGAAGGATGGTTCTGAGAATGAATTTCTGTGGCp.Ile938ThrfsTer7p.I938Tfs*7Q92833protein_codingTCGA-E9-A1NA-01Breastbreast invasive carcinomaFemale<65I/IIChemotherapycyclophosphamideSD
Page: 1 2 3 4 5 6 7 8 9 10 11 12 13 14 15 16 17 18 19 

Top

Related drugs of malignant transformation related genes

check buttonIdentification of chemicals and drugs interact with genes involved in malignant transfromation
(DGIdb 4.0)
Entrez IDSymbolCategoryInteraction TypesDrug Claim NameDrug NamePMIDs
Page: 1