
|
|||||
|
 | |
| |
| |
| |
| |
| |
|
Gene: JAKMIP2 |
Gene summary for JAKMIP2 |
| Gene information | Species | Human | Gene symbol | JAKMIP2 | Gene ID | 9832 |
| Gene name | janus kinase and microtubule interacting protein 2 | |
| Gene Alias | JAMIP2 | |
| Cytomap | 5q32 | |
| Gene Type | protein-coding | GO ID | GO:0005575 | UniProtAcc | Q96AA8 |
Top |
Malignant transformation analysis |
| Identification of the aberrant gene expression in precancerous and cancerous lesions by comparing the gene expression of stem-like cells in diseased tissues with normal stem cells |
| Entrez ID | Symbol | Replicates | Species | Organ | Tissue | Adj P-value | Log2FC | Malignancy |
| 9832 | JAKMIP2 | C38 | Human | Oral cavity | OSCC | 6.26e-10 | 8.34e-01 | 0.172 |
| 9832 | JAKMIP2 | C08 | Human | Oral cavity | OSCC | 2.08e-07 | 2.58e-01 | 0.1919 |
| 9832 | JAKMIP2 | LN38 | Human | Oral cavity | OSCC | 7.71e-06 | 7.29e-01 | 0.168 |
| 9832 | JAKMIP2 | HTA12-15-2 | Human | Pancreas | PDAC | 4.06e-02 | 2.86e-01 | 0.2315 |
| 9832 | JAKMIP2 | HTA12-23-1 | Human | Pancreas | PDAC | 1.57e-10 | 8.13e-01 | 0.3405 |
| 9832 | JAKMIP2 | HTA12-25-1 | Human | Pancreas | PDAC | 3.64e-05 | 4.71e-01 | 0.313 |
| 9832 | JAKMIP2 | HTA12-26-1 | Human | Pancreas | PDAC | 1.22e-27 | 1.03e+00 | 0.3728 |
| 9832 | JAKMIP2 | HTA12-29-1 | Human | Pancreas | PDAC | 4.24e-49 | 9.42e-01 | 0.3722 |
| 9832 | JAKMIP2 | HTA12-30-1 | Human | Pancreas | PDAC | 1.14e-02 | 7.81e-01 | 0.3671 |
| Page: 1 |
| Tissue | Expression Dynamics | Abbreviation |
| Oral Cavity | 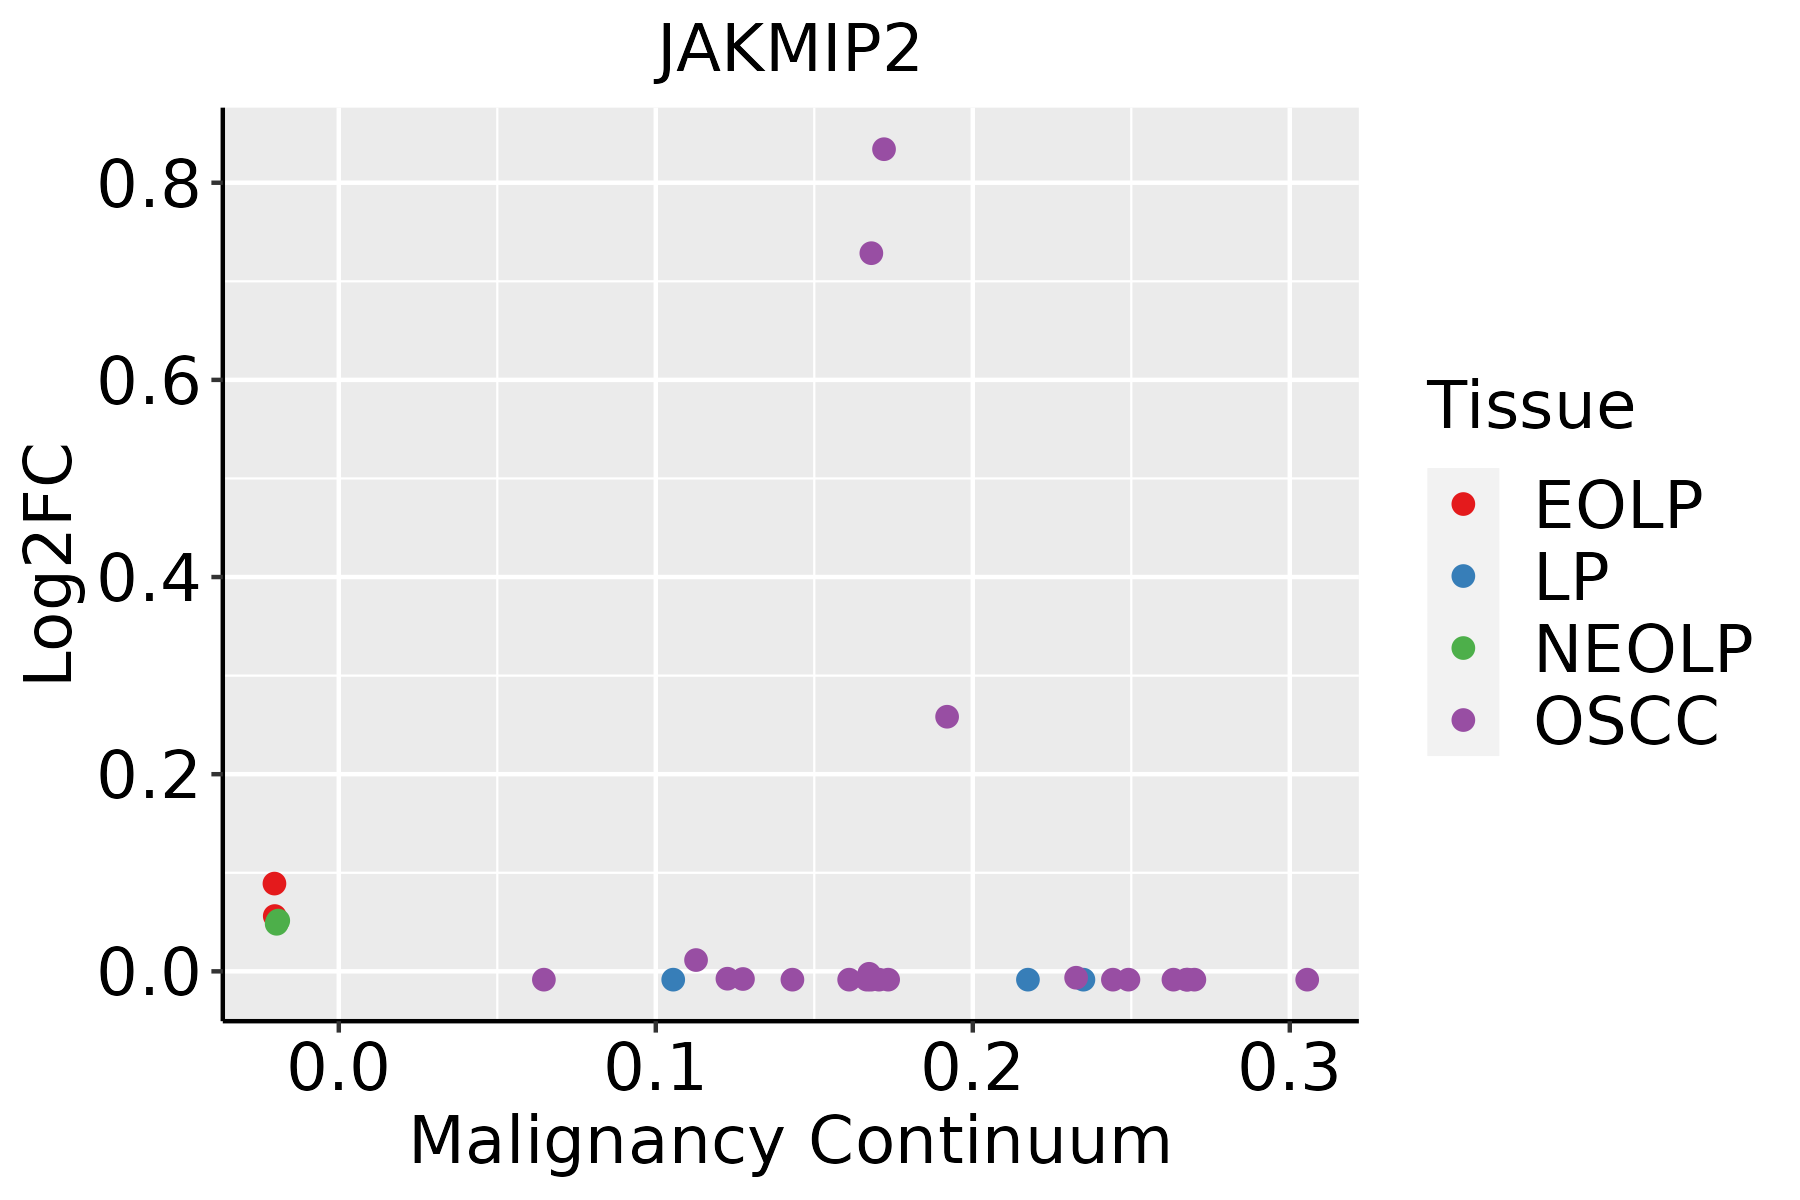 | EOLP: Erosive Oral lichen planus |
| LP: leukoplakia | ||
| NEOLP: Non-erosive oral lichen planus | ||
| OSCC: Oral squamous cell carcinoma |
| ∗log2FC in expression of this searched gene in stem-like cells from each diseased tissue sample relative to stem-like cells in normal samples in each tissue plotted against the malignancy continuum. Samples are colored based on if they are from different disease stage. |
Top |
Malignant transformation related pathway analysis |
| Find out the enriched GO biological processes and KEGG pathways involved in transition from healthy to precancer to cancer |
| Tissue | Disease Stage | Enriched GO biological Processes |
| Colorectum | AD |  |
| Colorectum | SER |  |
| Colorectum | MSS |  |
| Colorectum | MSI-H |  |
| Colorectum | FAP |  |
| ∗Top 15 enriched GO BP terms are showed in the bar plot of each disease state in each tissue. Each row represents a significant GO biological process which is colored according to the -log10(p.adjust). |
| Page: 1 2 3 4 5 6 7 8 9 |
| GO ID | Tissue | Disease Stage | Description | Gene Ratio | Bg Ratio | pvalue | p.adjust | Count |
| Page: 1 |
| Pathway ID | Tissue | Disease Stage | Description | Gene Ratio | Bg Ratio | pvalue | p.adjust | qvalue | Count |
| Page: 1 |
Top |
Cell-cell communication analysis |
| Identification of potential cell-cell interactions between two cell types and their ligand-receptor pairs for different disease states |
| Ligand | Receptor | LRpair | Pathway | Tissue | Disease Stage |
| Page: 1 |
Top |
Single-cell gene regulatory network inference analysis |
| Find out the significant the regulons (TFs) and the target genes of each regulon across cell types for different disease states |
| TF | Cell Type | Tissue | Disease Stage | Target Gene | RSS | Regulon Activity |
| ∗The dot plots of a searched regulon are shown for all cell subpopulations in each disease state of each tissue based on the regulon specific score inferred using pySCENIC and by calculating the average expression. |
| Page: 1 |
Top |
Somatic mutation of malignant transformation related genes |
| Annotation of somatic variants for genes involved in malignant transformation |
| Hugo Symbol | Variant Class | Variant Classification | dbSNP RS | HGVSc | HGVSp | HGVSp Short | SWISSPROT | BIOTYPE | SIFT | PolyPhen | Tumor Sample Barcode | Tissue | Histology | Sex | Age | Stage | Therapy Types | Drugs | Outcome |
| JAKMIP2 | SNV | Missense_Mutation | c.1045N>A | p.Glu349Lys | p.E349K | Q96AA8 | protein_coding | tolerated(0.07) | benign(0.111) | TCGA-A1-A0SP-01 | Breast | breast invasive carcinoma | Female | <65 | I/II | Chemotherapy | SD | ||
| JAKMIP2 | SNV | Missense_Mutation | c.1000G>A | p.Ala334Thr | p.A334T | Q96AA8 | protein_coding | tolerated(0.43) | benign(0) | TCGA-BH-A18G-01 | Breast | breast invasive carcinoma | Female | >=65 | I/II | Unknown | Unknown | SD | |
| JAKMIP2 | insertion | Frame_Shift_Ins | novel | c.1122_1123insGACAACATATT | p.Lys375AspfsTer7 | p.K375Dfs*7 | Q96AA8 | protein_coding | TCGA-AR-A0TU-01 | Breast | breast invasive carcinoma | Female | <65 | I/II | Unspecific | Doxorubicin | SD | ||
| JAKMIP2 | SNV | Missense_Mutation | c.1672N>C | p.Glu558Gln | p.E558Q | Q96AA8 | protein_coding | deleterious(0.03) | benign(0.086) | TCGA-FU-A23L-01 | Cervix | cervical & endocervical cancer | Female | <65 | I/II | Chemotherapy | cisplatin | CR | |
| JAKMIP2 | SNV | Missense_Mutation | rs758985625 | c.279N>G | p.Ile93Met | p.I93M | Q96AA8 | protein_coding | deleterious(0.03) | benign(0.371) | TCGA-Q1-A73P-01 | Cervix | cervical & endocervical cancer | Female | <65 | I/II | Unknown | Unknown | SD |
| JAKMIP2 | SNV | Missense_Mutation | rs746010111 | c.344N>G | p.Lys115Arg | p.K115R | Q96AA8 | protein_coding | tolerated(0.09) | benign(0.001) | TCGA-A6-2672-01 | Colorectum | colon adenocarcinoma | Female | >=65 | III/IV | Unknown | Unknown | SD |
| JAKMIP2 | SNV | Missense_Mutation | novel | c.1186N>T | p.Val396Phe | p.V396F | Q96AA8 | protein_coding | deleterious(0.04) | probably_damaging(0.98) | TCGA-A6-3808-01 | Colorectum | colon adenocarcinoma | Male | >=65 | I/II | Unknown | Unknown | SD |
| JAKMIP2 | SNV | Missense_Mutation | c.76C>A | p.Leu26Ile | p.L26I | Q96AA8 | protein_coding | deleterious(0) | probably_damaging(0.953) | TCGA-A6-6781-01 | Colorectum | colon adenocarcinoma | Male | <65 | III/IV | Chemotherapy | oxaliplatin | SD | |
| JAKMIP2 | SNV | Missense_Mutation | c.446N>A | p.Arg149His | p.R149H | Q96AA8 | protein_coding | deleterious(0) | probably_damaging(0.984) | TCGA-AA-3489-01 | Colorectum | colon adenocarcinoma | Male | >=65 | I/II | Unknown | Unknown | PD | |
| JAKMIP2 | SNV | Missense_Mutation | c.2395N>C | p.Lys799Gln | p.K799Q | Q96AA8 | protein_coding | deleterious(0) | probably_damaging(0.978) | TCGA-AA-3510-01 | Colorectum | colon adenocarcinoma | Male | >=65 | I/II | Unknown | Unknown | SD |
| Page: 1 2 3 4 5 6 7 8 9 10 11 12 13 |
Top |
Related drugs of malignant transformation related genes |
| Identification of chemicals and drugs interact with genes involved in malignant transfromation |
| (DGIdb 4.0) |
| Entrez ID | Symbol | Category | Interaction Types | Drug Claim Name | Drug Name | PMIDs |
| Page: 1 |

Copyright 2023-Present -The University of Texas Health Science Center at Houston |