| Tissue | Expression Dynamics | Abbreviation |
| Esophagus | 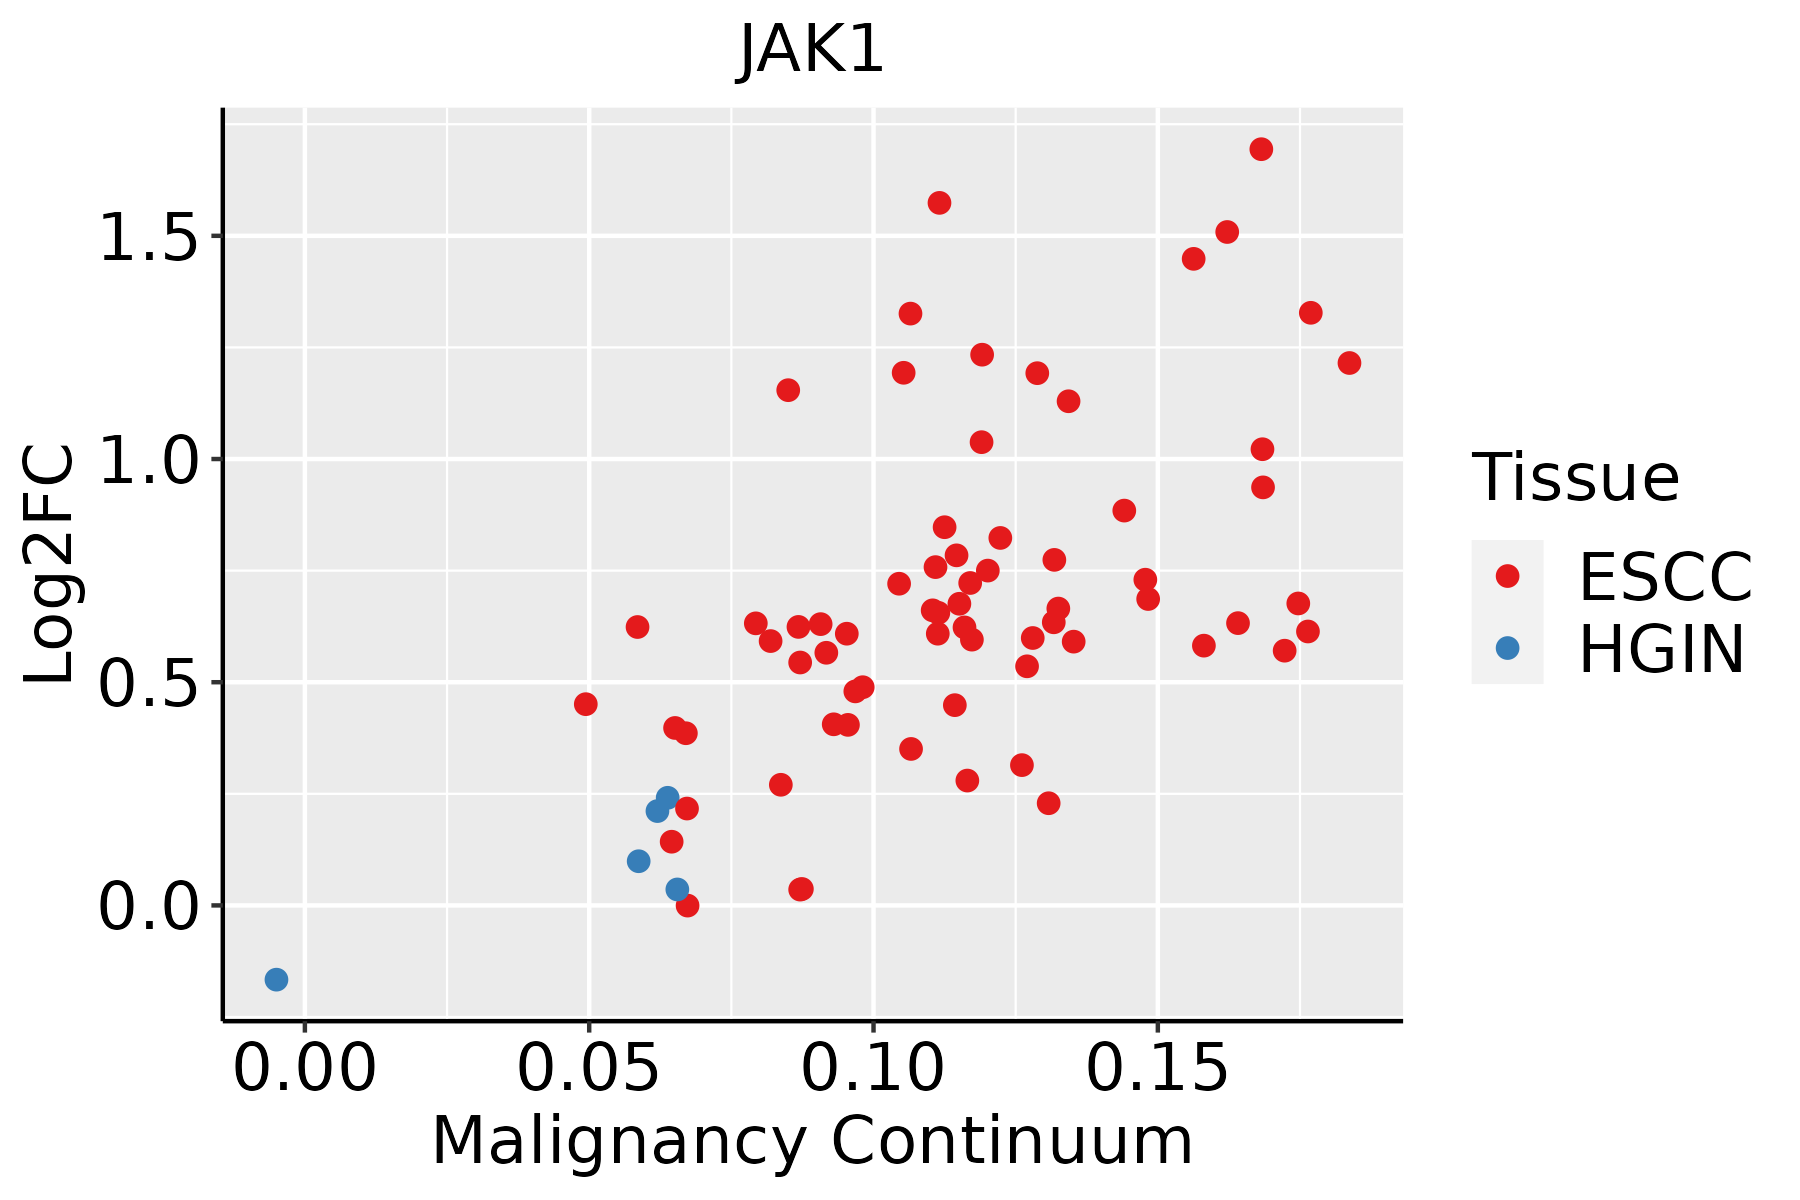 | ESCC: Esophageal squamous cell carcinoma |
| HGIN: High-grade intraepithelial neoplasias |
| LGIN: Low-grade intraepithelial neoplasias |
| Liver | 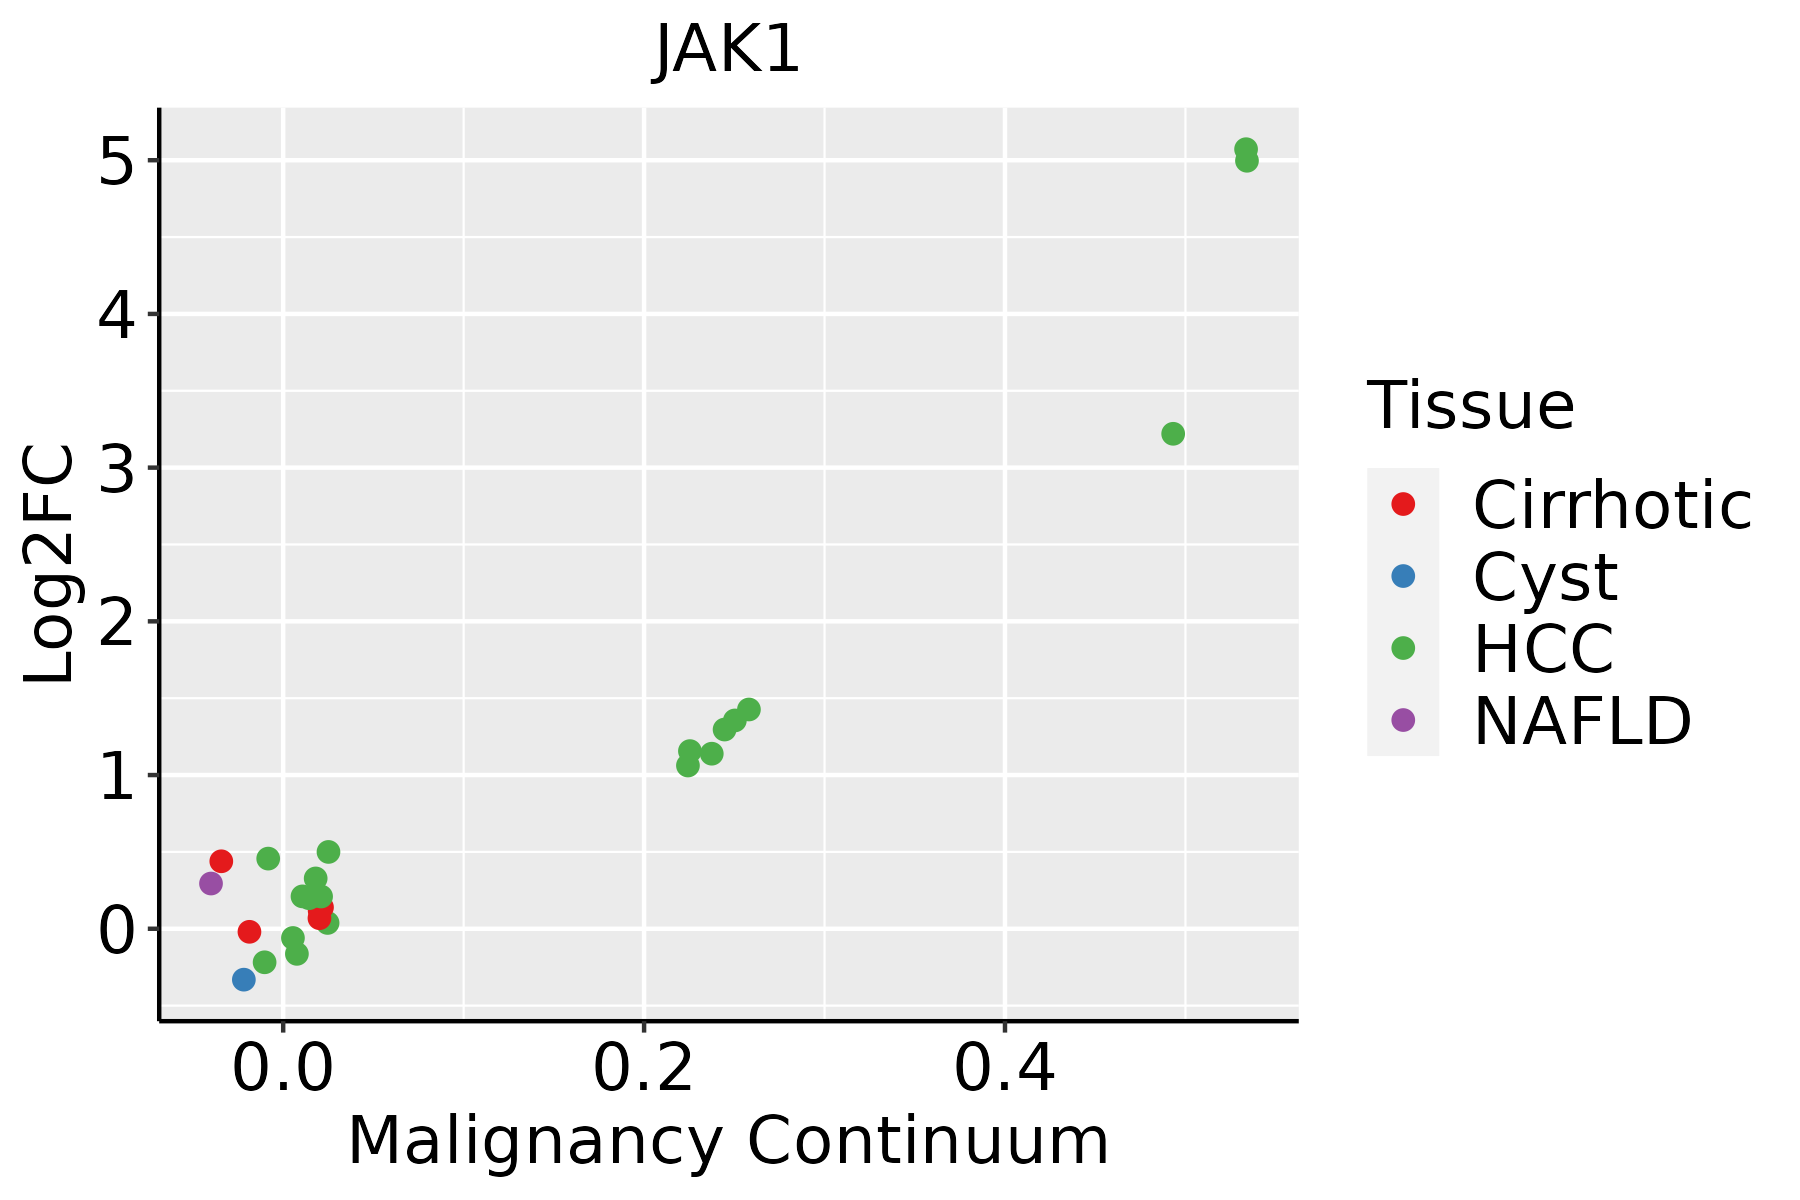 | HCC: Hepatocellular carcinoma |
| NAFLD: Non-alcoholic fatty liver disease |
| Lung |  | AAH: Atypical adenomatous hyperplasia |
| AIS: Adenocarcinoma in situ |
| IAC: Invasive lung adenocarcinoma |
| MIA: Minimally invasive adenocarcinoma |
| Oral Cavity |  | EOLP: Erosive Oral lichen planus |
| LP: leukoplakia |
| NEOLP: Non-erosive oral lichen planus |
| OSCC: Oral squamous cell carcinoma |
| Prostate | 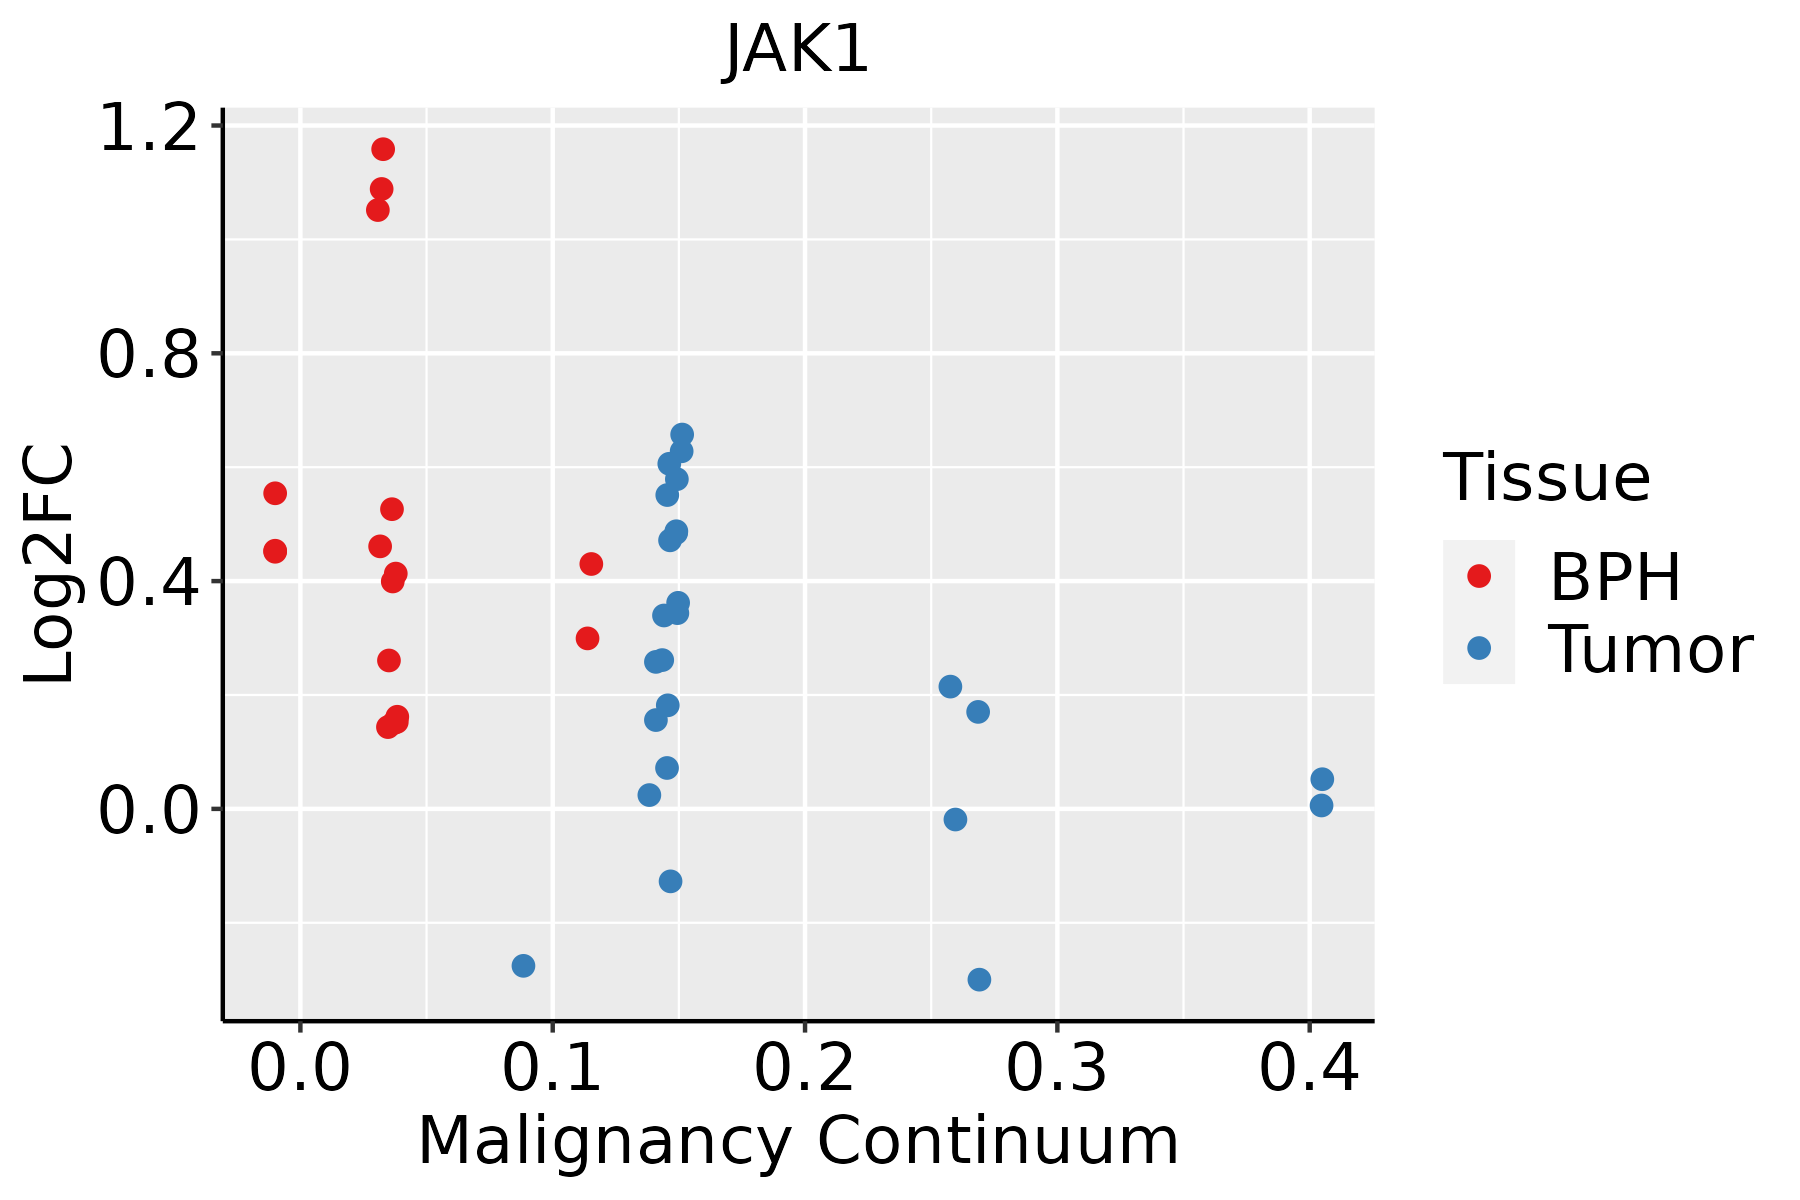 | BPH: Benign Prostatic Hyperplasia |
| Skin | 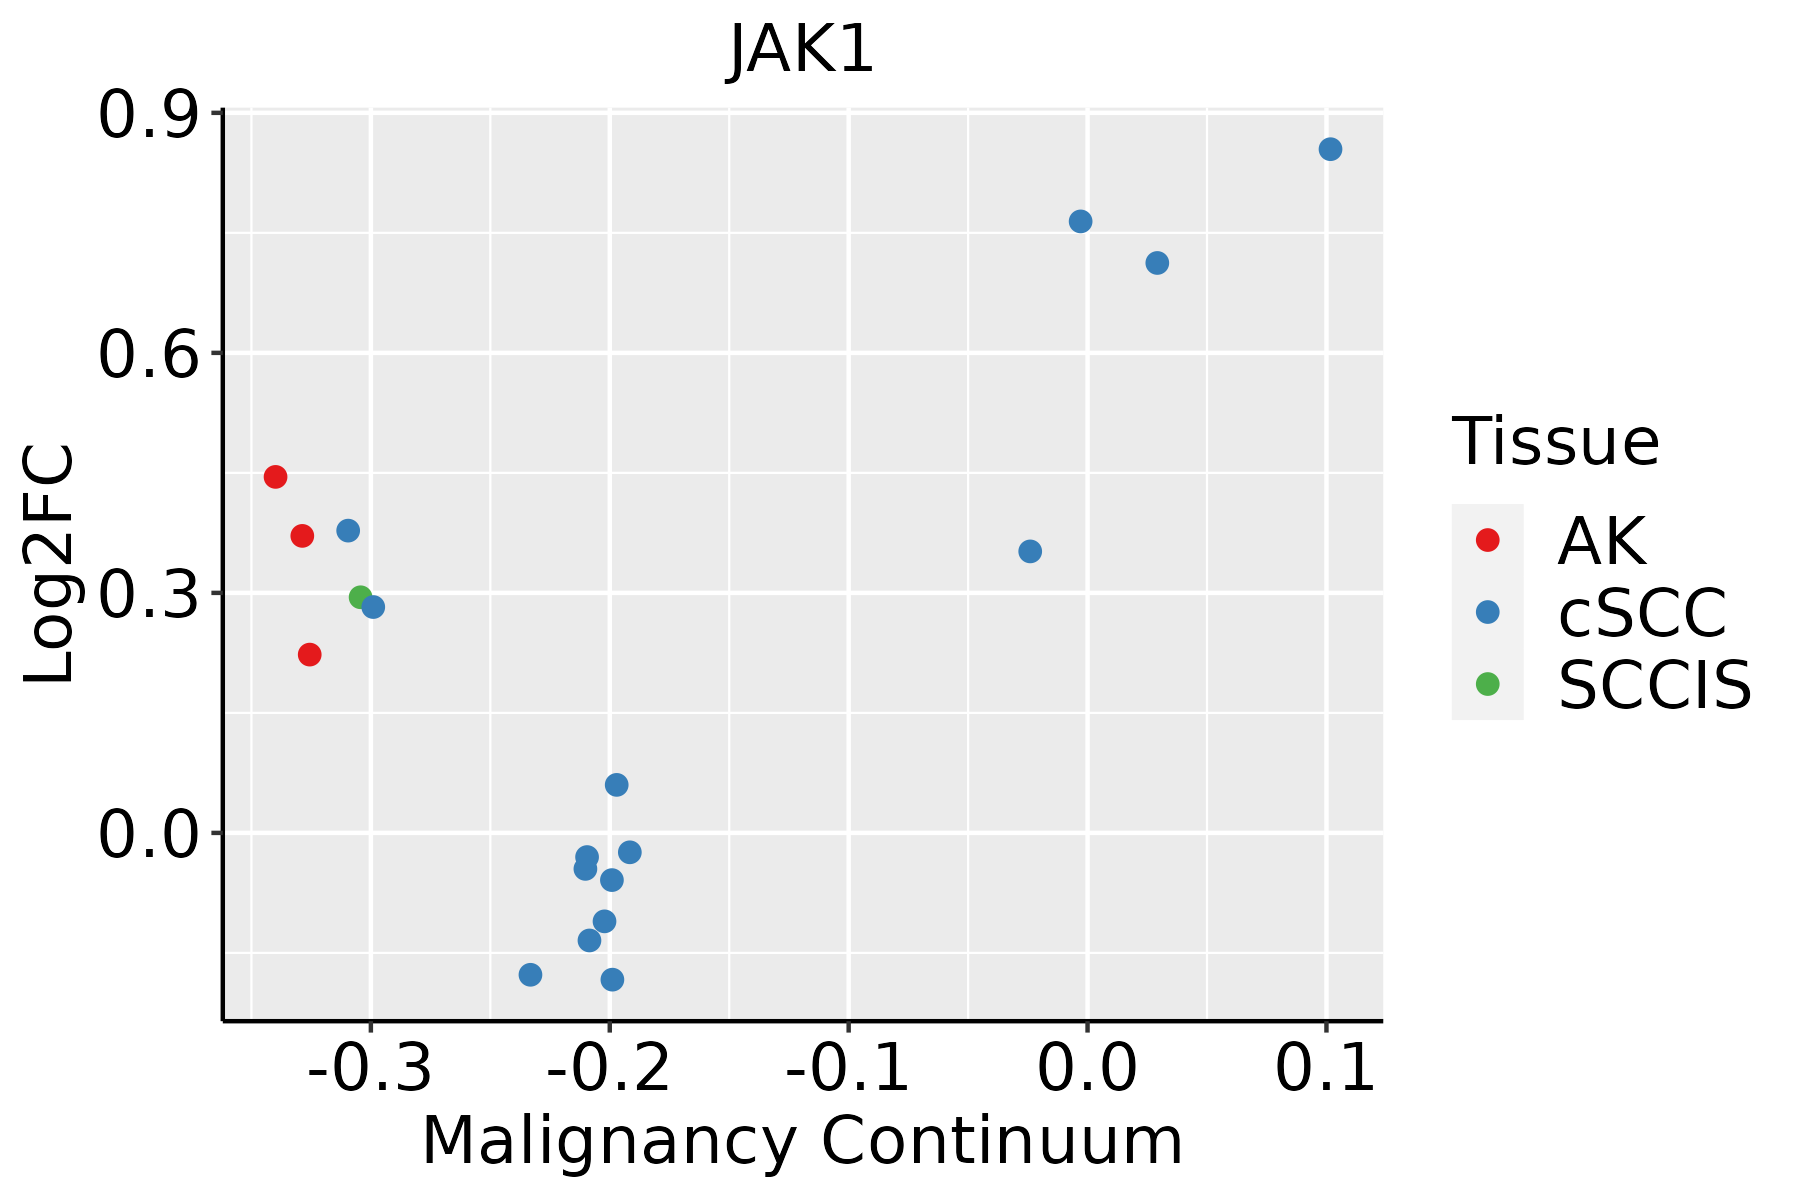 | AK: Actinic keratosis |
| cSCC: Cutaneous squamous cell carcinoma |
| SCCIS:squamous cell carcinoma in situ |
| Thyroid | 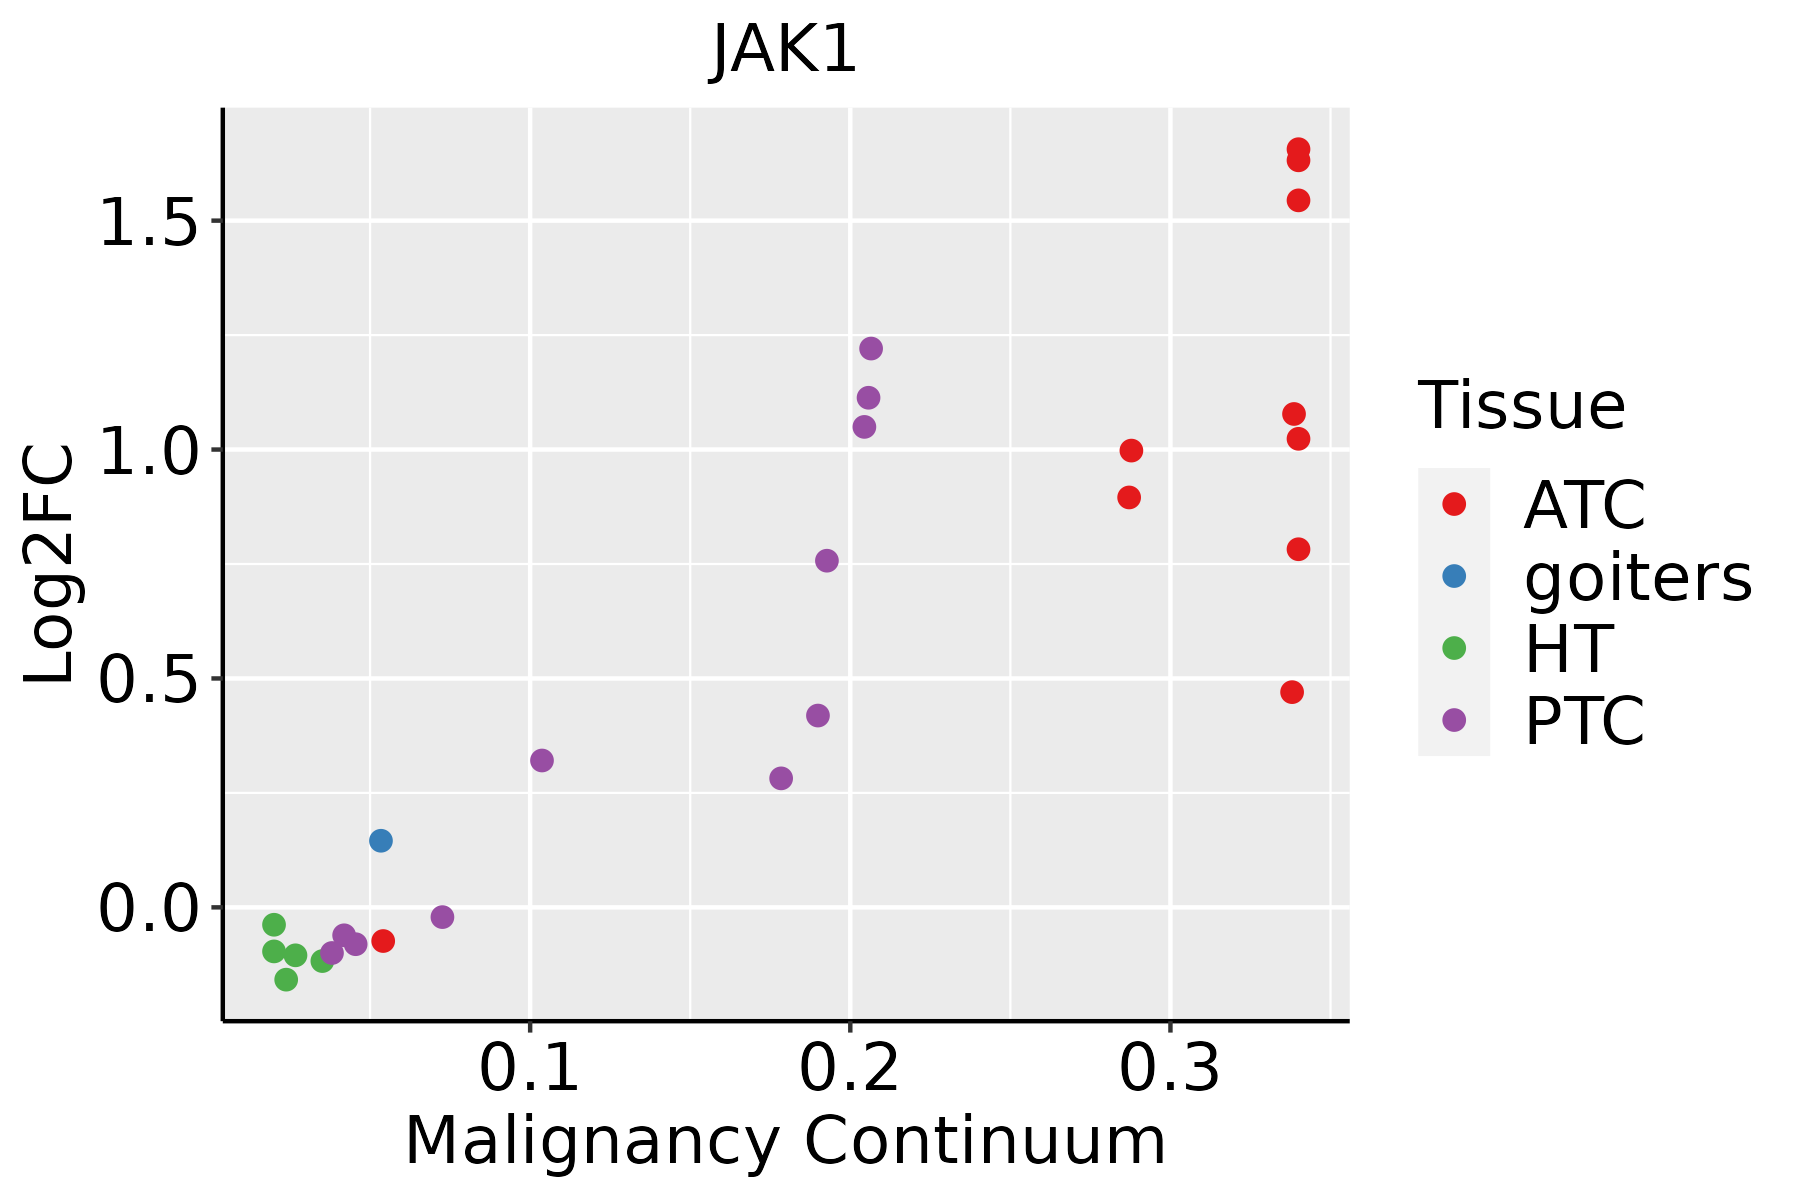 | ATC: Anaplastic thyroid cancer |
| HT: Hashimoto's thyroiditis |
| PTC: Papillary thyroid cancer |
| GO ID | Tissue | Disease Stage | Description | Gene Ratio | Bg Ratio | pvalue | p.adjust | Count |
| GO:003434013 | Esophagus | ESCC | response to type I interferon | 48/8552 | 58/18723 | 6.18e-09 | 1.26e-07 | 48 |
| GO:004578527 | Esophagus | ESCC | positive regulation of cell adhesion | 255/8552 | 437/18723 | 5.07e-08 | 9.11e-07 | 255 |
| GO:00603375 | Esophagus | ESCC | type I interferon signaling pathway | 41/8552 | 50/18723 | 1.35e-07 | 2.17e-06 | 41 |
| GO:00713575 | Esophagus | ESCC | cellular response to type I interferon | 42/8552 | 52/18723 | 2.15e-07 | 3.30e-06 | 42 |
| GO:00603336 | Esophagus | ESCC | interferon-gamma-mediated signaling pathway | 22/8552 | 27/18723 | 1.49e-04 | 9.92e-04 | 22 |
| GO:00343418 | Esophagus | ESCC | response to interferon-gamma | 86/8552 | 141/18723 | 1.74e-04 | 1.14e-03 | 86 |
| GO:00466774 | Esophagus | ESCC | response to antibiotic | 34/8552 | 47/18723 | 1.91e-04 | 1.21e-03 | 34 |
| GO:002240720 | Esophagus | ESCC | regulation of cell-cell adhesion | 239/8552 | 448/18723 | 5.88e-04 | 3.19e-03 | 239 |
| GO:00182124 | Esophagus | ESCC | peptidyl-tyrosine modification | 202/8552 | 378/18723 | 1.34e-03 | 6.39e-03 | 202 |
| GO:002240919 | Esophagus | ESCC | positive regulation of cell-cell adhesion | 155/8552 | 284/18723 | 1.50e-03 | 7.06e-03 | 155 |
| GO:00181084 | Esophagus | ESCC | peptidyl-tyrosine phosphorylation | 200/8552 | 375/18723 | 1.60e-03 | 7.45e-03 | 200 |
| GO:00713466 | Esophagus | ESCC | cellular response to interferon-gamma | 69/8552 | 118/18723 | 3.44e-03 | 1.41e-02 | 69 |
| GO:003410920 | Esophagus | ESCC | homotypic cell-cell adhesion | 54/8552 | 90/18723 | 4.33e-03 | 1.72e-02 | 54 |
| GO:015010510 | Esophagus | ESCC | protein localization to cell-cell junction | 16/8552 | 21/18723 | 4.47e-03 | 1.76e-02 | 16 |
| GO:00343413 | Liver | Cirrhotic | response to interferon-gamma | 60/4634 | 141/18723 | 2.57e-06 | 4.63e-05 | 60 |
| GO:00343404 | Liver | Cirrhotic | response to type I interferon | 29/4634 | 58/18723 | 2.87e-05 | 3.64e-04 | 29 |
| GO:0071346 | Liver | Cirrhotic | cellular response to interferon-gamma | 49/4634 | 118/18723 | 4.43e-05 | 5.22e-04 | 49 |
| GO:00341097 | Liver | Cirrhotic | homotypic cell-cell adhesion | 39/4634 | 90/18723 | 8.57e-05 | 9.25e-04 | 39 |
| GO:00603332 | Liver | Cirrhotic | interferon-gamma-mediated signaling pathway | 16/4634 | 27/18723 | 1.41e-04 | 1.36e-03 | 16 |
| GO:00457857 | Liver | Cirrhotic | positive regulation of cell adhesion | 141/4634 | 437/18723 | 2.05e-04 | 1.89e-03 | 141 |
| Pathway ID | Tissue | Disease Stage | Description | Gene Ratio | Bg Ratio | pvalue | p.adjust | qvalue | Count |
| hsa05166211 | Esophagus | ESCC | Human T-cell leukemia virus 1 infection | 164/4205 | 222/8465 | 8.13e-14 | 2.09e-12 | 1.07e-12 | 164 |
| hsa05169210 | Esophagus | ESCC | Epstein-Barr virus infection | 151/4205 | 202/8465 | 1.55e-13 | 3.45e-12 | 1.77e-12 | 151 |
| hsa05167211 | Esophagus | ESCC | Kaposi sarcoma-associated herpesvirus infection | 136/4205 | 194/8465 | 4.28e-09 | 4.22e-08 | 2.16e-08 | 136 |
| hsa0516425 | Esophagus | ESCC | Influenza A | 122/4205 | 171/8465 | 5.01e-09 | 4.79e-08 | 2.45e-08 | 122 |
| hsa0521216 | Esophagus | ESCC | Pancreatic cancer | 62/4205 | 76/8465 | 7.37e-09 | 6.85e-08 | 3.51e-08 | 62 |
| hsa0516510 | Esophagus | ESCC | Human papillomavirus infection | 215/4205 | 331/8465 | 7.86e-09 | 7.12e-08 | 3.65e-08 | 215 |
| hsa05171211 | Esophagus | ESCC | Coronavirus disease - COVID-19 | 156/4205 | 232/8465 | 3.18e-08 | 2.68e-07 | 1.37e-07 | 156 |
| hsa0520325 | Esophagus | ESCC | Viral carcinogenesis | 137/4205 | 204/8465 | 2.47e-07 | 1.88e-06 | 9.62e-07 | 137 |
| hsa05163210 | Esophagus | ESCC | Human cytomegalovirus infection | 148/4205 | 225/8465 | 5.73e-07 | 4.00e-06 | 2.05e-06 | 148 |
| hsa051609 | Esophagus | ESCC | Hepatitis C | 107/4205 | 157/8465 | 1.75e-06 | 1.08e-05 | 5.55e-06 | 107 |
| hsa051619 | Esophagus | ESCC | Hepatitis B | 108/4205 | 162/8465 | 7.68e-06 | 4.15e-05 | 2.12e-05 | 108 |
| hsa0514525 | Esophagus | ESCC | Toxoplasmosis | 76/4205 | 112/8465 | 6.83e-05 | 2.90e-04 | 1.48e-04 | 76 |
| hsa051629 | Esophagus | ESCC | Measles | 90/4205 | 139/8465 | 2.16e-04 | 7.87e-04 | 4.03e-04 | 90 |
| hsa0152110 | Esophagus | ESCC | EGFR tyrosine kinase inhibitor resistance | 55/4205 | 79/8465 | 2.44e-04 | 8.78e-04 | 4.50e-04 | 55 |
| hsa0462122 | Esophagus | ESCC | NOD-like receptor signaling pathway | 116/4205 | 186/8465 | 2.90e-04 | 1.03e-03 | 5.30e-04 | 116 |
| hsa051527 | Esophagus | ESCC | Tuberculosis | 111/4205 | 180/8465 | 7.14e-04 | 2.32e-03 | 1.19e-03 | 111 |
| hsa052356 | Esophagus | ESCC | PD-L1 expression and PD-1 checkpoint pathway in cancer | 58/4205 | 89/8465 | 2.19e-03 | 6.16e-03 | 3.16e-03 | 58 |
| hsa046599 | Esophagus | ESCC | Th17 cell differentiation | 68/4205 | 108/8465 | 3.53e-03 | 9.30e-03 | 4.76e-03 | 68 |
| hsa046585 | Esophagus | ESCC | Th1 and Th2 cell differentiation | 58/4205 | 92/8465 | 6.49e-03 | 1.60e-02 | 8.19e-03 | 58 |
| hsa041517 | Esophagus | ESCC | PI3K-Akt signaling pathway | 197/4205 | 354/8465 | 1.24e-02 | 2.83e-02 | 1.45e-02 | 197 |
| Hugo Symbol | Variant Class | Variant Classification | dbSNP RS | HGVSc | HGVSp | HGVSp Short | SWISSPROT | BIOTYPE | SIFT | PolyPhen | Tumor Sample Barcode | Tissue | Histology | Sex | Age | Stage | Therapy Types | Drugs | Outcome |
| JAK1 | SNV | Missense_Mutation | novel | c.3299N>A | p.Thr1100Lys | p.T1100K | P23458 | protein_coding | deleterious(0) | probably_damaging(0.997) | TCGA-A7-A13E-01 | Breast | breast invasive carcinoma | Female | <65 | I/II | Targeted Molecular therapy | bevacizumab | PD |
| JAK1 | SNV | Missense_Mutation | | c.3268N>C | p.Lys1090Gln | p.K1090Q | P23458 | protein_coding | deleterious(0.03) | benign(0.115) | TCGA-A8-A08T-01 | Breast | breast invasive carcinoma | Female | <65 | III/IV | Unknown | Unknown | PD |
| JAK1 | SNV | Missense_Mutation | | c.1798G>T | p.Gly600Trp | p.G600W | P23458 | protein_coding | deleterious(0) | probably_damaging(1) | TCGA-A8-A095-01 | Breast | breast invasive carcinoma | Female | <65 | I/II | Chemotherapy | 5-fluorouracil | CR |
| JAK1 | SNV | Missense_Mutation | | c.3392N>A | p.Cys1131Tyr | p.C1131Y | P23458 | protein_coding | deleterious(0) | probably_damaging(0.999) | TCGA-A8-A09Z-01 | Breast | breast invasive carcinoma | Female | >=65 | I/II | Unknown | Unknown | SD |
| JAK1 | SNV | Missense_Mutation | | c.1406N>A | p.Cys469Tyr | p.C469Y | P23458 | protein_coding | deleterious(0.01) | probably_damaging(0.996) | TCGA-BH-A0HF-01 | Breast | breast invasive carcinoma | Female | >=65 | I/II | Hormone Therapy | arimidex | SD |
| JAK1 | SNV | Missense_Mutation | | c.566N>A | p.Cys189Tyr | p.C189Y | P23458 | protein_coding | tolerated(0.09) | probably_damaging(0.996) | TCGA-E9-A1R7-01 | Breast | breast invasive carcinoma | Female | <65 | I/II | Hormone Therapy | fareston | SD |
| JAK1 | insertion | In_Frame_Ins | novel | c.1997_1998insTCCTTCATT | p.Val666_Glu667insProSerLeu | p.V666_E667insPSL | P23458 | protein_coding | | | TCGA-A8-A08H-01 | Breast | breast invasive carcinoma | Female | >=65 | I/II | Unknown | Unknown | SD |
| JAK1 | insertion | Nonsense_Mutation | novel | c.1995_1996insTTTGGGCACACTGCTTGAAGTA | p.Val666PhefsTer6 | p.V666Ffs*6 | P23458 | protein_coding | | | TCGA-A8-A08H-01 | Breast | breast invasive carcinoma | Female | >=65 | I/II | Unknown | Unknown | SD |
| JAK1 | insertion | Nonsense_Mutation | novel | c.2052_2053insAGTATTATTTATCTGAGATTTTAA | p.Asp684_Val685insSerIleIleTyrLeuArgPheTer | p.D684_V685insSIIYLRF* | P23458 | protein_coding | | | TCGA-AN-A04A-01 | Breast | breast invasive carcinoma | Female | <65 | III/IV | Unknown | Unknown | SD |
| JAK1 | insertion | Frame_Shift_Ins | novel | c.1035_1036insA | p.Leu346ThrfsTer4 | p.L346Tfs*4 | P23458 | protein_coding | | | TCGA-D8-A145-01 | Breast | breast invasive carcinoma | Female | >=65 | I/II | Hormone Therapy | tamoxiphen | SD |
| Entrez ID | Symbol | Category | Interaction Types | Drug Claim Name | Drug Name | PMIDs |
| 3716 | JAK1 | CLINICALLY ACTIONABLE, DRUG RESISTANCE, DRUGGABLE GENOME, KINASE, TYROSINE KINASE, ENZYME | | PEMBROLIZUMAB | PEMBROLIZUMAB | 27903500,27433843 |
| 3716 | JAK1 | CLINICALLY ACTIONABLE, DRUG RESISTANCE, DRUGGABLE GENOME, KINASE, TYROSINE KINASE, ENZYME | | PMID27774824-Compound-Figure9Example2up | | |
| 3716 | JAK1 | CLINICALLY ACTIONABLE, DRUG RESISTANCE, DRUGGABLE GENOME, KINASE, TYROSINE KINASE, ENZYME | | Aminotriazolopyridine derivative 1 | | |
| 3716 | JAK1 | CLINICALLY ACTIONABLE, DRUG RESISTANCE, DRUGGABLE GENOME, KINASE, TYROSINE KINASE, ENZYME | | Pyrazolo[4,3-c]pyridine derivative 2 | | |
| 3716 | JAK1 | CLINICALLY ACTIONABLE, DRUG RESISTANCE, DRUGGABLE GENOME, KINASE, TYROSINE KINASE, ENZYME | inhibitor | 381118867 | | |
| 3716 | JAK1 | CLINICALLY ACTIONABLE, DRUG RESISTANCE, DRUGGABLE GENOME, KINASE, TYROSINE KINASE, ENZYME | | Tricyclic heterocycle derivative 1 | | |
| 3716 | JAK1 | CLINICALLY ACTIONABLE, DRUG RESISTANCE, DRUGGABLE GENOME, KINASE, TYROSINE KINASE, ENZYME | inhibitor | 348353655 | OCLACITINIB | |
| 3716 | JAK1 | CLINICALLY ACTIONABLE, DRUG RESISTANCE, DRUGGABLE GENOME, KINASE, TYROSINE KINASE, ENZYME | | Five-and-six-membered heterocyclic compound 1 | | |
| 3716 | JAK1 | CLINICALLY ACTIONABLE, DRUG RESISTANCE, DRUGGABLE GENOME, KINASE, TYROSINE KINASE, ENZYME | | Bipyrazole derivative 1 | | |
| 3716 | JAK1 | CLINICALLY ACTIONABLE, DRUG RESISTANCE, DRUGGABLE GENOME, KINASE, TYROSINE KINASE, ENZYME | inhibitor | 385612219 | BREPOCITINIB | |


