Schematic overview of the cellular and molecular mechanisms involved in the cancer progression, including the proposed cellular and molecular mechanisms in cancer cells trajectory. AT1: alveolar type 1 cells; AT2: alveolar type 2 cells; AAH: atypical adenomatous hyperplasia; AIS: adenocarcinoma in situ; MIA: minimally invasive adenocarcinoma; IA: invasive adenocarcinoma; EMT: epithelial-mesenchymal transition

Home

Download

Statistics

Help

Contact

Center for Computational Systems Medicine
leaf

Gene summary

leaf

Malignant transformation analysis

leaf

Malignant transformation related pathway analysis

leaf

Cell-cell communication analysis

leaf

Single-cell gene regulatory network inference analysis

leaf

Somatic mutation of malignant transformation related genes

leaf

Related drugs of malignant transformation related genes

Gene: JAGN1

Gene summary for JAGN1

check button Gene summary.

Gene informationSpeciesHuman
Gene symbol

JAGN1

Gene ID

84522

Gene namejagunal homolog 1
Gene AliasGL009
Cytomap3p25.3
Gene Typeprotein-coding
GO ID

GO:0001678

UniProtAcc

Q8N5M9


Top

Malignant transformation analysis

check button Identification of the aberrant gene expression in precancerous and cancerous lesions by comparing the gene expression of stem-like cells in diseased tissues with normal stem cells
check button Malignant transformation involving gene list.
Entrez IDSymbolReplicatesSpeciesOrganTissueAdj P-valueLog2FCMalignancy
84522JAGN1HTA11_3410_2000001011HumanColorectumAD3.29e-031.44e-010.0155
84522JAGN1HTA11_2487_2000001011HumanColorectumSER3.18e-052.30e-01-0.1808
84522JAGN1HTA11_1938_2000001011HumanColorectumAD1.65e-053.31e-01-0.0811
84522JAGN1HTA11_347_2000001011HumanColorectumAD8.50e-173.64e-01-0.1954
84522JAGN1HTA11_411_2000001011HumanColorectumSER7.13e-065.81e-01-0.2602
84522JAGN1HTA11_2112_2000001011HumanColorectumSER7.88e-064.60e-01-0.2196
84522JAGN1HTA11_83_2000001011HumanColorectumSER4.35e-042.64e-01-0.1526
84522JAGN1HTA11_696_2000001011HumanColorectumAD4.77e-052.16e-01-0.1464
84522JAGN1HTA11_1391_2000001011HumanColorectumAD1.17e-083.18e-01-0.059
84522JAGN1HTA11_2992_2000001011HumanColorectumSER7.64e-032.44e-01-0.1706
84522JAGN1HTA11_5212_2000001011HumanColorectumAD1.39e-053.23e-01-0.2061
84522JAGN1HTA11_5216_2000001011HumanColorectumSER1.71e-024.21e-01-0.1462
84522JAGN1HTA11_866_3004761011HumanColorectumAD8.19e-092.68e-010.096
84522JAGN1HTA11_8622_2000001021HumanColorectumSER2.14e-043.07e-010.0528
84522JAGN1HTA11_7696_3000711011HumanColorectumAD7.36e-102.86e-010.0674
84522JAGN1HTA11_7469_2000001011HumanColorectumAD2.07e-055.48e-01-0.0124
84522JAGN1HTA11_99999970781_79442HumanColorectumMSS8.21e-102.99e-010.294
84522JAGN1HTA11_99999965104_69814HumanColorectumMSS2.06e-063.20e-010.281
84522JAGN1HTA11_99999971662_82457HumanColorectumMSS2.22e-195.40e-010.3859
84522JAGN1HTA11_99999974143_84620HumanColorectumMSS6.86e-092.77e-010.3005
Page: 1 2 3 4 5 6 7 8 

check button Transcriptomic changes along malignancy continuum.
TissueExpression DynamicsAbbreviation
Colorectum (GSE201348)The image shows the transcriptomic changes along malignancy continuum.log2FC in expression of this searched gene in stem-like cells from each diseased tissue sample relative to stem-like cells in normal samples in each tissue plotted against the malignancy continuum. Samples are colored based on if they are from different disease stage.
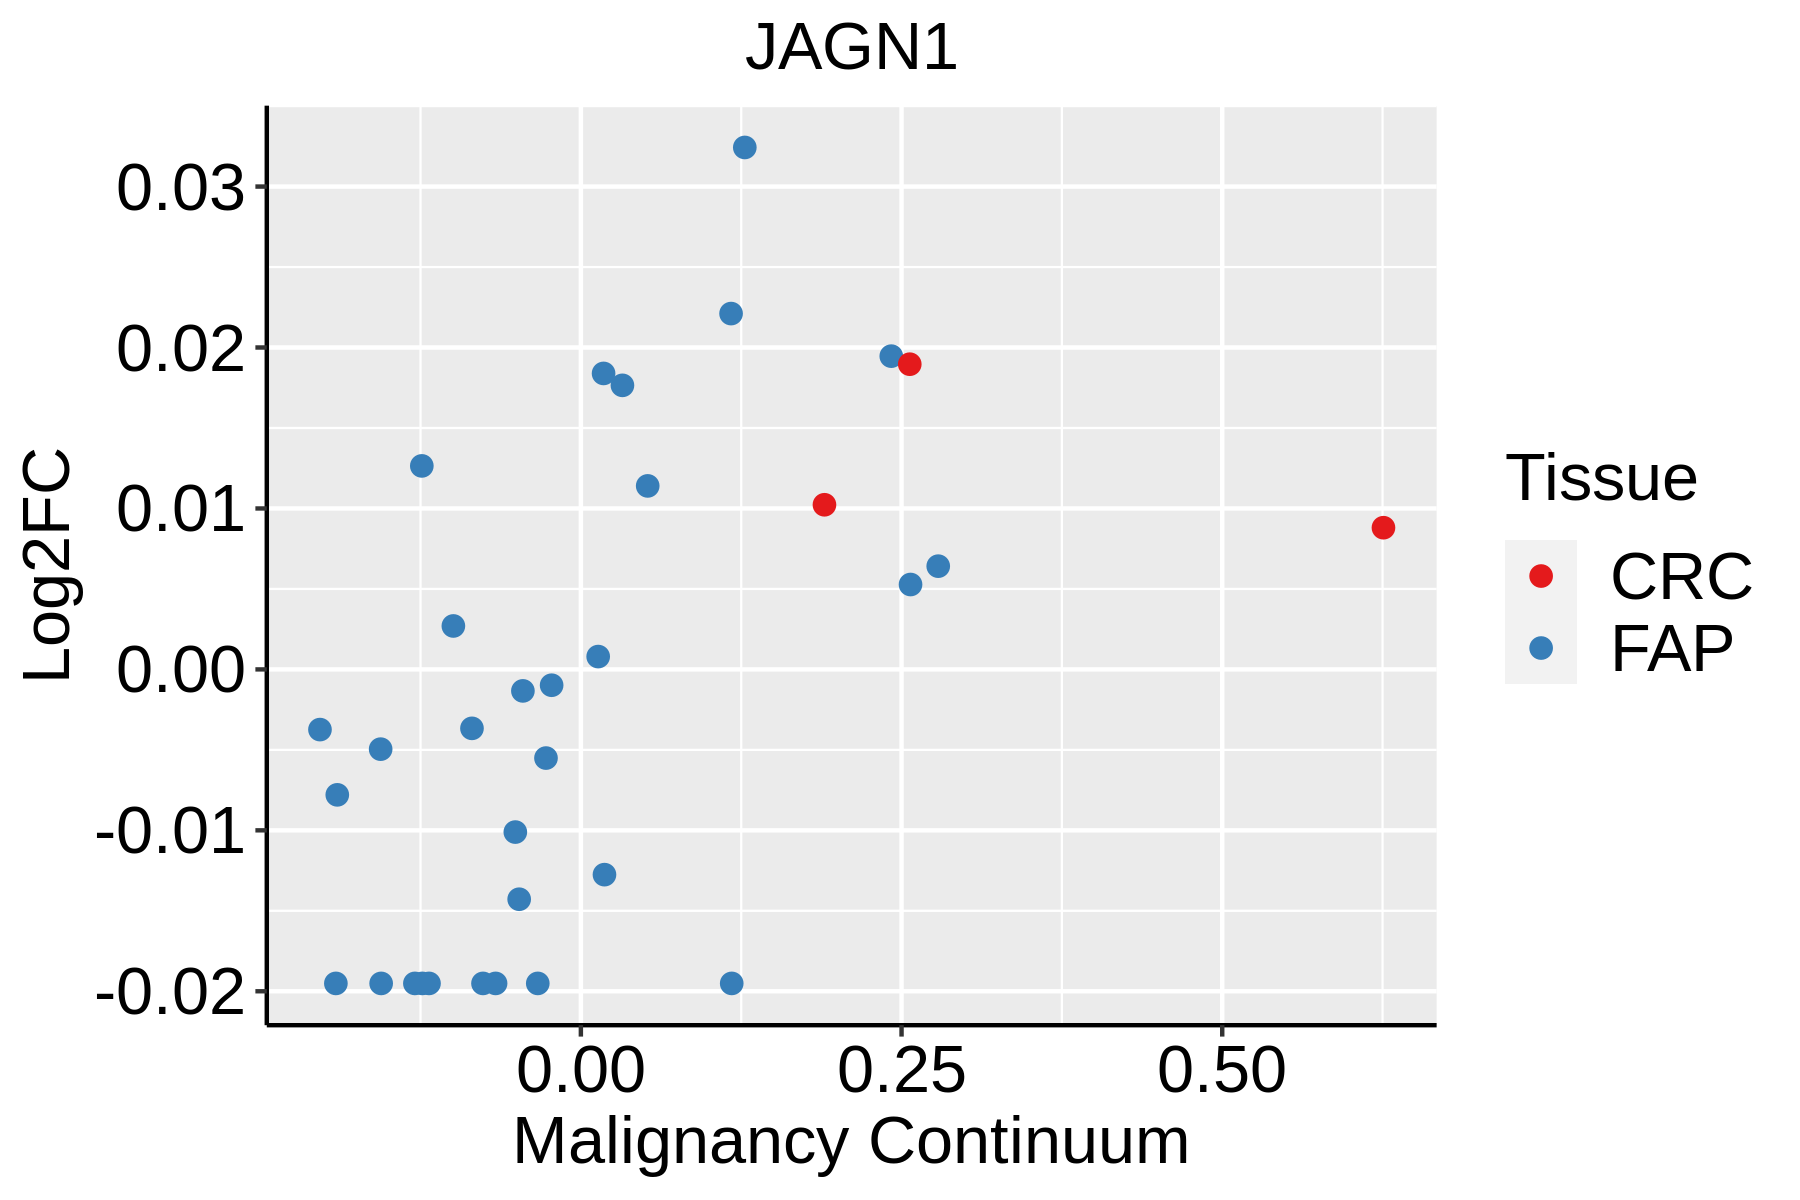
FAP: Familial adenomatous polyposis
CRC: Colorectal cancer
Colorectum (HTA11)The image shows the transcriptomic changes along malignancy continuum.log2FC in expression of this searched gene in stem-like cells from each diseased tissue sample relative to stem-like cells in normal samples in each tissue plotted against the malignancy continuum. Samples are colored based on if they are from different disease stage.AD: Adenomas
SER: Sessile serrated lesions
MSI-H: Microsatellite-high colorectal cancer
MSS: Microsatellite stable colorectal cancer
EsophagusThe image shows the transcriptomic changes along malignancy continuum.log2FC in expression of this searched gene in stem-like cells from each diseased tissue sample relative to stem-like cells in normal samples in each tissue plotted against the malignancy continuum. Samples are colored based on if they are from different disease stage.
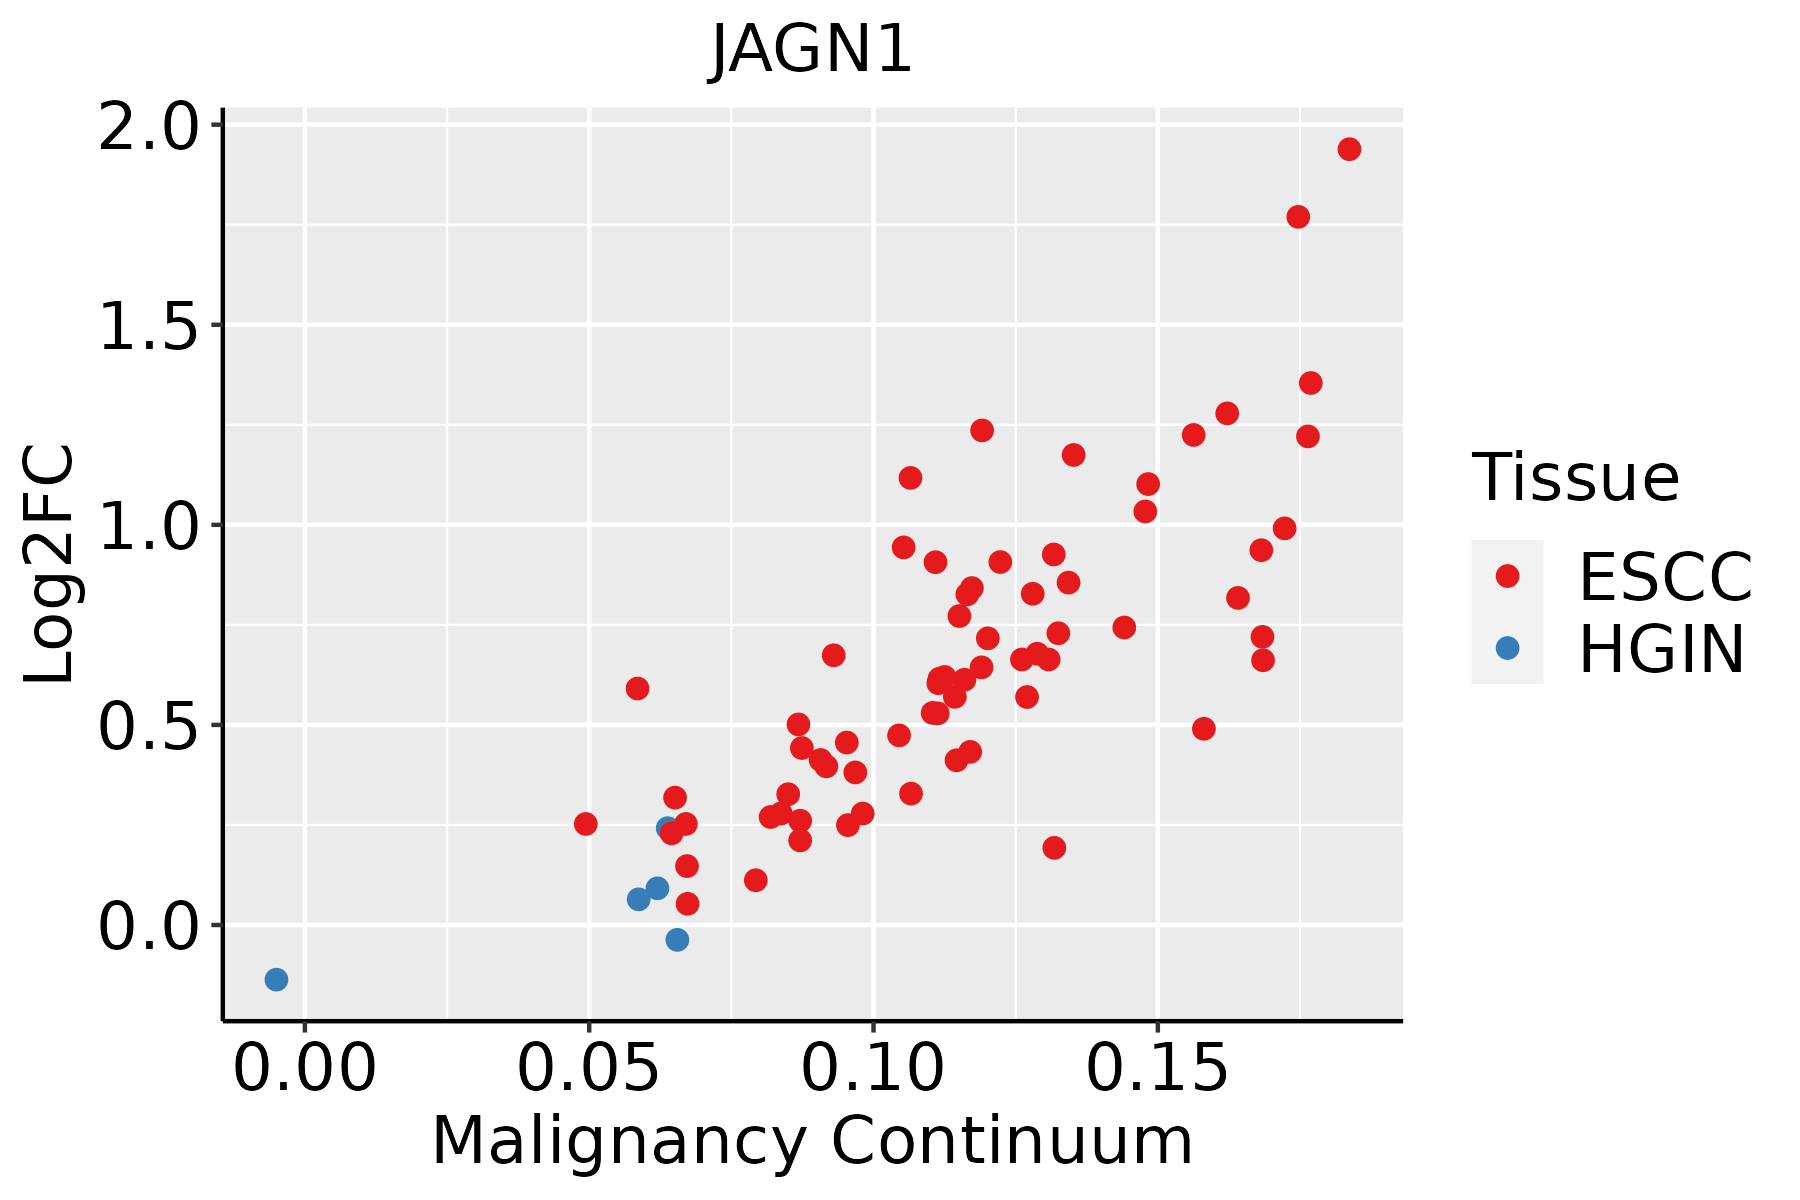
ESCC: Esophageal squamous cell carcinoma
HGIN: High-grade intraepithelial neoplasias
LGIN: Low-grade intraepithelial neoplasias
LiverThe image shows the transcriptomic changes along malignancy continuum.log2FC in expression of this searched gene in stem-like cells from each diseased tissue sample relative to stem-like cells in normal samples in each tissue plotted against the malignancy continuum. Samples are colored based on if they are from different disease stage.
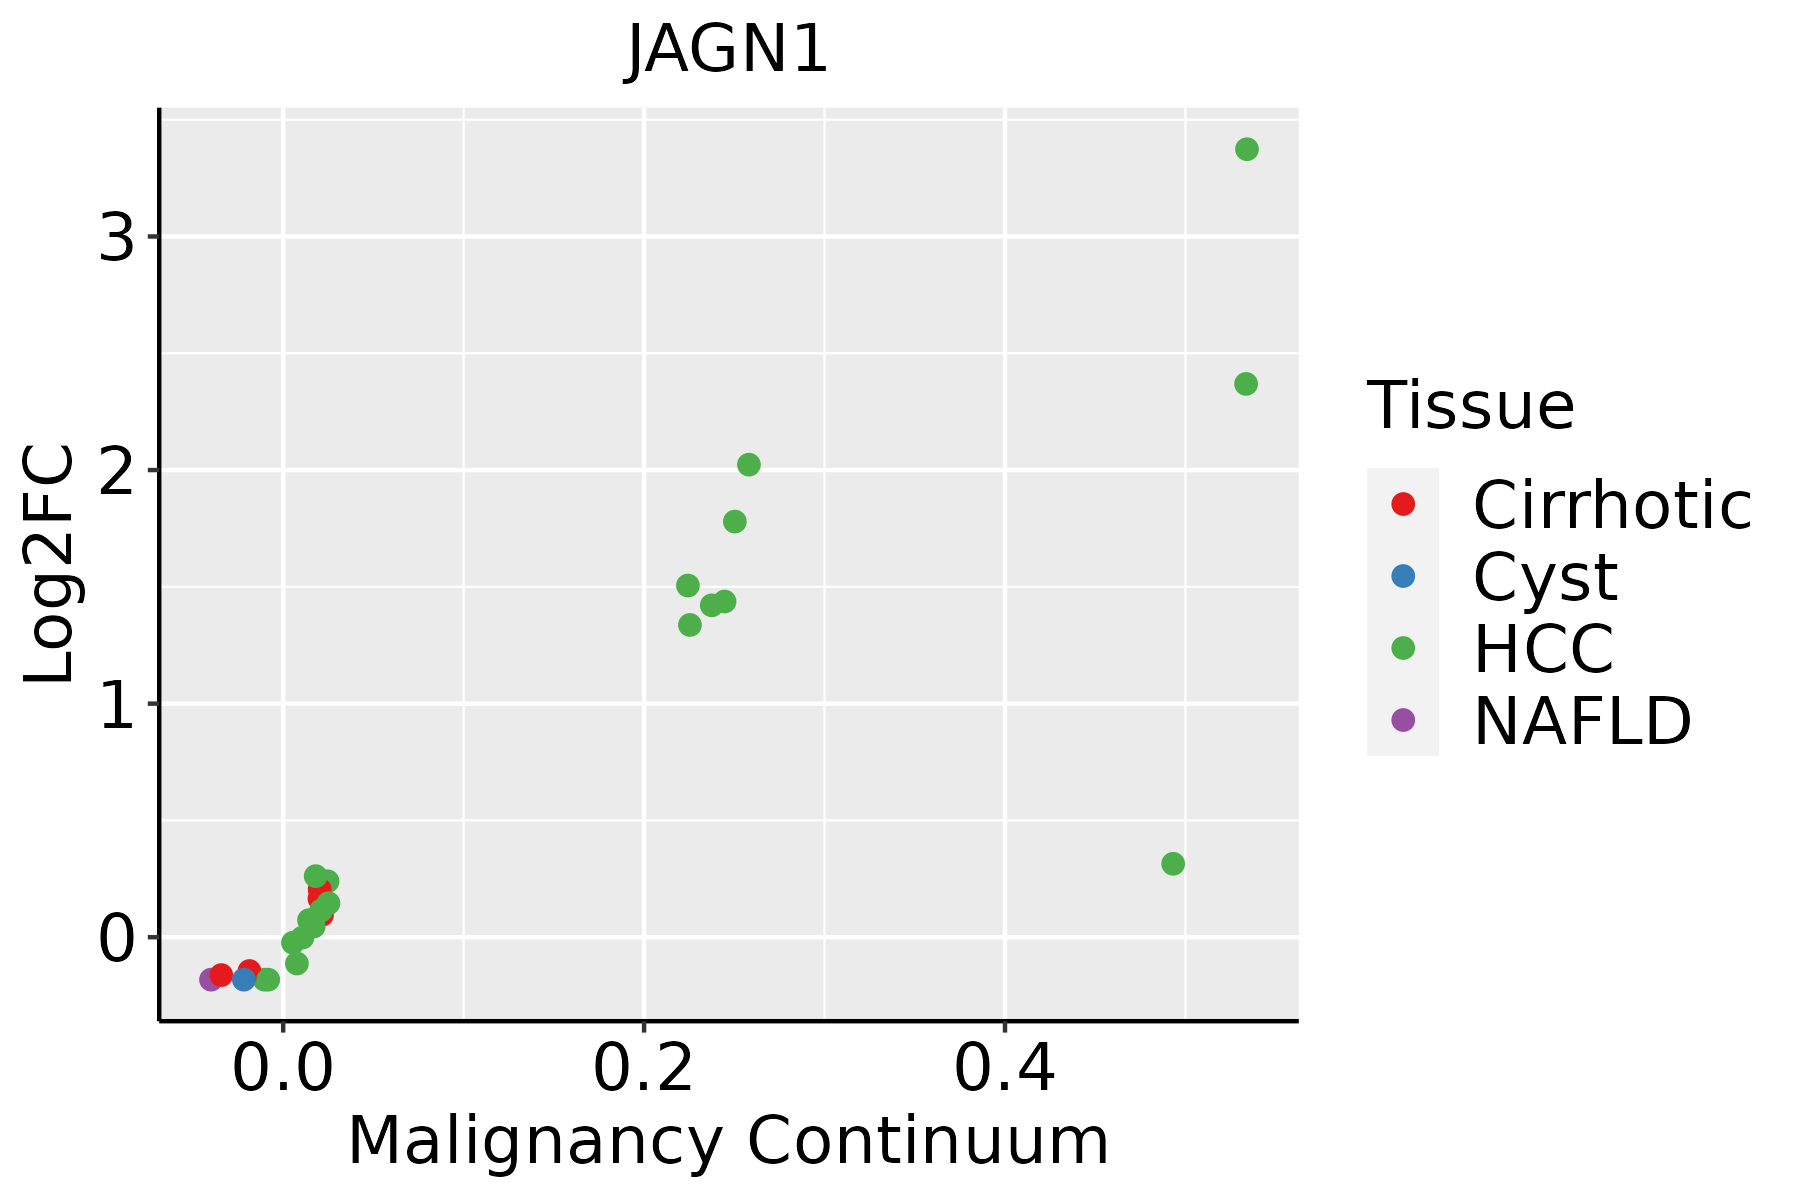
HCC: Hepatocellular carcinoma
NAFLD: Non-alcoholic fatty liver disease
Oral CavityThe image shows the transcriptomic changes along malignancy continuum.log2FC in expression of this searched gene in stem-like cells from each diseased tissue sample relative to stem-like cells in normal samples in each tissue plotted against the malignancy continuum. Samples are colored based on if they are from different disease stage.
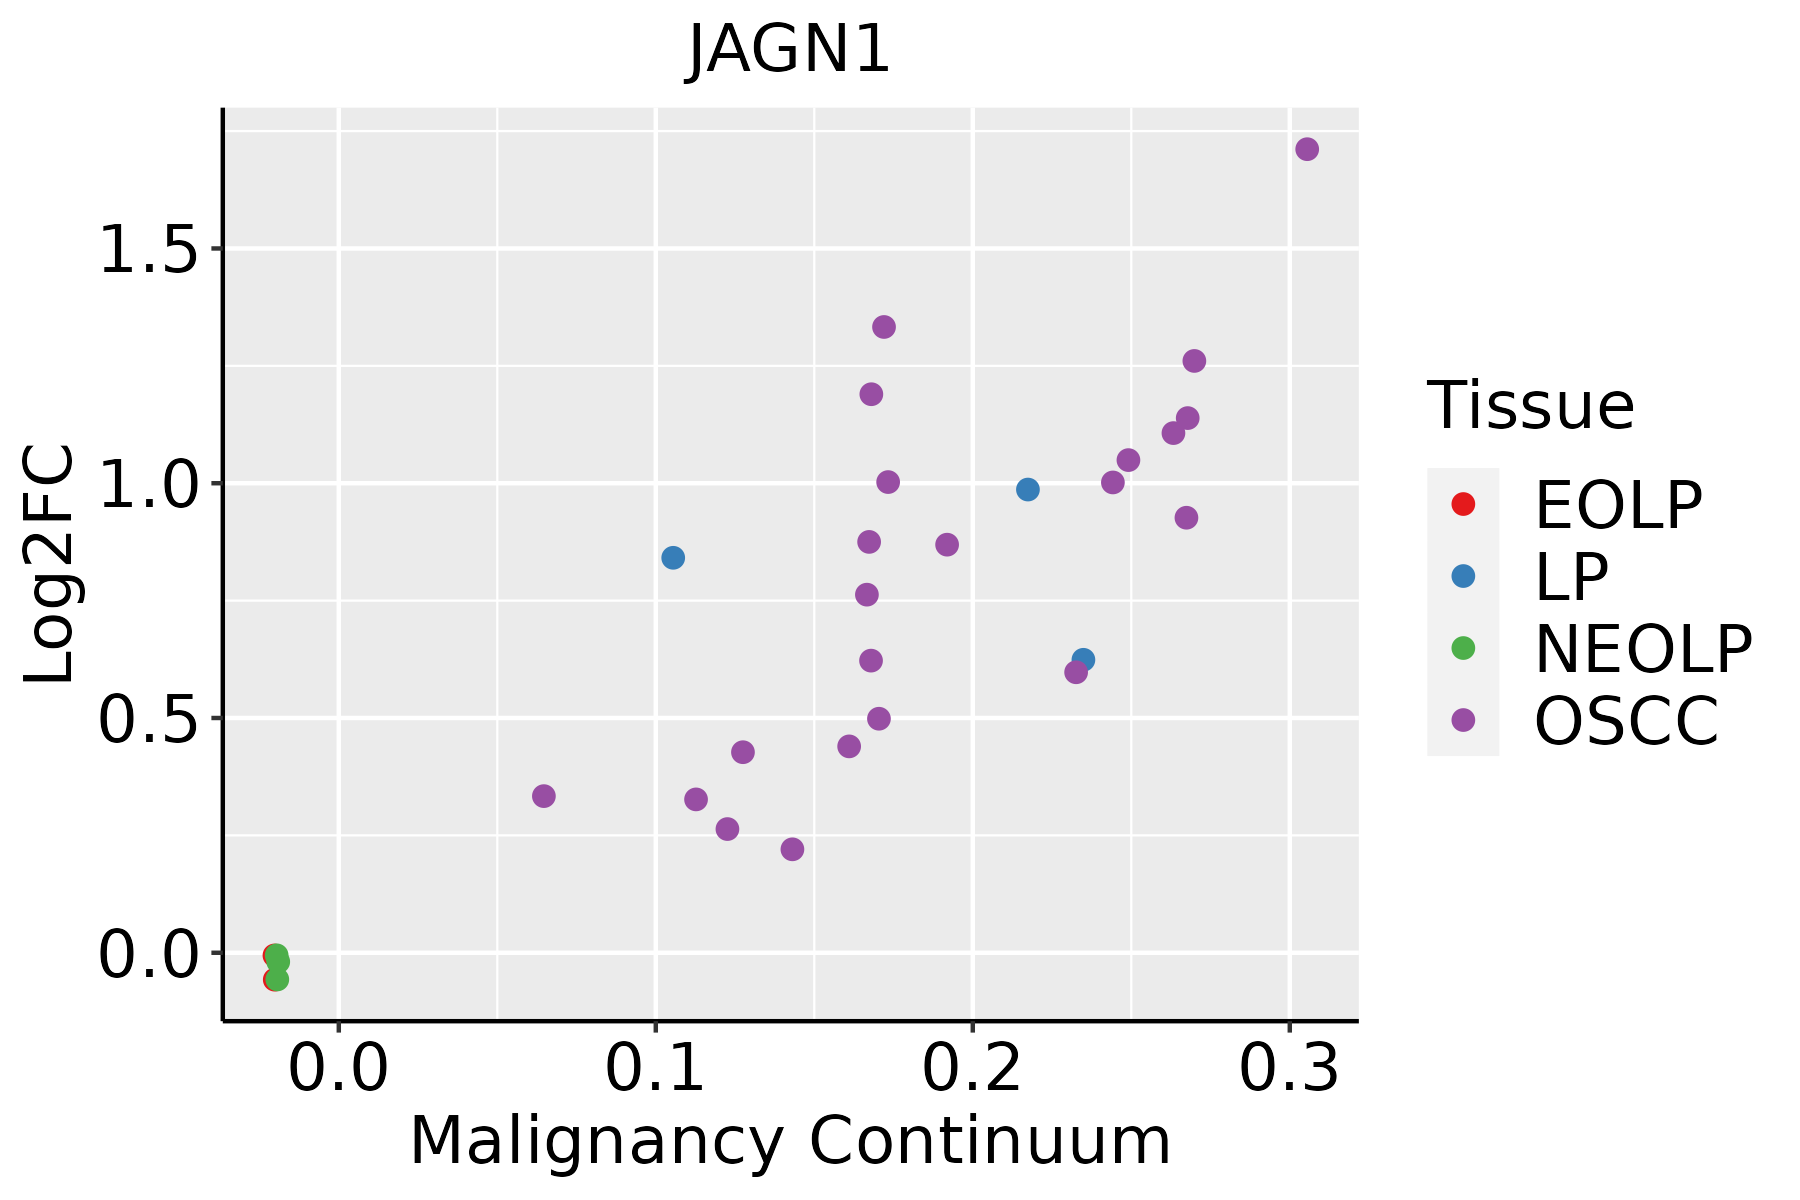
EOLP: Erosive Oral lichen planus
LP: leukoplakia
NEOLP: Non-erosive oral lichen planus
OSCC: Oral squamous cell carcinoma
ProstateThe image shows the transcriptomic changes along malignancy continuum.log2FC in expression of this searched gene in stem-like cells from each diseased tissue sample relative to stem-like cells in normal samples in each tissue plotted against the malignancy continuum. Samples are colored based on if they are from different disease stage.
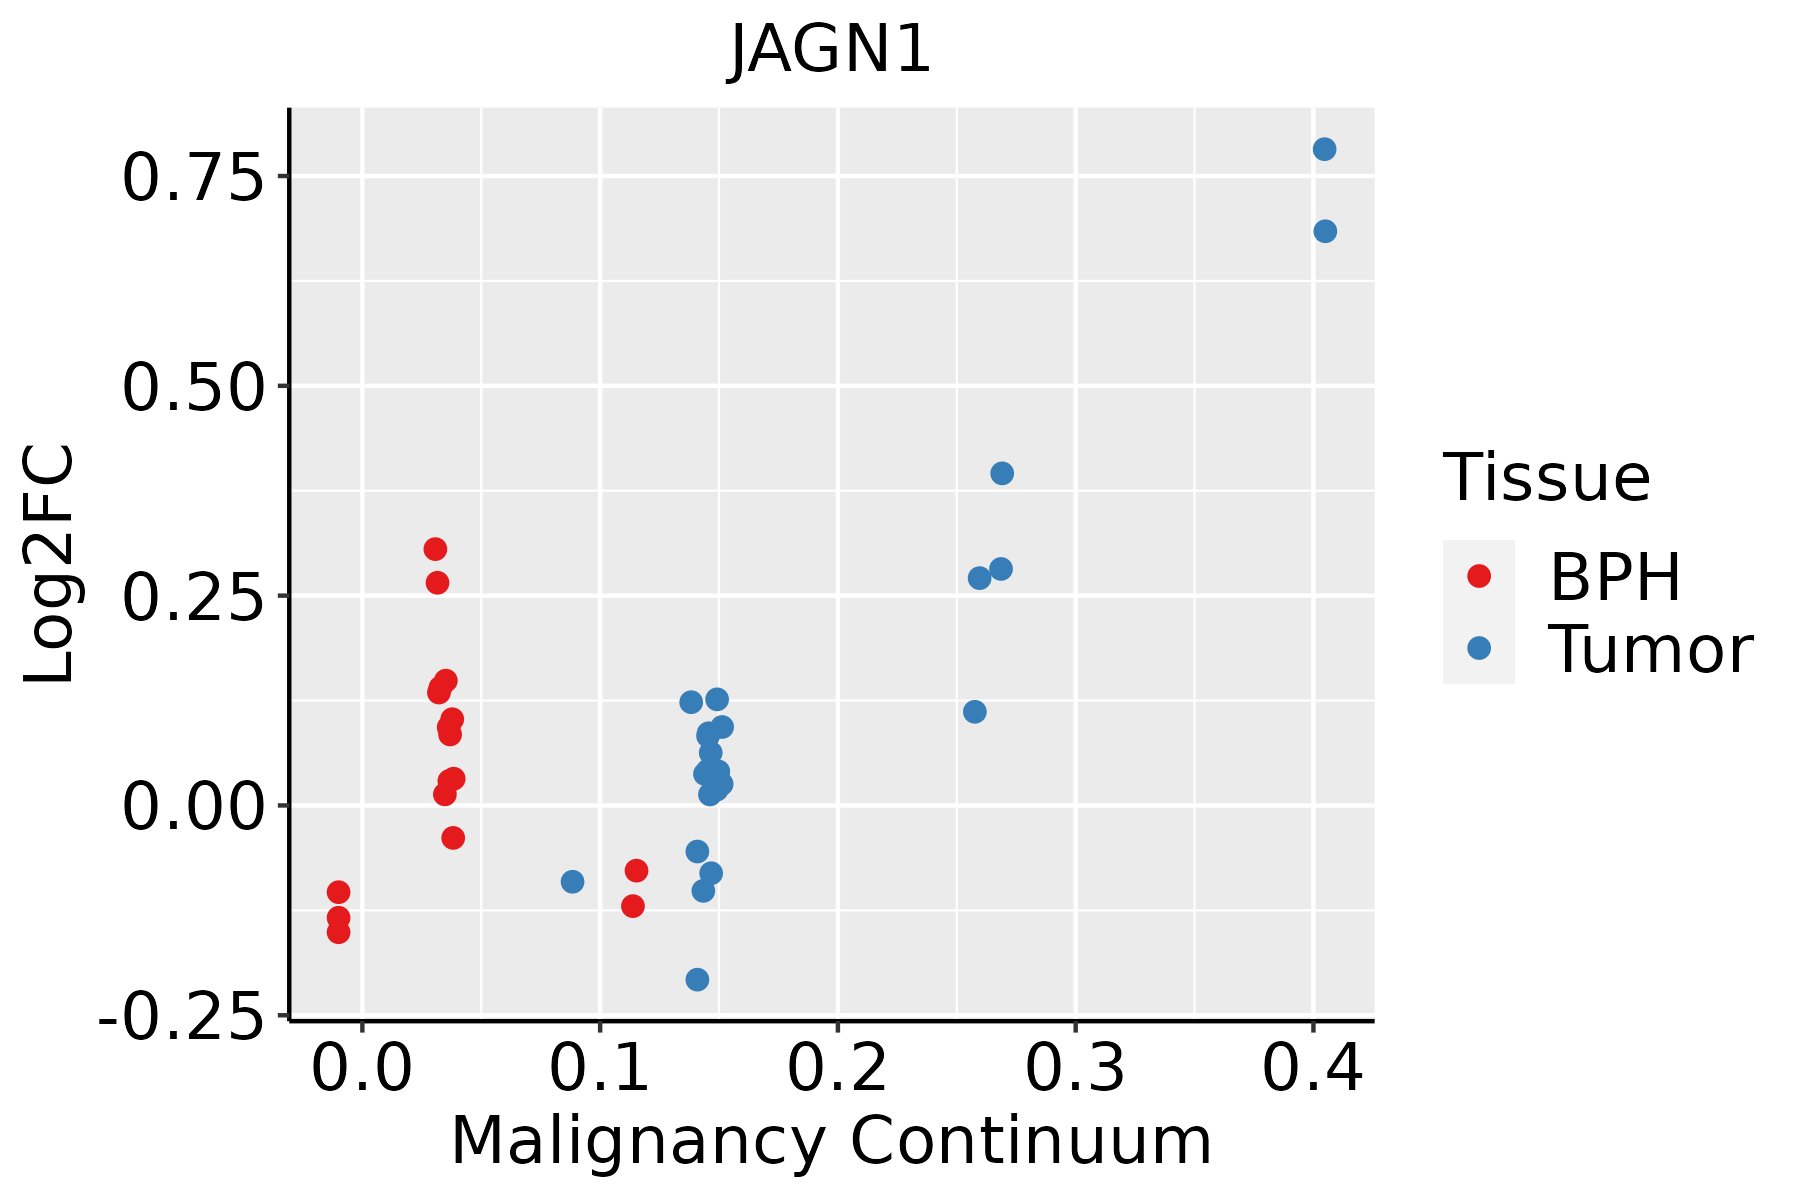
BPH: Benign Prostatic Hyperplasia
SkinThe image shows the transcriptomic changes along malignancy continuum.log2FC in expression of this searched gene in stem-like cells from each diseased tissue sample relative to stem-like cells in normal samples in each tissue plotted against the malignancy continuum. Samples are colored based on if they are from different disease stage.
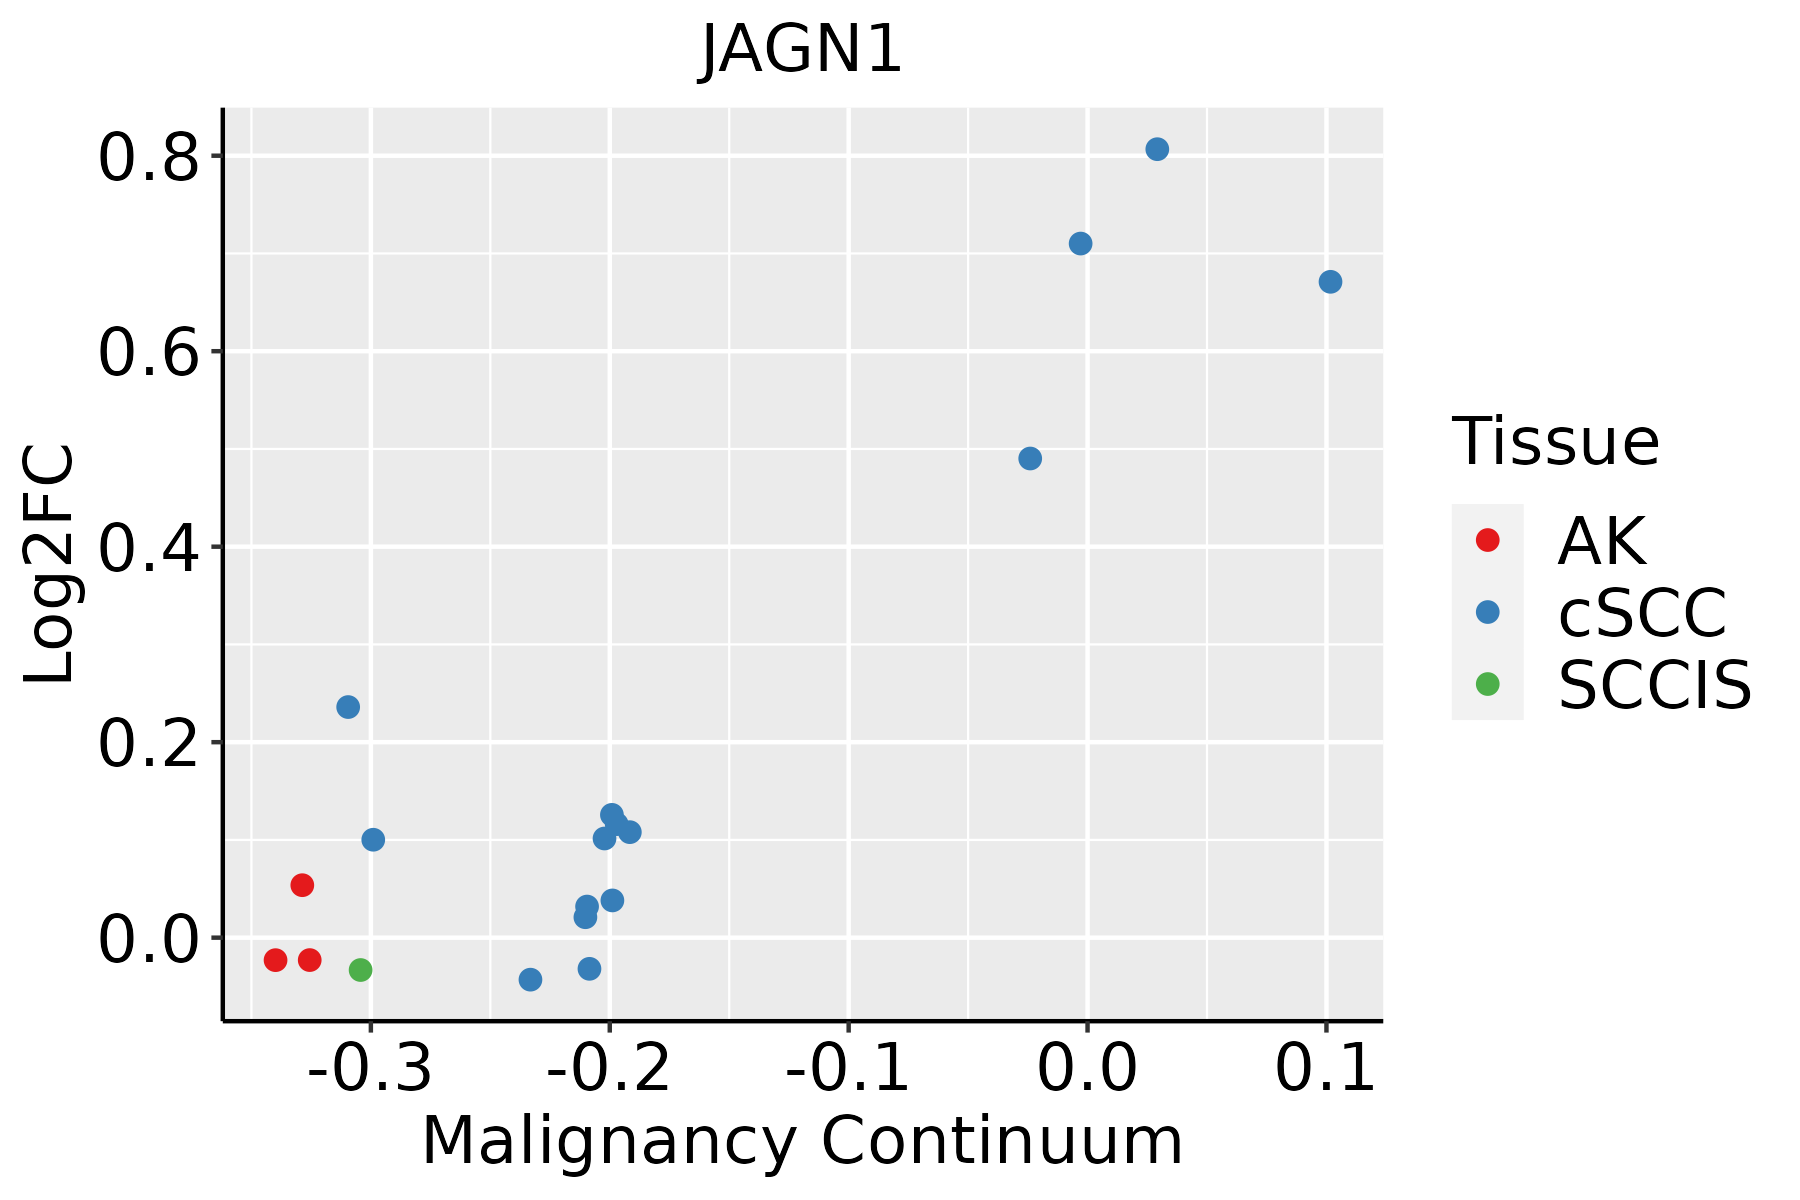
AK: Actinic keratosis
cSCC: Cutaneous squamous cell carcinoma
SCCIS:squamous cell carcinoma in situ
ThyroidThe image shows the transcriptomic changes along malignancy continuum.log2FC in expression of this searched gene in stem-like cells from each diseased tissue sample relative to stem-like cells in normal samples in each tissue plotted against the malignancy continuum. Samples are colored based on if they are from different disease stage.
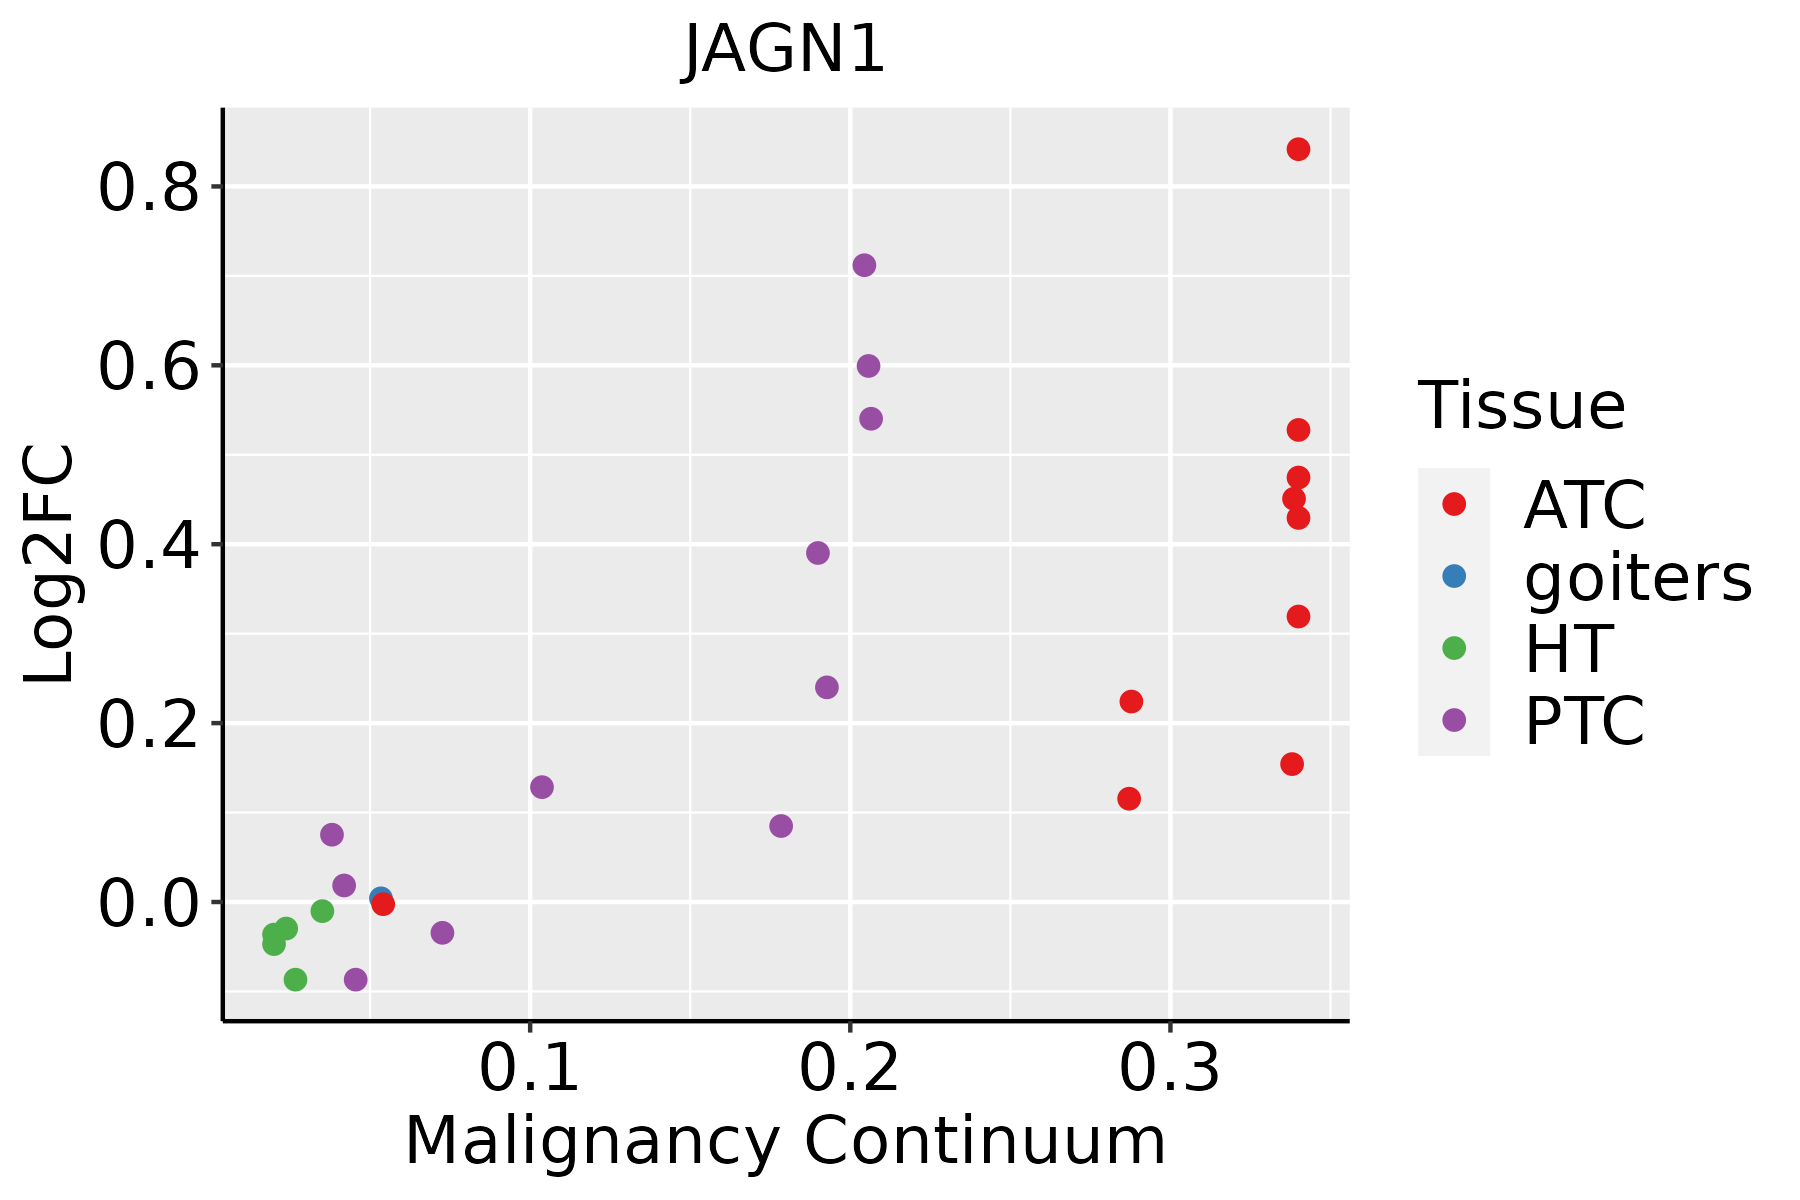
ATC: Anaplastic thyroid cancer
HT: Hashimoto's thyroiditis
PTC: Papillary thyroid cancer
∗log2FC in expression of this searched gene in stem-like cells from each diseased tissue sample relative to stem-like cells in normal samples in each tissue plotted against the malignancy continuum. Samples are colored based on if they are from different disease stage.

Top

Malignant transformation related pathway analysis

check buttonFind out the enriched GO biological processes and KEGG pathways involved in transition from healthy to precancer to cancer
check button Figure of enriched GO biological processes.
TissueDisease StageEnriched GO biological Processes
ColorectumADGO analysis - Figure of enriched GO biological processes: Top 15 enriched GO BP terms are showed in the bar plot of each disease state in each tissue. Each row represents a significant GO biological process which is colored according to the -log10(p.adjust).
ColorectumSERGO analysis - Figure of enriched GO biological processes: Top 15 enriched GO BP terms are showed in the bar plot of each disease state in each tissue. Each row represents a significant GO biological process which is colored according to the -log10(p.adjust).
ColorectumMSSGO analysis - Figure of enriched GO biological processes: Top 15 enriched GO BP terms are showed in the bar plot of each disease state in each tissue. Each row represents a significant GO biological process which is colored according to the -log10(p.adjust).
ColorectumMSI-HGO analysis - Figure of enriched GO biological processes: Top 15 enriched GO BP terms are showed in the bar plot of each disease state in each tissue. Each row represents a significant GO biological process which is colored according to the -log10(p.adjust).
ColorectumFAPGO analysis - Figure of enriched GO biological processes: Top 15 enriched GO BP terms are showed in the bar plot of each disease state in each tissue. Each row represents a significant GO biological process which is colored according to the -log10(p.adjust).
∗Top 15 enriched GO BP terms are showed in the bar plot of each disease state in each tissue. Each row represents a significant GO biological process which is colored according to the -log10(p.adjust).
Page: 1 2 3 4 5 6 7 8 9 

check button Enriched GO biological processes.
GO IDTissueDisease StageDescriptionGene RatioBg Ratiopvaluep.adjustCount
GO:0009743ColorectumADresponse to carbohydrate86/3918253/187238.43e-072.90e-0586
GO:0030099ColorectumADmyeloid cell differentiation119/3918381/187231.24e-064.01e-05119
GO:0034284ColorectumADresponse to monosaccharide76/3918225/187234.64e-061.23e-0476
GO:0033500ColorectumADcarbohydrate homeostasis84/3918259/187239.10e-062.15e-0484
GO:0009746ColorectumADresponse to hexose73/3918219/187231.20e-052.65e-0473
GO:0009749ColorectumADresponse to glucose71/3918212/187231.31e-052.85e-0471
GO:0042593ColorectumADglucose homeostasis83/3918258/187231.44e-053.11e-0483
GO:0001678ColorectumADcellular glucose homeostasis60/3918172/187231.49e-053.18e-0460
GO:0071322ColorectumADcellular response to carbohydrate stimulus56/3918163/187234.61e-057.97e-0456
GO:0050708ColorectumADregulation of protein secretion83/3918268/187236.59e-051.07e-0383
GO:0071333ColorectumADcellular response to glucose stimulus52/3918151/187237.88e-051.25e-0352
GO:0009306ColorectumADprotein secretion105/3918359/187231.05e-041.57e-03105
GO:0071331ColorectumADcellular response to hexose stimulus52/3918153/187231.16e-041.71e-0352
GO:0035592ColorectumADestablishment of protein localization to extracellular region105/3918360/187231.18e-041.73e-03105
GO:0071326ColorectumADcellular response to monosaccharide stimulus52/3918154/187231.40e-041.98e-0352
GO:0071692ColorectumADprotein localization to extracellular region106/3918368/187231.86e-042.49e-03106
GO:0050796ColorectumADregulation of insulin secretion54/3918165/187232.60e-043.25e-0354
GO:0030073ColorectumADinsulin secretion61/3918195/187234.28e-044.81e-0361
GO:0061178ColorectumADregulation of insulin secretion involved in cellular response to glucose stimulus25/391864/187236.98e-047.10e-0325
GO:0015833ColorectumADpeptide transport77/3918264/187238.90e-048.60e-0377
Page: 1 2 3 4 5 6 7 8 9 10 11 12 13 14 

check button Enriched KEGG pathways.
Pathway IDTissueDisease StageDescriptionGene RatioBg Ratiopvaluep.adjustqvalueCount
Page: 1 

Top

Cell-cell communication analysis

check buttonIdentification of potential cell-cell interactions between two cell types and their ligand-receptor pairs for different disease states
LigandReceptorLRpairPathwayTissueDisease Stage
Page: 1 

Top

Single-cell gene regulatory network inference analysis

check buttonFind out the significant the regulons (TFs) and the target genes of each regulon across cell types for different disease states
TFCell TypeTissueDisease StageTarget GeneRSSRegulon Activity
∗The dot plots of a searched regulon are shown for all cell subpopulations in each disease state of each tissue based on the regulon specific score inferred using pySCENIC and by calculating the average expression.
Page: 1 

Top

Somatic mutation of malignant transformation related genes

check buttonAnnotation of somatic variants for genes involved in malignant transformation
Hugo SymbolVariant ClassVariant ClassificationdbSNP RSHGVScHGVSpHGVSp ShortSWISSPROTBIOTYPESIFTPolyPhenTumor Sample BarcodeTissueHistologySexAgeStageTherapy TypesDrugsOutcome
JAGN1insertionIn_Frame_Insnovelc.172_173insAAGTCTCACTCTGCACTCTGTCCCCCAp.Gly58delinsGluValSerLeuCysThrLeuSerProArgp.G58delinsEVSLCTLSPRQ8N5M9protein_codingTCGA-A8-A0A6-01Breastbreast invasive carcinomaFemale<65III/IVChemotherapyepirubicinCR
JAGN1SNVMissense_Mutationnovelc.540N>Tp.Lys180Asnp.K180NQ8N5M9protein_codingdeleterious_low_confidence(0)probably_damaging(0.977)TCGA-CA-6717-01Colorectumcolon adenocarcinomaMale<65I/IIChemotherapyoxaliplatinCR
JAGN1SNVMissense_Mutationnovelc.287A>Cp.Asn96Thrp.N96TQ8N5M9protein_codingtolerated(0.08)benign(0.03)TCGA-AP-A1E0-01Endometriumuterine corpus endometrioid carcinomaFemale<65III/IVChemotherapypaclitaxelSD
JAGN1SNVMissense_Mutationrs542419840c.392G>Ap.Arg131Hisp.R131HQ8N5M9protein_codingdeleterious(0.02)possibly_damaging(0.782)TCGA-B5-A3FC-01Endometriumuterine corpus endometrioid carcinomaFemale<65I/IIUnknownUnknownSD
JAGN1SNVMissense_Mutationc.410N>Ap.Arg137Hisp.R137HQ8N5M9protein_codingdeleterious(0.03)benign(0.015)TCGA-BS-A0UM-01Endometriumuterine corpus endometrioid carcinomaFemale<65I/IIChemotherapyadriamycinSD
JAGN1SNVMissense_Mutationc.490N>Cp.Tyr164Hisp.Y164HQ8N5M9protein_codingdeleterious(0)probably_damaging(0.995)TCGA-RC-A7SK-01Liverliver hepatocellular carcinomaMale<65I/IIUnknownUnknownPD
JAGN1SNVMissense_Mutationnovelc.43N>Gp.Ser15Glyp.S15GQ8N5M9protein_codingdeleterious(0.04)benign(0.146)TCGA-34-A5IX-01Lunglung squamous cell carcinomaMale>=65I/IIUnknownUnknownSD
JAGN1SNVMissense_Mutationc.206N>Ap.Ala69Aspp.A69DQ8N5M9protein_codingtolerated(0.26)benign(0.255)TCGA-66-2759-01Lunglung squamous cell carcinomaMale>=65III/IVChemotherapycarboplatinCR
JAGN1SNVMissense_Mutationnovelc.162G>Cp.Lys54Asnp.K54NQ8N5M9protein_codingdeleterious(0.01)benign(0.038)TCGA-85-8354-01Lunglung squamous cell carcinomaMale<65I/IIUnknownUnknownSD
JAGN1insertionIn_Frame_Insnovelc.500_501insATACGGp.Lys167_Lys168insTyrGlyp.K167_K168insYGQ8N5M9protein_codingTCGA-CN-A497-01Oral cavityhead & neck squamous cell carcinomaMale<65III/IVUnknownUnknownSD
Page: 1 2 

Top

Related drugs of malignant transformation related genes

check buttonIdentification of chemicals and drugs interact with genes involved in malignant transfromation
(DGIdb 4.0)
Entrez IDSymbolCategoryInteraction TypesDrug Claim NameDrug NamePMIDs
Page: 1